. 2017 Nov 21;16(1):174.
doi: 10.1186/s12943-017-0743-3.

Long noncoding RNA MALAT1 regulates autophagy associated chemoresistance via miR-23b-3p sequestration in gastric cancer

Affiliations

Long noncoding RNA MALAT1 regulates autophagy associated chemoresistance via miR-23b-3p sequestration in gastric cancer

Hu YiRen et al. Mol Cancer. .

Abstract

Background: Chemoresistance has long been recognized as a major obstacle in cancer therapy. Clarifying the underlying mechanism of chemoresistance would result in novel strategies to improve patient's response to chemotherapeutics.

Methods: lncRNA expression levels in gastric cancer (GC) cells was detected by quantitative real-time PCR (qPCR). MALAT1 shRNAs and overexpression vector were transfected into GC cells to down-regulate or up-regulate MALAT1 expression. In vitro and in vivo assays were performed to investigate the functional role of MALAT1 in autophagy associated chemoresistance.

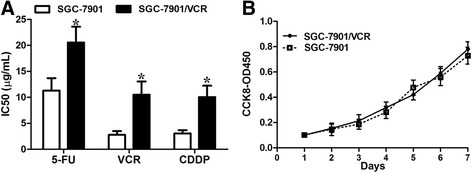
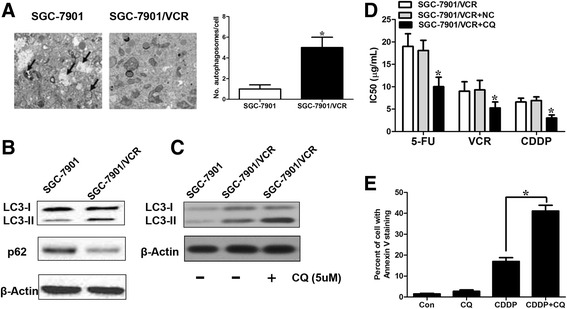
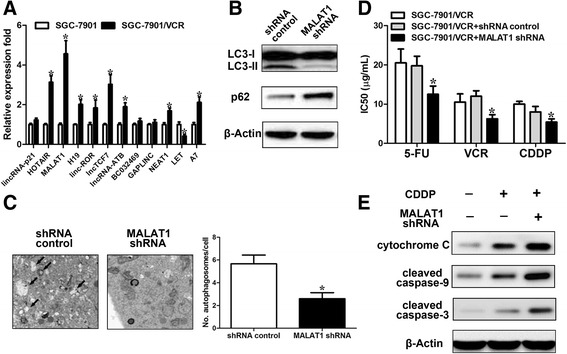
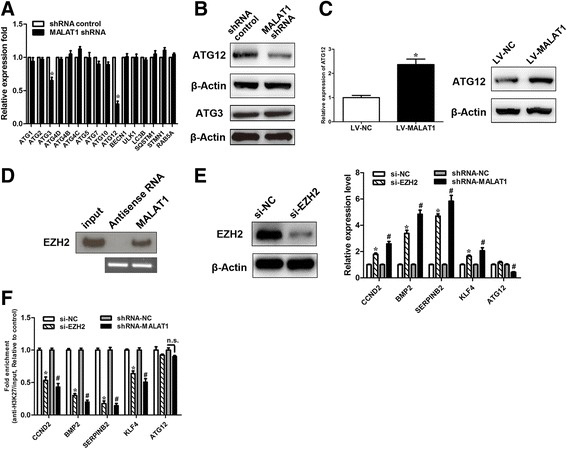
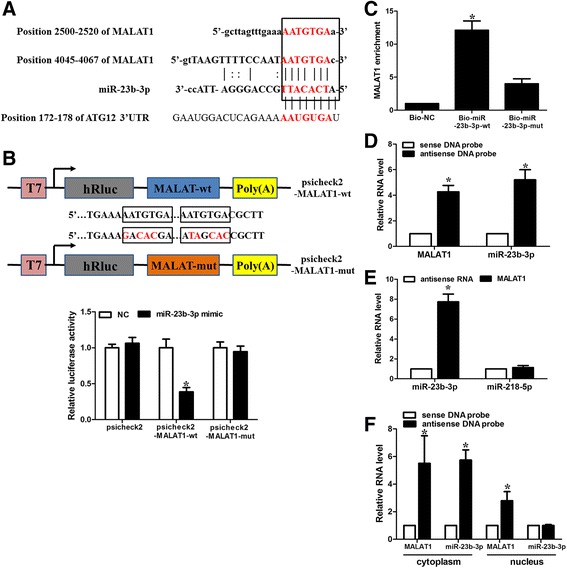
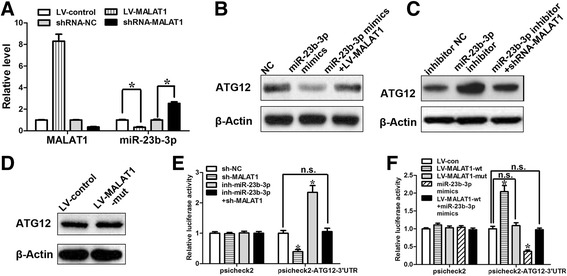
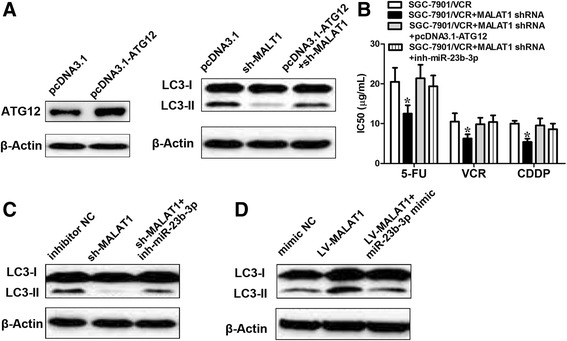
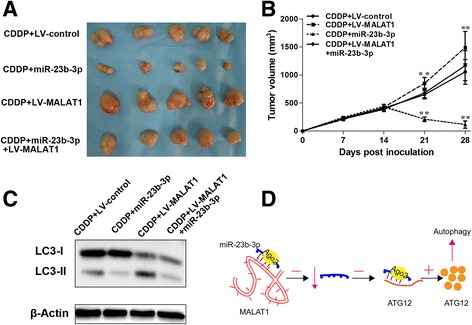
Results: We showed that chemoresistant GC cells had higher levels of MALAT1 and increased autophagy compared with parental cells. Silencing of MALAT1 inhibited chemo-induced autophagy, whereas MALAT1 promoted autophagy in gastric cancer cells. Knockdown of MALAT1 sensitized GC cells to chemotherapeutics. MALAT1 acts as a competing endogenous RNA for miR-23b-3p and attenuates the inhibitory effect of miR-23b-3p on ATG12, leading to chemo-induced autophagy and chemoresistance in GC cells.

Conclusions: Taken together, our study revealed a novel mechanism of lncRNA-regulated autophagy-related chemoresistance in GC, casting new lights on the understanding of chemoresistance.

Keywords: Autophagy; Chemoresistance; Gastric cancer; MALAT1; lncRNA.


Conflict of interest statement

Competing interests

The authors declare that they have no competing interests.

Publisher’s Note

Springer Nature remains neutral with regard to jurisdictional claims in published maps and institutional affiliations.

Figures

Fig. 1
Fig. 1
SGC7901/VCR had increased chemoresistance. a SGC7901/VCR cells harbored increased IC50 values compared with SGC7901 cells in response to chemotherapeutics. b The cell growth rates were determined by performing CCK-8 proliferation assays. SGC7901/VCR cells had similar cell proliferation rate, relative to control cells, in the absence of chemotherapeutics. The data are presented as the means ± S.D. of values obtained in 3 independent experiments. *, p < 0.05
Fig. 2
Fig. 2
SGC7901/VCR cells exhibit increased autophagy. a Autophagy was evaluated in SGC7901/VCR cells that exhibited chemoresistance using transmission electron microscopy. The data were quantified by counting the number of autophagosomes per cross-sectioned cell. b Autophagosome formation in whole cell lysates was determined by Western blot analysis using LC3 and p62 antibodies. The top band (16 kilodaltons) represents LC3-I, and the bottom band (14 kilodaltons) represents LC3-II. c SGC7901/VCR cells and their parental cell lines were treated with 10 mmol/L CQ for 24 hours before being subjected to Western blot analysis for LC3 expression. d CQ greatly enhanced the sensitivity of SGC7901/VCR cells to chemotherapeutic agents. e flow cytometric analysis of Annexin V staining. The data are presented as the means ± S.D. of values obtained in 3 independent experiments. *, p < 0.05
Fig. 3
Fig. 3
MALAT1 promotes autophagy in GC cells. a Relative mRNA levels of specific lncRNAs in SGC7901/VCR and SGC7901 cells using real-time PCR. b SGC7901/VCR cells stably transfected with shRNA-MALAT1 or a control were subjected to Western blot analysis of LC3-II and p62. c Autophagy was evaluated using transmission electron microscopy in SGC7901/VCR stably transfected with shRNA-MALAT1 or a control. d Silencing of MALAT1 sensitized SGC7901/VCR cells to chemotherapeutic agents as evidenced by decreased IC50 values. e SGC7901/VCR cells were treated with the cisplatin (10 μg/ml) for 24 h. Total protein as well as cytoplasmic protein fractions were isolated, and the indicated proteins were detected by Western blot. The data are presented as the means ± S.D. of values obtained in 3 independent experiments. *, p < 0.05
Fig. 4
Fig. 4
MALAT1 regulates ATG12. a The mRNA expression of the indicated autophagy related genes was measured using real-time PCR in SGC7901/VCR cells stably transfected with shRNA-MALAT1 or a control. Student t tests were used to determine the statistical significance of the differences between the groups. b Western blot analysis of ATG12 and ATG3 was performed in SGC7901/VCR cells stably transfected with shRNA-MALAT1 or a control. c The mRNA or protein levels of ATG12 were determined using real-time PCR and Western blot analysis in SGC7901/VCR cells stably transfected with shRNA-MALAT1 or a control. d Biotinylated MALAT1 or antisense RNA was incubated with cell extracts of SGC7901/VCR cells, targeted with streptavidin beads, and washed, and the associated proteins were resolved on a gel. Western blot analysis detected the specific association of EZH2 and MALAT1 (n=3). e EZH2 knockdown efficiency was confirmed by Western blot. qRT-PCR analysis of putative PRC2 target genes after MALAT1 and EZH2 knockdown, respectively. f ChIP analysis of H3K27 trimethylation status of candidate EZH2 target genes after knockdown assay. The data are presented as the means ± S.D. of values obtained in 3 independent experiments. #, p < 0.05. *, p < 0.05. n.s., not significant
Fig. 5
Fig. 5
MALAT1 is a molecular sponge for miR-23b-3p. a Illustration of the base pairing between miR-23b-3p and MALAT1. The base pairing between miR-23b-3p and ATG12 3’UTR is also shown. b Schematic representation of psicheck2-based luciferase reporter plasmid containing wild-type MALAT1 (psicheck2-MALAT1-wt) and a mutant reporter construct in which two putative miR-23b-3p binding sites were mutated (psicheck2-MALAT1-mut), and mutated bases are indicated in red. miR-23b-3p or control mimics were transfected into SGC7901/VCR cells together with the indicated psicheck2-based luciferase reporter construct. Twenty-four hours after transfection, reporter activity was measured and plotted after normalizing with respect to Renilla luciferase activity. c miR-23b-3p can bind directly to MALAT1. SGC7901/VCR cells were transfected with biotinylated wild-type miR-23b-3p (Bio-23b-3p-wt) or biotinylated mutant miR-23b-3p (Bio-23b-3p-mut). A biotinylated miRNA that is not complementary to MALAT1 was used as a negative control (Bio-NC). Forty-eight hours after transfection, cells were harvested for biotin-based pull-down assay. MALAT1 expression levels were analysed by real-time PCR. *, p<0.05 versus Bio-NC. d Lysates from SGC7901/VCR cells were incubated with in vitro-synthesized biotin-labeled sense or antisense DNA probes against MALAT1 for biotin pull-down assay, followed by real-time RT–PCR analysis to examine miR-23b-3p levels. e Lysates from SGC7901/VCR cells were incubated with in vitro-synthesized biotin-labeled MALAT1 and antisense RNA for biotin pull-down assay, followed by real-time RT–PCR analysis to examine miR-23b-3p and miR-218-5p levels. f SGC7901/VCR cells were subjected to cytoplasm or nucleus fractionation before each fraction was incubated with in vitro-synthesized biotin-labeled sense or antisense DNA probes of MALAT1 for biotin pull-down assay, followed by real-time RT–PCR analysis to examine miR-23b-3p levels. Data shown are means ± S.D. (n = 3; *, p < 0.05, two-tailed t-test). *, p < 0.05
Fig. 6
Fig. 6
MALAT1 relieves the inhibitory effect of miR-23b-3p on ATG12. a SGC7901/VCR cells were infected with lentiviruses expressing control shRNA or MALAT1 shRNA. Forty-eight hours after infection, total RNA was subjected to real-time RT–PCR analysis. b The protein levels of ATG12 in SGC7901/VCR cells transfected with mimic control, miR-23b-3p mimics, miR-23b-3p mimics +LV-MALAT1. c The protein levels of ATG12 in SGC7901/VCR cells transfected with inhibitor control, miR-23b-3p inhibitor, miR-23b-3p inhibitor+shRNA-MALAT1. d Overexpression of miR-23b-3p binding-defective MALAT1 had no significant effect on the expression of ATG12 in SGC7901/VCR cells. e, f Luciferase activity in SGC7901/VCR cells transfected with luciferase reporters containing ATG12 3’-UTR or nothing. Data are represented as the relative ratio of firefly luciferase activity to Renilla luciferase activity. Error bars represent the mean±S.D. of triplicate experiments. *, p < 0.05
Fig. 7
Fig. 7
MALAT1 regulates autophagy via ATG12. a Western blot analysis to confirm the efficacy of overexpression of ATG12. SGC7901/VCR cells were transfected with pcDNA3.1- empty vector, shRNA-MALAT1, shRNA-MALAT1+ pcDNA3.1-ATG12. LC3-II expression was evaluated by Western blot. b The decreased IC50 values induced by MALAT1 knockdown could be relieved by ATG12 or miR-23b-3p inhibitors. c SGC7901/VCR cells were transfected with inhibitor NC, shRNA-MALAT1, shRNA-MALAT1+ miR-23b-3p inhibitor. LC3-II expression was evaluated by Western blot. d SGC7901/VCR cells were transfected with inhibitor NC, LV-MALAT1, LV-MALAT1+ miR-23b-3p mimics. LC3-II expression was evaluated by Western blot. Data shown are means ± S.D. (n = 3; two-tailed t-test). *, p < 0.05
Fig. 8
Fig. 8
The restoration of miR-23b-3p reversed the drug resistance induced by MALAT1 overexpression in vivo. 1.0 × 10⁷ SGC7901/VCR cells stably transfected with lenti-MALAT1 or lenti-NC or lenti-MALAT1+miR-23b-3p were subcutaneously injected into the flank of nude mice. Two weeks later, the mice were intraperitoneally injected with PBS containing CDDP (10 mg/kg) once per week. The mice were humanely killed on day 28, and the tumors were measured and photographed. Tumor volumes (a) and tumor growth curves (b) of subcutaneous implantation models of GC are shown. c Total protein fractions were isolated from cells derived from 3 representative xenograft samples from each group, and the LC3 proteins were detected by Western blot analysis. Data shown are means ± S.D. (n = 3; **, p < 0.01, two-tailed t-test). d A summary diagram presenting the interaction between MALAT1, miR-23b-3p, ATG12 and their effect on autophagy-associatated chemoresistance

Similar articles

Cited by

References

    1. Siegel RL, Miller KD, Jemal A. Cancer statistics, 2015. CA Cancer J Clin. 2015;65:5–29. doi: 10.3322/caac.21254. - DOI - PubMed
    1. Chen W, Zheng R, Baade PD, Zhang S, Zeng H, Bray F, et al. Cancer statistics in China, 2015. CA Cancer J Clin. 2016;66:115–132. doi: 10.3322/caac.21338. - DOI - PubMed
    1. Karimi P, Islami F, Anandasabapathy S, Freedman ND, Kamangar F. Gastric cancer: descriptive epidemiology, risk factors, screening, and prevention. Cancer Epidemiol Biomarkers Prev. 2014;23:700–713. doi: 10.1158/1055-9965.EPI-13-1057. - DOI - PMC - PubMed
    1. Dassen AE, Dikken JL, van de Velde CJ, Wouters MW, Bosscha K, Lemmens VE. Changes in treatment patterns and their influence on long-term survival in patients with stages I-III gastric cancer in The Netherlands. Int J Cancer. 2013;133:1859–1866. doi: 10.1002/ijc.28192. - DOI - PubMed
    1. Rebucci M, Michiels C. Molecular aspects of cancer cell resistance to chemotherapy. Biochem Pharmacol. 2013;85:1219–1226. doi: 10.1016/j.bcp.2013.02.017. - DOI - PubMed