. 2017 Dec 12;37(6):BSR20170926.
doi: 10.1042/BSR20170926. Print 2017 Dec 22.

PU.1-deficient mice are resistant to thioacetamide-induced hepatic fibrosis: PU.1 finely regulates Sirt1 expression via transcriptional promotion of miR-34a and miR-29c in hepatic stellate cells

Affiliations

PU.1-deficient mice are resistant to thioacetamide-induced hepatic fibrosis: PU.1 finely regulates Sirt1 expression via transcriptional promotion of miR-34a and miR-29c in hepatic stellate cells

Qing Liu et al. Biosci Rep. .

Abstract

PU box binding protein (PU.1) is a critical transcription factor involved in many pathological processes. However, its exact role in activation of hepatic stellate cells (HSCs) and liver fibrosis was rarely reported. Here, we found that, in HSCs of PU.1+/- mice, Sirt1 mRNA expression was not changed but Sirt1 protein was significantly increased, suggesting its promoting role in Sirt1 translation. We then isolated HSCs from wild-type (WT) and PU.1+/- mice, and the pcDNA-PU.1 expression vector was transfected into PU.1+/- HSCs. We checked the levels of miR-34a and miR-29c, two Sirt1-targetting miRNAs, and protein levels of PU.1 and Sirt1. The results showed that miR-34a/-29c were significantly reduced and Sirt1 protein was increased in PU.1+/- HSCs, compared with WT HSCs. Besides, PU.1 overexpression inversed the reduction in miR-34a/-29c levels and the increase in Sirt1 protein in both PU.1+/- HSCs and WT HSCs. Additionally, ChIP-quantitive real-time PCR (qPCR) assay comfirmed that PU.1 was directly bound to both the promoter regions of miR-34a and miR-29c Importantly, PU.1 overexpression promoted the proliferation, migration, activation, oxidative stress and inflammatory response in WT HSCs, while the promotion could be inversed by either overexpression of Sirt1 or inhibition of miR-34a/-29c Moreover, animal model of liver fibrosis was established by intraperitoneal injections of thioacetamide (TAA) in WT and PU.1+/- mice, respectively. Compared with the WT mice, PU.1+/- mice displayed a lower fibrotic score, less collagen content, better liver function, and lower levels of oxidative stress and inflammatory response. In conclusion, PU.1 suppresses Sirt1 translation via transcriptional promotion of miR-34a/-29c, thus promoting Sirt1-mediated HSC activation and TAA-induced hepatic fibrosis.

Keywords: PU.1; hepatic fibrosis; hepatic stellate cell activation; miR-34a/-29c; sirtuins.


Conflict of interest statement

The authors declare that there are no competing interests associated with the manuscript.

Figures

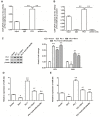
Figure 1
Figure 1. Sirt1 protein was up-regulated but Sirt1 mRNA was not changed in the HSC of PU.1+/− mice
(A) PU.1 mRNA was down-regulated in HSCs of PU.1+/− mice compared with WT mice. (B) Sirt1 mRNA levels in HSCs displayed no difference between PU.1+/− mice and WT mice. (C) PU.1 protein was down-regulated and Sirt1 protein was up-regulated in HSCs of PU.1+/− mice compared with WT mice. Primary HSCs were isolated from WT and PU.1 single allele deficient (PU.1+/−) newborn male C57BL/6J mice and cultured in vitro. Total RNA and protein were respectively extracted from the HSCs. The levels of PU.1 mRNA and Sirt1 mRNA were detected with qPCR. The levels of PU.1 mRNA and Sirt1 mRNA were detected with Western blotting. n=15, *P<0.05, **P<0.01.
Figure 2
Figure 2. PU.1 overexpression increased miR-34a and miR-29c levels and suppressed expression of Sirt1 protein
(A) PU.1 promoted expression of miR-34a and miR-29c in PU.1+/− HSCs. (B) PU.1 overexpression suppressed expression of Sirt1 protein in PU.1+/− HSCs. Primary HSCs were isolated from newborn WT and PU.1+/− mice and cultured in vitro. The pcDNA-PU.1 expression vector (2 μg) was transfected into PU.1+/− HSCs. After transfection for 48 h, qPCR analysis was used to detect the RNA levels of PU.1, Sirt1, miR-34a and miR-29c in WT HSCs, PU.1+/− HSCs and PU.1+/− HSCs transfected the pcDNA-PU.1. Western blotting was used to detect the protein levels of PU.1 and Sirt1. n=8, *P<0.05, **P<0.01 compared with WT. (C) Overexpression of miR-34a and miR-29c both had no effect on Sirt1 mRNA, but overexpression of Sirt1 suppressed expression of miR-34a and miR-29c. (D) Overexpression of miR-34a and miR-29c both sharply reduced expression of Sirt1 protein, but had no effect on PU.1 protein. The pcDNA-PU.1 expression vector (2 μg), pcDNA-Sirt1 expression vector (2 μg), miR-34a mimic (60 pmol), and miR-29c mimic (60 pmol) were respectively transfected into PU.1+/− HSCs. After transfection for 48 h, the RNA levels of PU.1, Sirt1, miR-34a, and miR-29c were detected with qPCR. The levels of PU.1 and Sirt1 proteins were detected with Western blotting. n=8, *P<0.05, **P<0.01 compared with Vector.
Figure 3
Figure 3. PU.1 negatively regulated Sirt1 protein expression via trancriptional promotion of miR-34a and miR-29c in PU.1+/− HSCs
(A) PU.1 displayed high binding capacity to the miR-34a promoter. (B) PU.1 displayed high binding capacity to the miR-29c promoter. Primary HSCs were isolated from newborn WT mice and cultured in vitro. PU.1 antibody was applied in the ChIP assay for the binding capacity of PU.1 to miR-34a or miR-29c in the HSCs. qPCR was used to detected the abundance in the protein–DNA complex bound by PU.1 antibody. Total DNA input was regarded as the positive control. IgG was regarded as the negative control in the ChIP assay. Adding primers only was regarded as the negative control in the qPCR assay. n=4, **P<0.01. (C) Inhibition of miR-34a and miR-29c could reverse the down-regulation of Sirt1 protein caused by PU.1 overexpression. (D,E) Transfection with antagomirs of miR-34a/-29c antagonized the promoting effect of PU.1 on expression of miR-34a and miR-29c. Primary HSCs were isolated from newborn WT mice and cultured in vitro. On reaching 70% confluence, the pcDNA-Sirt1 expression vector, pcDNA-PU.1 expression vector and inhibitors of miR-34a/miR-29c were individually transfected or co-transfected into WT HSCs. After transfection for 48 h, levels of PU.1 and Sirt1 proteins were detected with Western blotting. The relative expression of miR-34a and miR-29c were detected with qPCR. n=8, *P<0.05, **P<0.01 compared with Vector, #P<0.05 compared with PU.1. n.s. = no significant
Figure 4
Figure 4. PU.1 overexpression promoted the proliferation, migration, and activation of HSCs
(A) PU.1 overexpression promoted the proliferation of HSCs. (B) PU.1 overexpression promoted the migration of HSCs. (C) PU.1 overexpression promoted the expression of activated marker proteins of HSCs. Primary HSCs were isolated from newborn WT mice and cultured in vitro. On reaching 70% confluence, the pcDNA-PU.1 expression vector, pcDNA-Sirt1 expression vector, pcDNA-PU.1 plus pcDNA-Sirt1, or pcDNA-PU.1 plus inhibitors of miR-34a/-29c were respectively transfected into WT HSCs. After transfection for 48 h, cell proliferation was detected with CCK-8 assay, cell migration was detected with Transwell migration assay, and the levels of ColI and α-SMA proteins were detected with Western blotting. n=8, *P<0.05 compared with Vector, #P<0.05 compared with PU.1.
Figure 5
Figure 5. PU.1 overexpression increased ROS content and inflammatory gene expression in HSCs
(A) PU.1 overexpression increased ROS content in HSCs, which could be antagonized by either Sirt1 overexpression or inhibition of miR-34a/-29c. (B) PU.1 overexpression promoted the expression of inflammatory genes IL-1β and TGF-β1, which could be antagonized by either Sirt1 overexpression or inhibition of miR-34a/-29c. Primary HSCs were isolated from newborn WT mice and cultured in vitro. On reaching 70% confluence, the pcDNA-PU.1 expression vector, pcDNA-Sirt1 expression vector, pcDNA-PU.1 plus pcDNA-Sirt1, or pcDNA-PU.1 plus inhibitors of miR-34a/-29c were respectively transfected into WT HSCs. After transfection for 48 h, ROS content in the cells was detected with Total ROS Detection Kit. Total RNA was extracted, and the mRNA levels of IL-1β and TGF-β1 were detected with qPCR. n=8, *P<0.05 compared with Vector, #P<0.05 compared with PU.1.
Figure 6
Figure 6. PU.1+/− mice displayed resistance to TAA-induced liver fibrosis
(A) PU.1+/− mice displayed an obviously lower degree of liver fibrosis in response to TAA treatment compared with WT mice. (B) PU.1+/− mice had significantly lower hepatic fibrosis scores in response to TAA treatment. (C) PU.1+/− mice had significantly lower total hepatic collagen content in response to TAA treatment. (D) PU.1+/− mice displayed significantly lower levels of hepatic ColI mRNA in response to TAA treatment. Animal model of liver fibrosis was established by intraperitoneal injection of 10 mg/ml TAA (5 μl every other day) in WT and PU.1+/− mice, respectively. On the first day (week 0) and the weekends of weeks 6, 10, and 16, liver tissues were isolated. Masson’s trichrome staining was used to detected the tissue firbosis, fibrosis score of the liver was evaluated by the semiquantitative fibrosis scores, total collagen content in liver tissue was detected with the hydroxyproline quantitation method, and ColIA1 mRNA expression in liver tissue was detected with qPCR. n=8. *P<0.05, **P<0.01 compared with WT.
Figure 7
Figure 7. PU.1+/− mice displayed lower levels of inflammatory response and oxidative stress on treatment of TAA
(A,B) PU.1+/− mice displayed lower expression levels of IL-1β mRNA and IL-1β mRNA in response to TAA treatment compared with WT mice. (C) PU.1+/− mice displayed lower hepatic ROS content in response to TAA treatment. (D) PU.1+/− mice displayed lower hepatic MDA content in response to TAA treatment. Animal model of liver fibrosis was established by intraperitoneal injection of 10 mg/ml TAA (5 μl every other day) in WT and PU.1+/− mice, respectively. On the first day (week 0) and the weekends of weeks 6, 10, and 16, liver tissues were isolated. IL-1β mRNA and IL-1β mRNA levels in liver tissue were detected with qPCR. ROS content and MDA in liver tissue were detected. n=8. *P<0.05, **P<0.01 compared with WT.

References

    1. Bataller R. and Brenner D.A. (2001) Hepatic stellate cells as a target for the treatment of liver fibrosis. Semin. Liver Dis. 21, 437–451 - PubMed
    1. Zhao W., Zhang L., Yin Y. et al. (2011) Activated hepatic stellate cells promote hepatocellular carcinoma development in immunocompetent mice. Int. J. Cancer 129, 2651–2661 - PubMed
    1. Bordone L. and Guarente L. (2005) Calorie restriction, SIRT1 and metabolism: understanding longevity. Nat. Rev. Mol. Cell Biol. 6, 298–305 - PubMed
    1. Milner A.J. (2011) Induction of apoptosis by inhibition of sirtuin SIRT1 expression, 7863436. U.S. Pat.
    1. Prozorovski T., Schulze-Topphoff U., Glumm R. et al. (2008) Sirt1 contributes critically to the redox-dependent fate of neural progenitors. Nat. Cell Biol. 10, 385–394 - PubMed