. 2017 Dec 5;114(49):E10568-E10577.
doi: 10.1073/pnas.1708383114. Epub 2017 Nov 21.

Atypical activation of dendritic cells by Plasmodium falciparum

Affiliations

Atypical activation of dendritic cells by Plasmodium falciparum

Anton Götz et al. Proc Natl Acad Sci U S A. .

Abstract

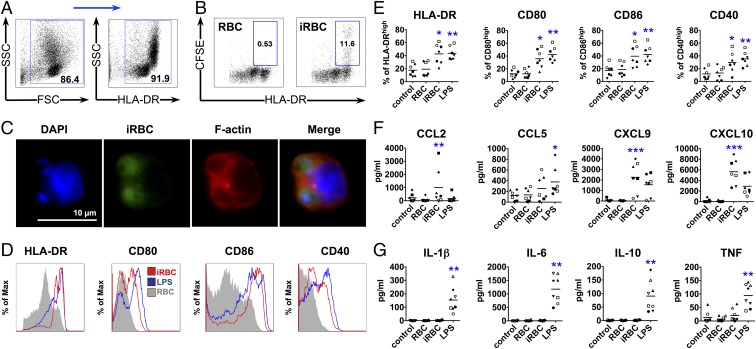
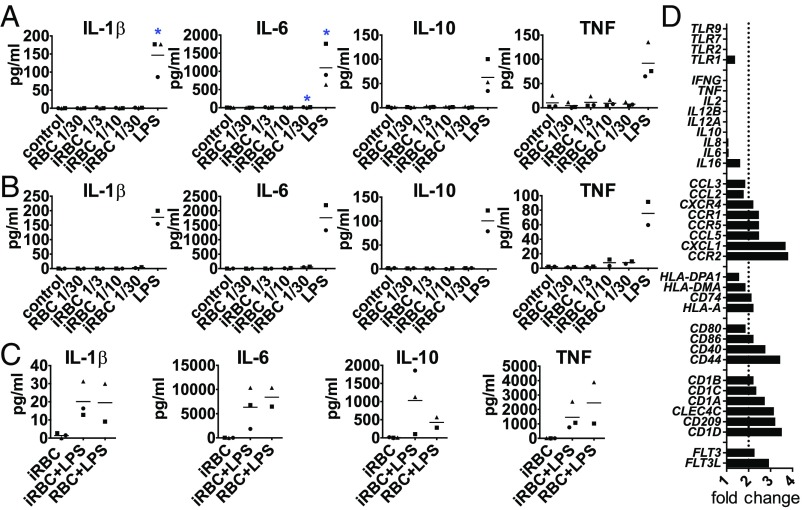
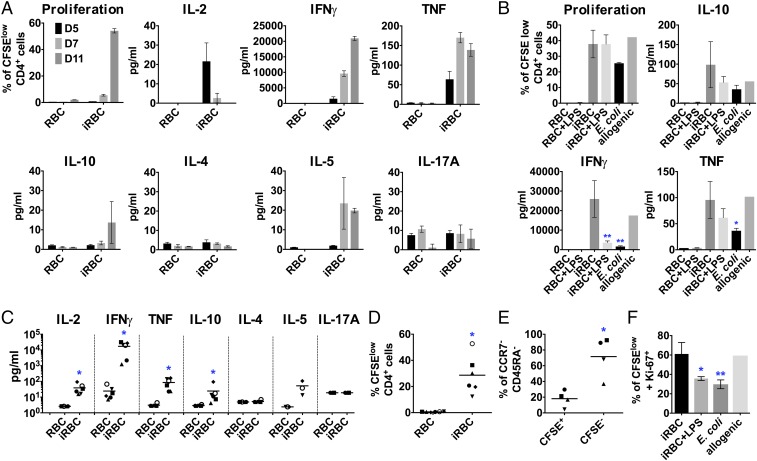
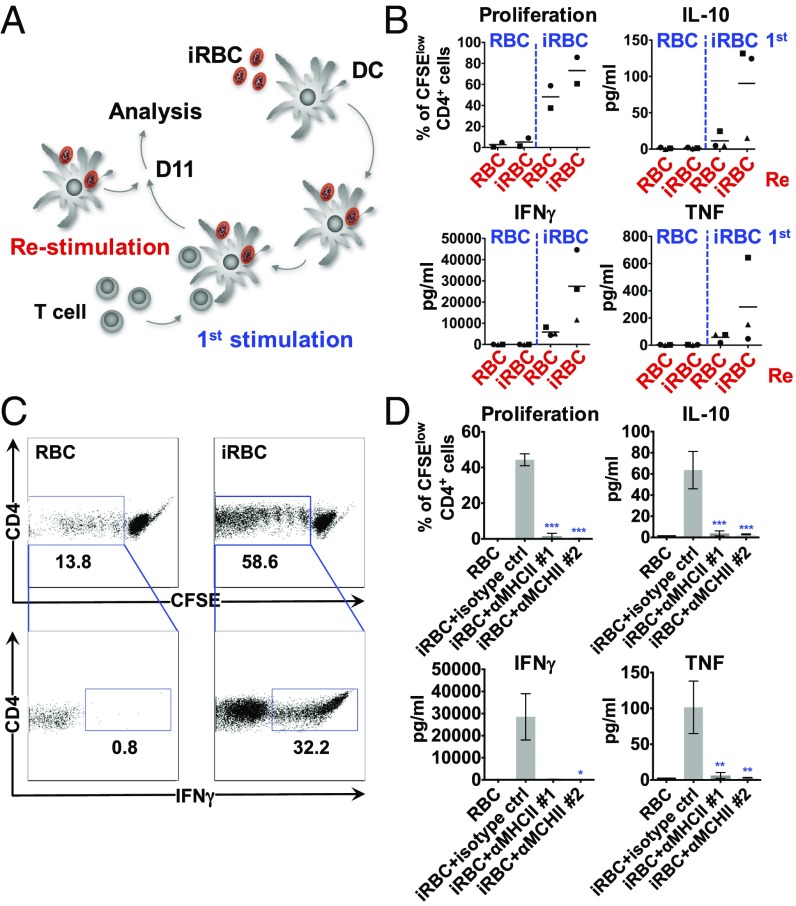
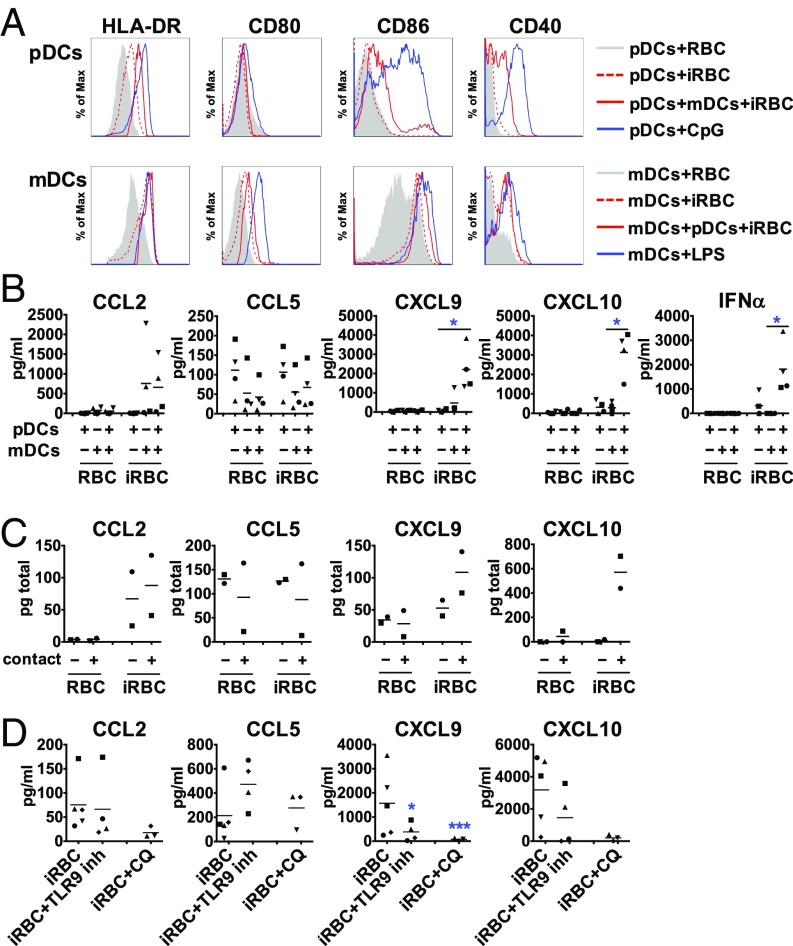
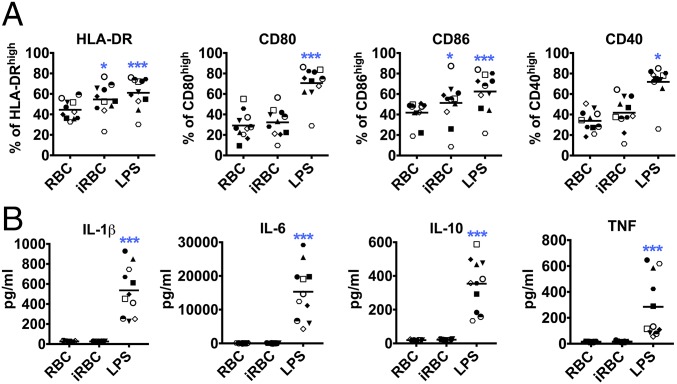
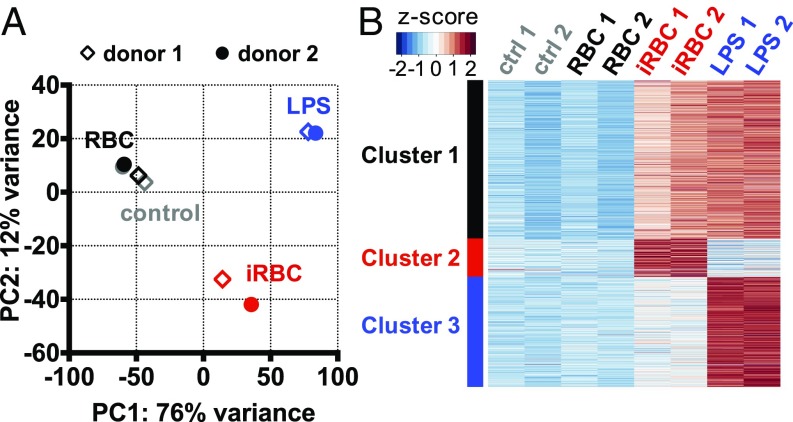
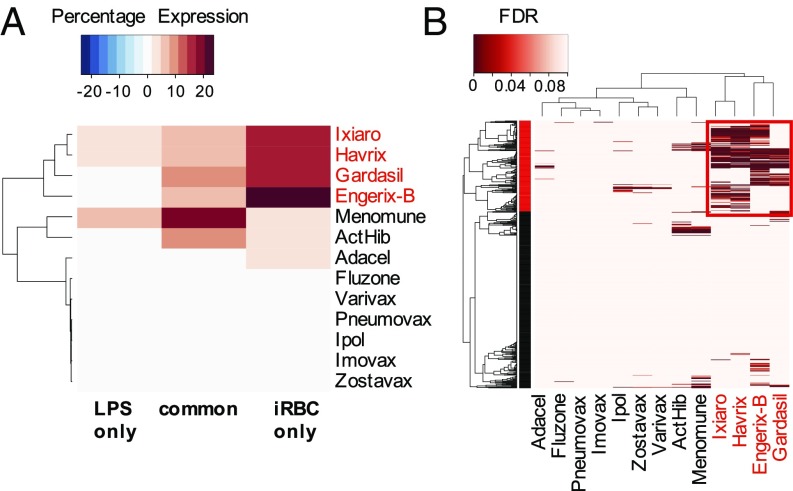
Dendritic cells (DCs) are activated by pathogens to initiate and shape immune responses. We found that the activation of DCs by Plasmodium falciparum, the main causative agent of human malaria, induces a highly unusual phenotype by which DCs up-regulate costimulatory molecules and secretion of chemokines, but not of cytokines typical of inflammatory responses (IL-1β, IL-6, IL-10, TNF). Similar results were obtained with DCs obtained from malaria-naïve US donors and malaria-experienced donors from Mali. Contact-dependent cross-talk between the main DC subsets, plasmacytoid and myeloid DCs (mDCs) was necessary for increased chemokine and IFN-α secretion in response to the parasite. Despite the absence of inflammatory cytokine secretion, mDCs incubated with P. falciparum-infected erythrocytes activated antigen-specific naïve CD4+ T cells to proliferate and secrete Th1-like cytokines. This unexpected response of human mDCs to P. falciparum exhibited a transcriptional program distinct from a classical LPS response, pointing to unique P. falciparum-induced activation pathways that may explain the uncharacteristic immune response to malaria.

Keywords: Plasmodium falciparum; activation; cytokines; dendritic cells; malaria.


Conflict of interest statement

The authors declare no conflict of interest.

Figures

Fig. 1.
Fig. 1.
DCs phagocytose P. falciparum-iRBCs and up-regulate maturation markers and secretion of chemokines, but not cytokines. DCs were incubated with late-stage P. falciparum-iRBCs or uninfected RBCs at a ratio of 1:3 [DC:(i)RBC] for 24 h (A and D–G) or 1:3 [DC:carboxy-fluorescein succinimidyl ester (CFSE)-labeled (i)RBC] for 3 h (B and C) and analyzed for surface marker expression (A, D, and E), chemokine (F) and cytokine (G) secretion, or phagocytosis by FACS (B) and immunofluorescence microscopy (C). (A) DCs enriched by negative selection followed by positive selection for HLA-DR with magnetic beads from PBMCs were gated first by using forward scatter (FSC) and SSC, followed by selection of HLA-DR+ cells, and used for further analysis in B and D–G. (B and C) Phagocytosis of iRBCs is observed as CFSE-positive DCs. Data from one representative experiment of three are shown. An example of surface marker expression for one donor (D) and the analysis of seven (E and F) and eight (G) donors are shown (E–G), with each symbol representing results from one individual donor and experiment (*P < 0.05, **P < 0.01, and ***P < 0.001 by Friedman test vs. RBCs or control; line depicts grand mean).
Fig. 2.
Fig. 2.
DCs fail to secrete and up-regulate cytokine gene expression upon activation by P. falciparum but are not blocked in their ability to secrete cytokines. (AC) DCs were incubated alone (control), with P. falciparum-iRBCs without (A) or with knobs (B) at a ratio of 1:3, 1:10, or 1:30 (DC:iRBC), or with uninfected RBCs at a 1:30 ratio (DC:RBC) for 24 h and analyzed for cytokine secretion. (C) DCs were incubated with iRBCs or RBCs at a ratio of 1:3 for 24 h when LPS was added for an additional 24-h incubation. Each symbol represents one individual donor and experiment; line depicts grand mean (*P < 0.05 by Friedman test vs. control). (D) For gene expression analysis, DCs were enriched, positive-selected for HLA-DR, and incubated with iRBCs or RBCs at a ratio of 1:3 for 3 h. Total RNA was extracted and converted to cDNA, and gene expression was analyzed. Results from one donor are expressed as RNA expression fold change of DCs plus iRBCs over DCs plus RBCs.
Fig. 3.
Fig. 3.
P. falciparum-activated DCs prime autologous CD4+ T cells to become Th1-like effector cells in vitro. DCs were incubated with P. falciparum-iRBCs or uninfected RBCs at a ratio of 1:3 [DC:(i)RBC] for 3 h, harvested, and coincubated with autologous naïve CD4+ T cells at a ratio of 1:30 (DC:T cell). T cell proliferation was quantified by CFSE dilution, and cytokines were analyzed in the supernatants. (A) As a representative example, proliferation and cytokine levels are shown for days 5, 7, and 11 for one individual donor. Mean with SD is shown for duplicates and triplicates. (B) DCs were additionally incubated with uninfected RBCs plus LPS, infected RBCs plus LPS, and heat-killed E. coli at a ratio of 1:10 (DC:E. coli) or allogenic DCs. Cytokine levels (levels below detection limit were set to the detection limit; C) and proliferation (D) of different donors and experiments are shown at day 11 (except for IL-2, shown at day 5). (E) Naïve T cell marker expression (CCR7 and CD45RA) was analyzed in T cells primed by P. falciparum-activated DCs at day 11. (F) DCs were incubated with infected RBCs, infected RBCs plus LPS, and heat-killed E. coli at a ratio of 1:10 (DC:E. coli) or allogenic DCs, and CFSElow T cells were stained for the proliferation marker Ki-67 at day 11. Each symbol represents one individual experiment from at least four different donors; line depicts grand mean (CE). *P < 0.05 by Wilcoxon test (C and D); *P < 0.05 by Student’s t test (E). Results from one donor and experiment are shown at day 11 in triplicates (except for allogenic; *P < 0.05 and **P < 0.01 by one-way ANOVA vs. iRBCs in B and F).
Fig. 4.
Fig. 4.
CD4+ T cells primed by P. falciparum are antigen-specific. DCs were incubated with P. falciparum-iRBCs or uninfected RBCs at a ratio of 1:3 [DC:(i)RBC] for 3 h, harvested, and coincubated with autologous naïve CD4+ T cells at a ratio of 1:30 (DC:T cell). Approximately 11 d after the first stimulation, the primed T cells were stained with CFSE and restimulated with autologous DCs incubated with iRBCs or uninfected RBCs as depicted in A. T cell proliferation was quantified after 2–3 d, and cytokines were analyzed in the supernatants after 24 h (B). Each symbol represents one individual donor and experiment; the line depicts the grand mean. Intracellular cytokine staining is shown for IFN-γ after 24 h of restimulation. One representative experiment of two is shown (C). Inhibitory anti-MHCII antibodies (1, anti–HLA-DR/DP/DQ, clone Tü39; 2, anti-HLA-DR, clone L243, 25 µg/mL) were added to the coculture every second day, and proliferation and cytokines were analyzed at day 11. One representative experiment of two is shown. Mean with SD is shown for triplicates (*P < 0.05, **P < 0.01, and ***P < 0.001 by Kruskal–Wallis test for IFN-γ and by one-way ANOVA for all others vs. iRBCs plus isotype control; D).
Fig. 5.
Fig. 5.
Contact-mediated cross-talk between pDCs and mDCs is essential for P. falciparum-induced secretion of IFN-α and chemokines. Freshly purified pDCs and mDCs were incubated separately or together with P. falciparum-iRBCs or uninfected RBCs at a ratio of 1:3 [DC:(i)RBC] for 24 h and analyzed for surface marker expression (A), IFN-α (B), and chemokine (C and D) secretion. For contact-independent coculture, each subtype was seeded with iRBCs or uninfected RBCs in the upper or lower compartment of a Transwell system, and supernatants were analyzed for chemokines. Contact-independent (−) and cocultures in contact (+) (C). A TLR9 antagonist and chloroquine were used to inhibit TLR9 or intracellular TLR signaling, respectively (D). Each symbol represents results from one individual donor and experiment. Line depicts grand mean [*P < 0.05 by Friedman test vs. RBC or control (B) or *P < 0.05 and ***P < 0.001 by Student’s t test vs. iRBCs (D)].
Fig. 6.
Fig. 6.
mDCs are sufficient for CD4+ T cell activation and Th1-like polarization. (A) pDCs and mDCs were purified by positive selection using magnetic beads and incubated separately or together (both) with P. falciparum-iRBCs or uninfected RBCs at a ratio of 1:3 [DC:(i)RBC] for 3 h, harvested, and coincubated with autologous naïve CD4+ T cells at a ratio of 1:30 (DC:T cell) for 7 d. T cell proliferation was quantified by CFSE dilution, and cytokines were analyzed in the supernatants. (B) Purified mDCs were incubated with iRBCs at a ratio of 1:3 [DC:(i)RBC] or LPS for 24 h, washed, and analyzed with light microscopy. (Scale bar,10 µm.) (C) Purified mDCs were incubated with P. falciparum-iRBCs or uninfected RBCs at a ratio of 1:3 [DC:(i)RBC] for 3 h, harvested, and coincubated with autologous naïve CD4+ T cells at a ratio of 1:30 (DC:T cell) with isotype control or blocking antibodies for CD40L or IL-12p70 for 7 d. SD of triplicates from one experiment is shown (*P < 0.05 by Kruskal–Wallis test vs. iRBCs plus isotype control). One representative experiment of two is shown.
Fig. 7.
Fig. 7.
mDCs from individuals living in an endemic area up-regulate markers but fail to secrete cytokines upon stimulation with P. falciparum. mDCs were enriched from PBMCs from Malian adults and incubated with P. falciparum-iRBCs or uninfected RBC lysates at a ratio of 1:3 [DC:(i)RBC] for 24 h and analyzed for surface marker expression (A) and cytokine secretion (B). Each symbol represents one individual donor and experiment. Line depicts grand mean (*P < 0.05, **P < 0.01, and ***P < 0.001 by Friedman test vs. uninfected RBC control; n = 11).
Fig. 8.
Fig. 8.
CD1c+ mDCs show distinct gene expression upon stimulation with P. falciparum-iRBCs. CD1c+ mDCs were purified by positive selection using magnetic beads and incubated with P. falciparum-iRBCs or uninfected RBCs at a ratio of 1:3 [DC:(i)RBC] for 6 h before RNA extraction and whole-genome RNA-seq of two individual donors and experiments. (A) Principal component analysis of all 25,087 genes showed that DCs stimulated with LPS or iRBCs have different gene expression profiles. Scatter diagram of the first two principal components is shown. (B) K-means clustering partitioning the union set of 4,626 up-regulated genes from LPS or iRBCs stimulations into three distinct sets of genes. Cluster 1, genes commonly up-regulated by LPS and iRBCs; cluster 2, genes predominantly up-regulated by iRBCs; cluster 3, genes predominantly up-regulated by LPS.
Fig. 9.
Fig. 9.
The P. falciparum-iRBC–specific genes are most highly expressed in CD1c+ DCs activated with the vaccines Ixiaro, Gardasil, Havrix, and Engerix-B. (A) The iRBC-specific gene cluster is most highly induced with the vaccines Ixiaro, Gardasil, Havrix, and Engerix-B (names in red). Values shown here are percentage expression, where a positive value indicates up-regulation and a negative value indicates down-regulation. (B) The high expression of the iRBC-specific gene cluster in the four vaccines is contributed by 158 genes (boxed in red). Values shown here represent statistical significance, as determined by the calculation of false discovery rate (FDR). Darker shades of red represent a low FDR value and therefore statistical significance compared with expression levels under control medium.

References

    1. World Health Organization (2016) World Malaria Report 2016 (World Health Organization, Geneva)
    1. Storm J, Craig AG. Pathogenesis of cerebral malaria–Inflammation and cytoadherence. Front Cell Infect Microbiol. 2014;4:100. - PMC - PubMed
    1. Stanisic DI, Barry AE, Good MF. Escaping the immune system: How the malaria parasite makes vaccine development a challenge. Trends Parasitol. 2013;29:612–622. - PubMed
    1. Banchereau J, Steinman RM. Dendritic cells and the control of immunity. Nature. 1998;392:245–252. - PubMed
    1. Banchereau J, et al. Immunobiology of dendritic cells. Annu Rev Immunol. 2000;18:767–811. - PubMed

Publication types

MeSH terms