. 2017 Nov 21;7(1):15926.
doi: 10.1038/s41598-017-16166-y.

Information processing in the NF-κB pathway

Affiliations

Information processing in the NF-κB pathway

Karolina Tudelska et al. Sci Rep. .

Abstract

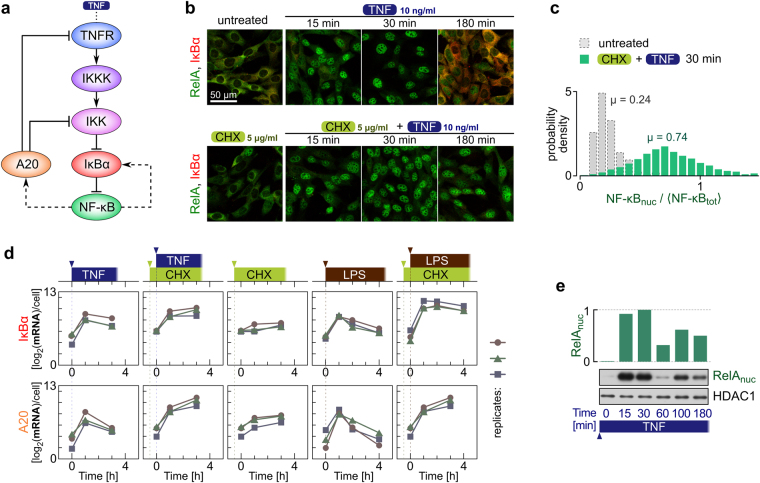
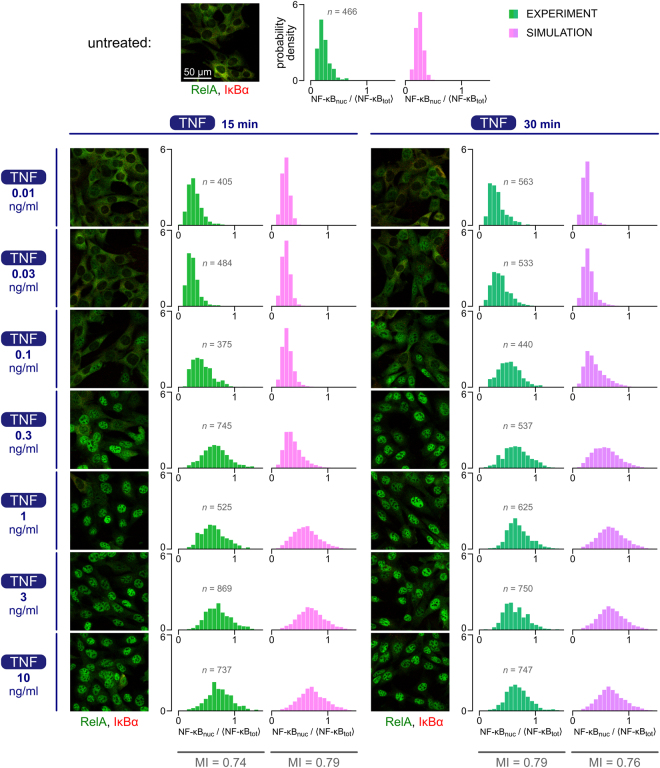
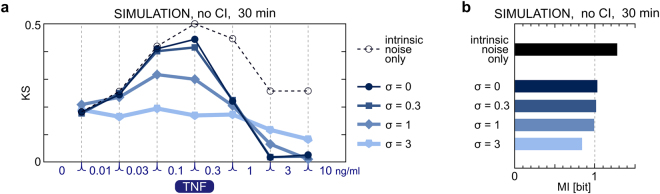
The NF-κB pathway is known to transmit merely 1 bit of information about stimulus level. We combined experimentation with mathematical modeling to elucidate how information about TNF concentration is turned into a binary decision. Using Kolmogorov-Smirnov distance, we quantified the cell's ability to discern 8 TNF concentrations at each step of the NF-κB pathway, to find that input discernibility decreases as signal propagates along the pathway. Discernibility of low TNF concentrations is restricted by noise at the TNF receptor level, whereas discernibility of high TNF concentrations it is restricted by saturation/depletion of downstream signaling components. Consequently, signal discernibility is highest between 0.03 and 1 ng/ml TNF. Simultaneous exposure to TNF or LPS and a translation inhibitor, cycloheximide, leads to prolonged NF-κB activation and a marked increase of transcript levels of NF-κB inhibitors, IκBα and A20. The impact of cycloheximide becomes apparent after the first peak of nuclear NF-κB translocation, meaning that the NF-κB network not only relays 1 bit of information to coordinate the all-or-nothing expression of early genes, but also over a longer time course integrates information about other stimuli. The NF-κB system should be thus perceived as a feedback-controlled decision-making module rather than a simple information transmission channel.


Conflict of interest statement

The authors declare that they have no competing interests.

Figures

Figure 1
Figure 1
Experimental characterization of NF-κB response to TNF and LPS under conditions of normal or inhibited translation. MEFs were stimulated with 10 ng/ml TNF or 1 μg/ml LPS in the absence or presence of 5 μg/ml cycloheximide (CHX). In the CHX + TNF and CHX + LPS costimulation experiments, cells were incubated with 5 μg/ml CHX for 30 min prior to TNF or LPS stimulation. (a) Schematic diagram of the NF-κB pathway. A detailed diagram can be found in Korwek et al.. (b) Temporal coevolution of nuclear NF-κB and total IκBα. Following stimulation, cells were fixed and stained with antibodies for RelA (a subunit of NF-κB) and for IκBα. Representative excerpts from confocal images show cells at 0 (‘untreated’), 15, 30 and 180 min after TNF stimulation. See Supplementary Data S1 for corresponding uncropped immunostaining images. (c) Histograms (n = 466 for untreated cells and n = 1434 for CHX + TNF costimulated cells) show NF-κB nuclear translocation, defined as nuclear fluorescence normalized to the average whole-cell fluorescence, based on confocal images (see Methods for details). The CHX + TNF histogram is derived from confocal images for the 30-min time point of the CHX + TNF costimulation experiment, which corresponds to the observed peak of NF-κB nuclear translocation. µ denotes the mean values of the distributions. (d) Gene expression profiles of NF-κB inhibitors, IκBα and A20. Time profiles of relative mRNA levels of IκBα and A20 were obtained using digital PCR measurements. (e) Western blot of nuclear RelA (a subunit of NF-κB) in response to TNF and its densitometric quantification with HDAC1 as reference. Average ratio of NF-κBnuc(t = 0)/NF-κBnuc(t = 30 min) calculated based on 3 such independent experiments is 0.03, which allows to estimate the nuclear NF-κB fraction at t = 0, NF-κBnuc(t = 0)/NF-κBtotal, to be below 0.03. See Supplementary Data S2 for full-length Western blots.
Figure 2
Figure 2
Concept of dose discernibility. (a) Correspondence between the Kolmogorov–Smirnov distance (KS) and the miss and false alarm probabilities. Absolute difference between cumulative distribution functions |F 1(x) − F 2(x)| reaches its supremum, called KS distance, in point x for which probability densities of distributions P 1 and P 2 are equal, P 1(x) = P 2(x). When the prior probabilities corresponding to these distributions are equal, then point x is the optimal decision threshold, defining miss and false alarm probabilities, p m, p f. (b) Sum of KS distances between Gaussian distributions in between two Gaussians with Δµ0 = 2σ. (c) Comparison of MI and KS, see text for details.
Figure 3
Figure 3
Nuclear NF-κB response to eight TNF concentrations: experiment and model. MEFs were stimulated with 0, 0.01, 0.03, 0.1, 0.3, 1, 3 or 10 ng/ml TNF, fixed and stained with antibodies for RelA (a subunit of NF-κB) and IκBα. Representative regions from confocal images show cells at 15 min (left) and 30 min (right) of TNF stimulation. See Supplementary Data S3 for corresponding uncropped immunostaining images. Histograms show NF-κB nuclear translocation calculated based on confocal images (green) and on numerical simulations (pink) for each combination of TNF stimulation time and concentration (the number of cells, n, quantified in each experiment, is shown next to each histogram, the number of stochastic simulations for each TNF dose is 10,000). NF-κB nuclear translocation is defined as the nuclear fluorescence normalized to the average whole-cell fluorescence (see Methods for quantification details). Simulations take into account cytoplasmic interference (CI) in order to enable comparison with experimental results.
Figure 4
Figure 4
TNF dose discernibility and mutual information with respect to the extrinsic noise. (a) Plots show Kolmogorov–Smirnov (KS) distances between simulated distributions of nuclear NF-κB in 30-min time point of stimulation with consecutive TNF concentrations. The results are shown for standard deviation of TNFR, σ, equal 0, 0.3, 1 or 3. ‘Intrinsic noise only’ denotes simulations in which σ = 0, and additionally the same amount of total translocatable and nontraslocatable NF-κB is assumed for each cell. KS distances were calculated based on simulations without cytoplasmic interference (CI). CI reduces KS distances as shown in Supplementary Data S5. (b) The effect of extrinsic noise on mutual information at the NF-κB level in 30-min time point of TNF stimulation.
Figure 5
Figure 5
Information at each level of the NF-κB pathway. (a) Temporal profiles of key pathway components obtained in numerical simulations with σ = 0 for two TNF doses: 0.03 ng/ml and 3 ng/ml. In each subpanel, shown are normalized trajectories from 5 stochastic simulations (with the assumed translocatable pools of NF-κB equal {0.5, 0.7, 0.9, 1.3, 1.6} × 105 – probing the experimental distribution from Fig. 1c with the average of 105 molecules). Trajectories with larger pools of translocatable NF-κB are drawn with thicker lines. (b) Kolmogorov–Smirnov (KS) distances between simulated distributions of pathway components calculated for each pair of consecutive TNF concentrations. (c) Mutual information at each pathway level. The results shown in (b) and (c) are based on maximal levels of the pathway components over 0–30 min after TNF stimulation, for n = 10,000 simulations with σ = 0, without CI. IκBαdeg denotes the maximal value of IκBα(t = 0) − IκBα(t) for t [0,30 min]. The analogous results for σ = 0.3, σ = 1 and σ = 3 and in the case with the intrinsic noise only, are shown in Supplementary Data S7.
Figure 6
Figure 6
NF-κB system integrates information about inhibition of translation. MEFs were either stimulated with 1 μg/ml LPS for 30 or 120 min with or without 30-min pre-incubation with 5 μg/ml cycloheximide (CHX), or incubated with only CHX. Histograms (ad) show NF-κB nuclear translocation based on confocal images of cells subjected to each type of stimulation. Between 500 and 700 cells were analysed for each histogram. NF-κB nuclear translocation is defined as the nuclear fluorescence normalized to the average whole-cell fluorescence (see Methods for details). Each plot contains overlying histograms for two stimulation types specified on the right, at the time point given at the top. Kolmogorov–Smirnov (KS) distances between the two samples (associated with two stimulation types as specified) and mutual information (MI) are given in each plot. See Supplementary Data S8 for corresponding uncropped immunostaining images.

References

    1. Cheong R, Rhee A, Wang CJ, Nemenman I, Levchenko A. Information transduction capacity of noisy biochemical signaling networks. Science. 2011;334:354–358. doi: 10.1126/science.1204553. - DOI - PMC - PubMed
    1. Selimkhanov J, et al. Accurate information transmission through dynamic biochemical signaling networks. Science. 2014;346:1370–1373. doi: 10.1126/science.1254933. - DOI - PMC - PubMed
    1. Hat, B., Kochańczyk, M., Bogdał, M. N. & Lipniacki, T. Feedbacks, bifurcations, and cell fate decision-making in the p53 system. PLOS Comput. Biol. 12, e1004787 (2016). - PMC - PubMed
    1. Bogdał MN, Hat B, Kochańczyk M, Lipniacki T. Levels of pro-apoptotic regulator Bad and anti-apoptotic regulator Bcl-xL determine the type of the apoptotic logic gate. BMC Syst. Biol. 2013;7:67. doi: 10.1186/1752-0509-7-67. - DOI - PMC - PubMed
    1. Shannon CE. A mathematical theory of communication. Bell Syst. Tech. J. 1948;27:379–423. doi: 10.1002/j.1538-7305.1948.tb01338.x. - DOI