. 2017 Nov 21;7(1):15908.
doi: 10.1038/s41598-017-16120-y.

Protocadherin-αC2 is required for diffuse projections of serotonergic axons

Affiliations

Protocadherin-αC2 is required for diffuse projections of serotonergic axons

Shota Katori et al. Sci Rep. .

Abstract

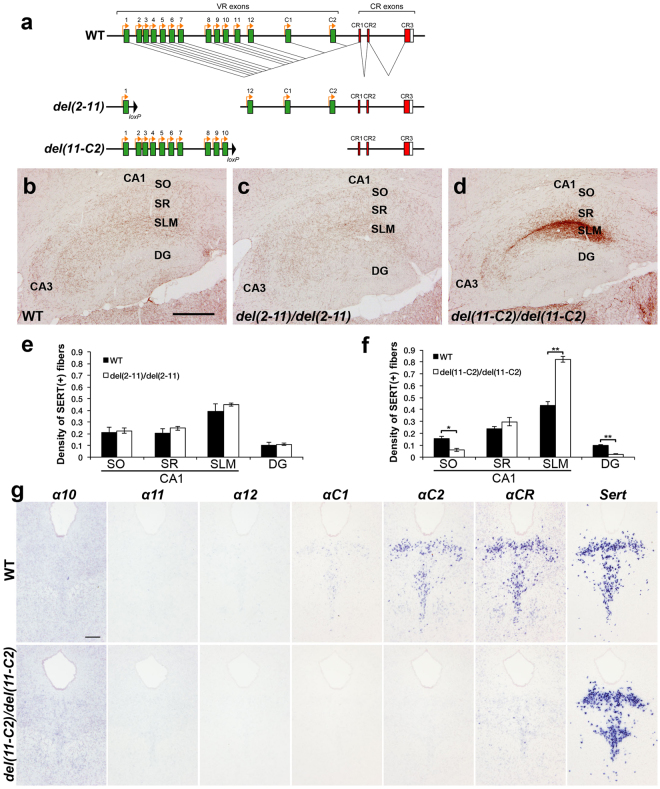
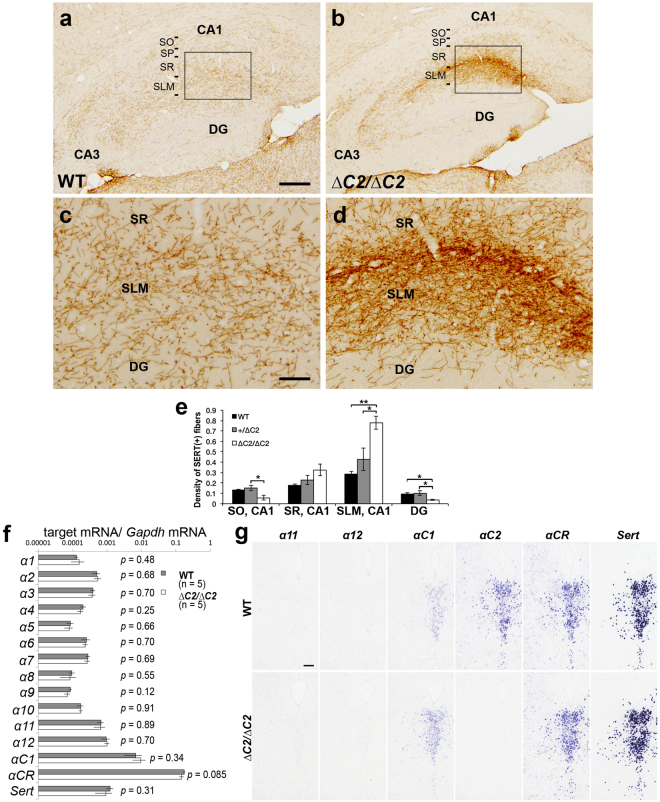
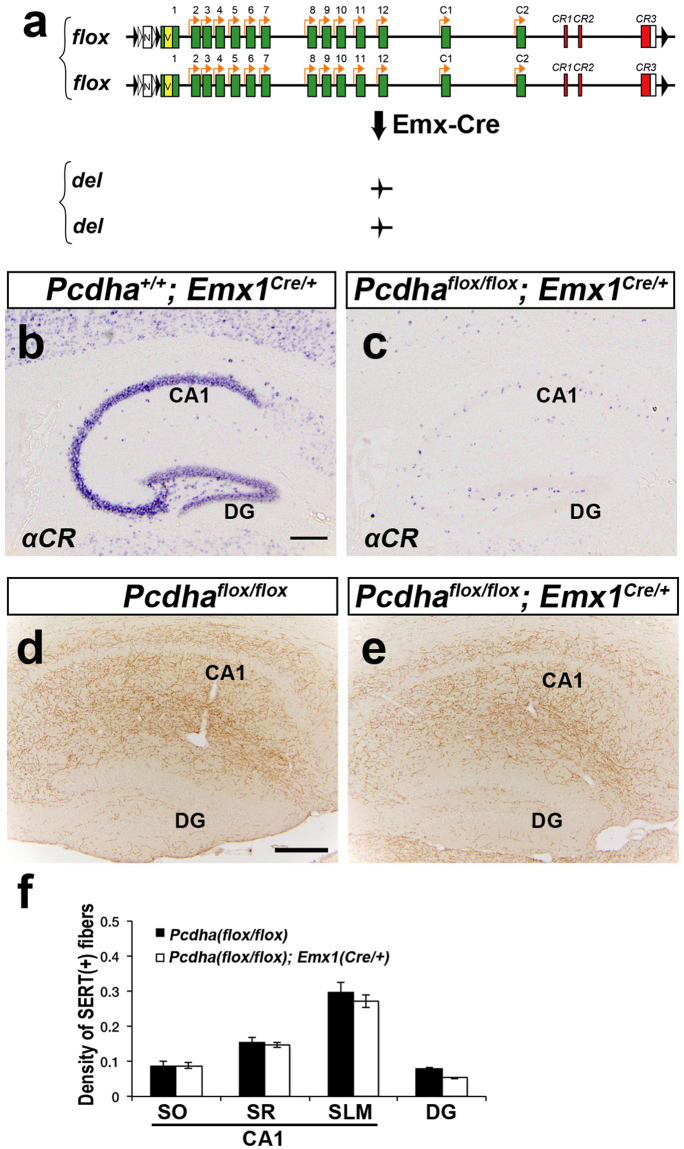
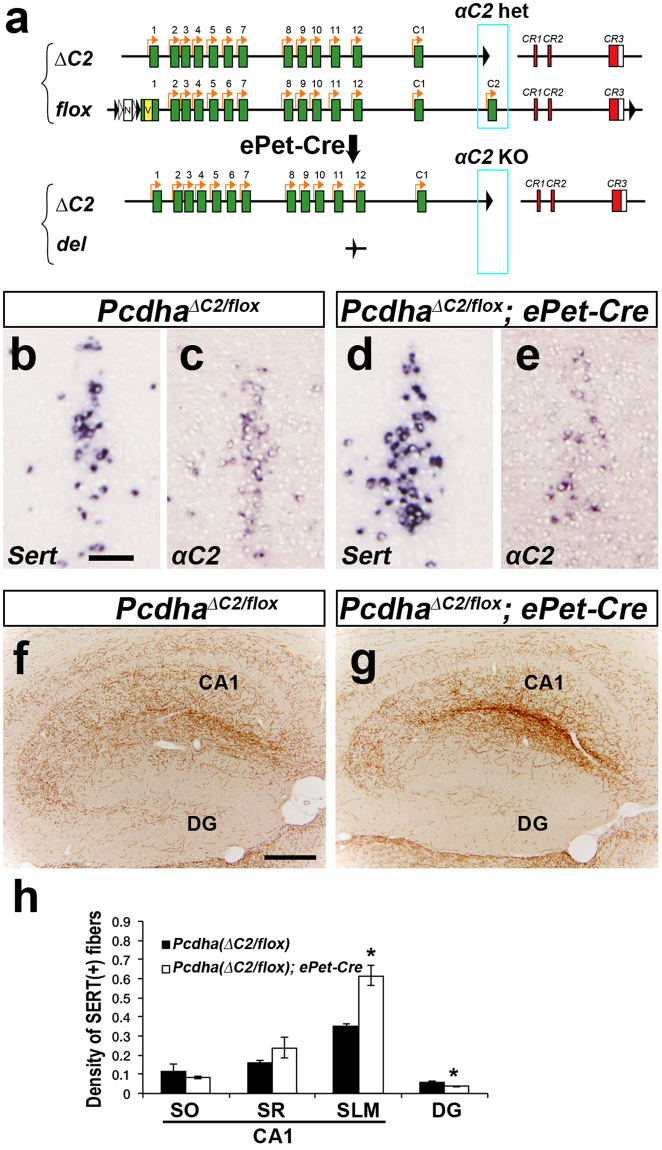
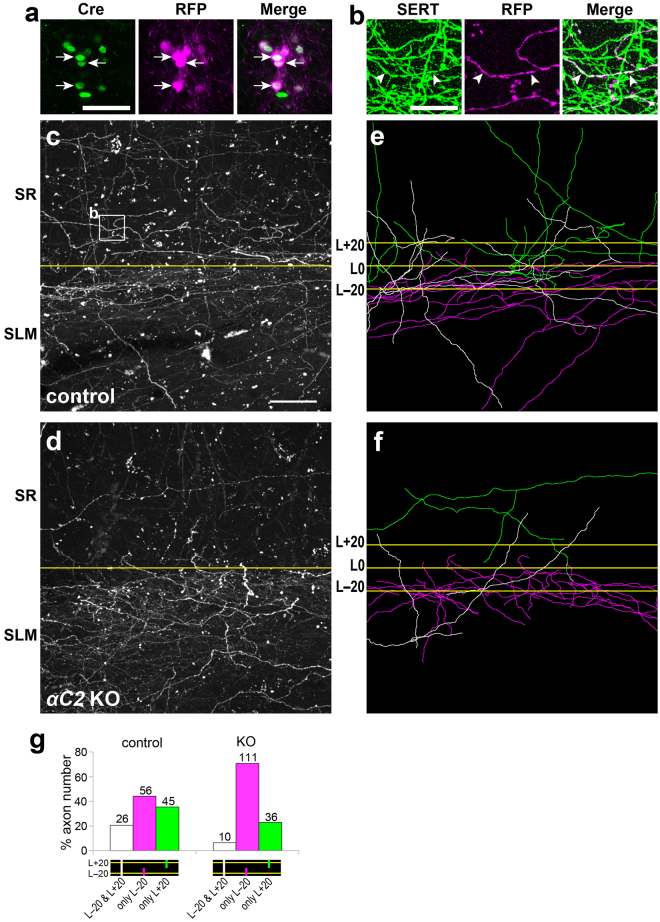
Serotonergic axons extend diffuse projections throughout various brain areas, and serotonergic system disruption causes neuropsychiatric diseases. Loss of the cytoplasmic region of protocadherin-α (Pcdh-α) family proteins, products of the diverse clustered Pcdh genes, causes unbalanced distributions (densification and sparsification) of serotonergic axons in various target regions. However, which Pcdh-α member(s) are responsible for the phenotype is unknown. Here we demonstrated that Pcdh-αC2 (αC2), a Pcdh-α isoform, was highly expressed in serotonergic neurons, and was required for normal diffusion in single-axon-level analyses of serotonergic axons. The loss of αC2 from serotonergic neurons, but not from their target brain regions, led to unbalanced distributions of serotonergic axons. Our results suggest that αC2 expressed in serotonergic neurons is required for serotonergic axon diffusion in various brain areas. The αC2 extracellular domain displays homophilic binding activity, suggesting that its homophilic interaction between serotonergic axons regulates axonal density via αC2's cytoplasmic domain.


Conflict of interest statement

The authors declare that they have no competing interests.

Figures

Figure 1
Figure 1
Pcdha del(11-C2)/del(11-C2) mice, but not Pcdha del(2-11)/del(2-11) mice, exhibit altered distributions of serotonergic axons. (a) Wild-type (WT) Pcdh-α genes consist of exons (1–12, C1 and C2; green) in a variable region (VR) and exons (CR1–CR3; red) in a constant region (CR). The individual variable exons are transcribed from their own promoters. A Pcdh-α transcript is produced from one variable exon and three or four constant exons by splicing. In the del(2-11) allele, exons α2–α11 were deleted. In the del(11-C2) allele, exons α11, α12, αC1, and αC2 were deleted. (bd) Serotonergic axons in WT, Pcdha del(2-11)/del(2-11), and Pcdha del(11-C2)/del(11-C2) mice were detected by an anti-serotonin transporter (SERT) antibody. The distribution of serotonergic axons in Pcdha del(2-11)/del(2-11) mice (c) was similar to that in WT mice (b), whereas the serotonergic fibers of Pcdha del(11-C2)/del(11-C2) mice (d) were densified in the stratum lacnosum-moleculare (SLM) of CA1, and sparsified in the stratum oriens (SO) of CA1 and in the dentate gyrus (DG), compared with WT mice. SR, stratum radiatum. Scale bar: (bd), 500 µm. (e) Quantification of SERT(+) fibers in WT (n = 6) and Pcdha del(2-11)/del(2-11) mice (n = 5). (f) Quantification of SERT(+) fibers in WT (n = 6) and Pcdha del(11-C2)/del(11-C2) mice (n = 5). *p < 0.05, **p < 0.01. Mean ± SEM. (g) Expression analysis by in situ hybridization using probes for α10, α11, α12, αC1, αC2, αCR, and Sert in adjacent coronal sections of the dorsal raphe nucleus of WT and Pcdha del(11-C2)/del(11-C2) mice.
Figure 2
Figure 2
Pcdha ∆C2/∆C2 mice exhibit altered distributions of serotonergic axons. (a) WT and ∆C2 alleles. In the ∆C2 allele, the αC2 exon was deleted. (bd) Parasagittal sections of WT (b), Pcdha ∆C2/∆C2 (c) and Pcdha ∆CR/∆CR brains (d) were stained with an anti-SERT antibody. Boxed areas (el) in (b) and (c) were magnified in the following panels. (e,f) In layer 2 (L2) of the anterior olfactory nucleus, the density of SERT(+) axons in Pcdha ∆C2/∆C2 mice (f) was higher than that in WT mice (e). (g,h) In the granule cell layer (GCL) of the olfactory bulb, SERT(+) axons of Pcdha ∆C2/∆C2 mice (h) showed densification, compared with that of WT (g). EPL, external plexiform layer; GL, glomerular layer; IPL, inner plexiform layer; MCL, mitral cell layer. (i,j) In L1 of the somatomotor cortex, SERT(+) axons of Pcdha ∆C2/∆C2 mice (j) showed densification, compared with that of WT (i). (k, l) In the optic nerve layer (Op) of the superior colliculus, the density of SERT(+) axons of Pcdha ∆C2/∆C2 mice (l) was higher, compared with that of WT mice (k). InG, intermediate gray layer; SuG, superficial gray layer; Zo, zonal layer. (m,n) SERT(+) axons in the spinal cord of Pcdha +/∆C2 (m) and Pcdha ∆C2/∆C2 mice (n). Scale bars: 1 mm (bd); 100 µm (el); 200 µm (m,n).
Figure 3
Figure 3
αC2 protein is required for normal serotonergic projections. (a–d) Serotonergic axons in the hippocampus of WT (a,c) and Pcdha ∆C2/∆C2 (b,d) mice were detected with an anti-SERT antibody. Panels (c) and (d) are higher-magnification images of the boxed areas in (a) and (b), respectively. SP, stratum pyramidale. (e) Quantification of SERT(+) fibers in the hippocampus of WT (n = 4), Pcdha +/∆C2 (n = 3), and Pcdha ∆C2/∆C2 (n = 4) mice. *p < 0.05, **p < 0.01. Mean ± SEM. (f) Quantitative RT-PCR for the Pcdha and Sert genes. There was no significant difference between WT and Pcdha ∆C2/∆C2 KO mice. Mean ± SEM. (g) Expression analysis by in situ hybridization using probes for α11, α12, αC1, αC2, αCR, and Sert in adjacent coronal sections of the dorsal raphe nucleus of WT and Pcdha ∆C2/∆CR mice. Scale bars: (a,b), 200 µm; (c,d) 50 µm; 200 μm (g).
Figure 4
Figure 4
Dorsal telencephalon-specific Pcdh-α KO mice exhibit normal serotonergic projections. (a) In the flox allele, loxP-FRT-neo r -FRT-loxP-Myc-Venus and loxP sequences were inserted upstream of the α1 exon and downstream of the CR3 exon, respectively. Telencephalon-specific Pcdh-α KO mice were homozygous for the Pcdhα flox allele in Emx1 Cre/+. (b,c) In situ hybridization analysis with and αCR probe in the hippocampus. The expression level of the total Pcdh-α mRNA was markedly decreased in the hippocampus of Pcdha flox/flox ; Emx1 Cre/+ mice (c), compared with controls (Pcdha +/+ ; Emx1 Cre/+ mice) (b). (d,e) In the hippocampus, the SERT(+) axonal distributions in the Pcdha flox/flox ; Emx1 Cre/+ mice (e) were normal compared with controls (Pcdha flox/flox, d). (f) Quantification of SERT(+) fibers in the hippocampus of control Pcdha flox/flox (n = 3) and Pcdha flox/flox ; Emx1-Cre mice (n = 3). The density of SERT(+) axons in the hippocampus showed no significant difference. Scale bars, 200 μm (be).
Figure 5
Figure 5
Serotonergic neuron-specific αC2 KO mice exhibit abnormal serotonergic projections. (a) Serotonergic-neuron-specific αC2 KO mice had heterozygous Pcdhα flox and ∆C2 alleles with the ePet-Cre transgene. (b–e) In situ hybridization analysis with Serotonin transporter (Sert) and αC2 probes in the median raphe nuclei using adjacent sections. Almost all the Sert-positive neurons were αC2-positive in the Pcdha flox/∆C2 control (c); in contrast, the αC2-positive neurons were decreased among the Sert-positive neurons of the Pcdha flox/∆C2 ; ePet-Cre mice (e). (f,g) Pcdha flox/∆C2 ; ePet-Cre mice exhibited abnormal SERT(+) axonal distributions in the hippocampus (g) compared with controls (Pcdha flox/∆C2) (f). (h) Quantification of SERT(+) fibers in the hippocampus of control Pcdha flox/∆C2 (n = 3) and Pcdha flox/∆C2 ; ePet-Cre mice (n = 3). *p < 0.05, Mean ± SEM. Scale bars: 100 μm (be); 200 μm (f,g).
Figure 6
Figure 6
Diffusion of serotonergic axons is suppressed in the hippocampus of αC2 KO mice. (af) Viral vector (AAV-EF1α-DIO-tRFP-WPRE) was transferred into serotonergic neurons in the raphe nuclei of Sert-Cre mice. (a) Coronal sections were immuno-stained with an anti-Cre antibody, and RFP (magenta) was expressed in Cre(+) cells (green) in the median raphe nucleus (arrows) of Sert-Cre mice. (b) A portion of SERT(+) axons (green) was RFP-positive (magenta, arrowheads). (c,d) RFP(+) axons in control (Sert-Cre) (c) and αC2 KO (Pcdha ∆C2/∆C2; Sert-Cre) mice (d) were detected in sagittal sections. (e,f) The RFP(+) axons crossing the 20-μm inner line (L − 20) and/or the 20-μm outer line (L + 20) from the SLM/SR boundary (L0) were traced in control (e) and αC2 KO mice (f). Panels (e) and (f) were depicted from panels (c) and (d), respectively. White, magenta, or green lines indicate axons crossing both lines, only L − 20, or only L + 20, respectively (e,f). (g) RFP(+) axons crossing L − 20 and/or L + 20 were counted in control (n = 4 sections, 3 mice) and αC2 KO mice (n = 3 sections, 2 mice). Scale bars: 50 μm (a); 10 μm (b); 40 μm (cf).
Figure 7
Figure 7
Serotonergic axons in the granule cell layer are suppressed from invading the outer layers in αC2 KO mice. (a–c) In the olfactory bulb, serotonergic axons of αC2 KO mice (a) were densified in the granule cell layer (GCL), and sparsified in the internal plexiform layer (IPL), mitral cell layer (MCL), and external plexiform layer (EPL), compared with WT mice (b). Sagittal sections of the dorsal olfactory bulb were stained by an anti-SERT antibody (magenta) and DAPI (blue). In the GCL, the density of SERT(+) axons of αC2 KO mice (n = 5 sections from 3 mice) was significantly higher than that in WT mice (n = 4 sections, 3 mice) (c). In the EPL, the density of SERT(+) axons of αC2 KO mice (n = 6 sections, 3 mice) was significantly lower than that in WT mice (n = 6 sections, 3 mice) (c). (d–f) SERT(+) axons crossing the lines 20-µm within (L − 20) and/or 20-µm outside (L + 20) from the IPL/GCL boundary (L0) were traced (d,e). Panels (d) and (e) were depicted from panels (a) and (b), respectively. White, magenta or green lines indicate axons crossing both lines, only L − 20 or only L + 20, respectively (d,e). Arrowheads indicate end points (d,e). SERT(+) axons crossing L − 20 and/or L + 20 were counted in WT (n = 3 sections, 3 mice) and αC2 KO mice (n = 3 sections, 3 mice) (f). (g) In the GCL, there was no significant difference in the frequency of branch points or of end points between WT and αC2 KO mice. SERT(+) axons in the GCL (50 × 50 × 50 µm) of WT (n = 130 axons from 4 sections, 3 mice) and αC2 KO mice (n = 407 axons from 5 sections, 3 mice) were traced, and their length, branch points, and end points were analyzed. Survival analyses (Log-rank tests) for these axons were performed. (h,i) SERT(+) axons in GCL of αC2 KO mice showed fasciculation (arrows in h and i). Panels (h1)–(h4) and panels (i1)–(i4) indicate the cross sections in panel (h) and (i), respectively. Arrows in h,h1h4,i, and i1i4 indicate axon pairs that run parallel to each other. Scale bars, 40 µm (a,b,d,e); 10 µm (h–i).

References

    1. Scott MM, et al. A genetic approach to access serotonin neurons for in vivo and in vitro studies. Proc Natl Acad Sci USA. 2005;102:16472–16477. doi: 10.1073/pnas.0504510102. - DOI - PMC - PubMed
    1. Deneris ES. Molecular genetics of mouse serotonin neurons across the lifespan. Neuroscience. 2011;197:17–27. doi: 10.1016/j.neuroscience.2011.08.061. - DOI - PMC - PubMed
    1. Kiyasova V, Gaspar P. Development of raphe serotonin neurons from specification to guidance. Eur J Neurosci. 2011;34:1553–1562. doi: 10.1111/j.1460-9568.2011.07910.x. - DOI - PubMed
    1. Gaspar P, Cases O, Maroteaux L. The developmental role of serotonin: news from mouse molecular genetics. Nat Rev Neurosci. 2003;4:1002–1012. doi: 10.1038/nrn1256. - DOI - PubMed
    1. Lidov HG, Molliver ME. An immunohistochemical study of serotonin neuron development in the rat: ascending pathways and terminal fields. Brain research bulletin. 1982;8:389–430. doi: 10.1016/0361-9230(82)90077-6. - DOI - PubMed