. 2017 Nov 21;7(1):15953.
doi: 10.1038/s41598-017-16264-x.

CT dose reduction factors in the thousands using X-ray phase contrast

Affiliations

CT dose reduction factors in the thousands using X-ray phase contrast

Marcus J Kitchen et al. Sci Rep. .

Abstract

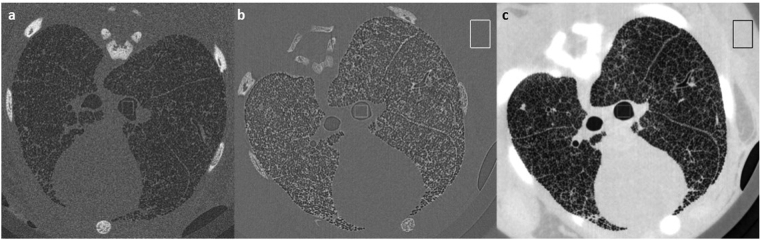
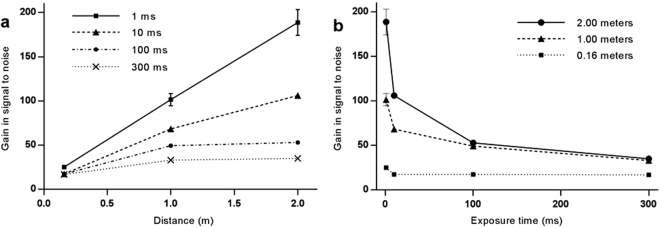
Phase-contrast X-ray imaging can improve the visibility of weakly absorbing objects (e.g. soft tissues) by an order of magnitude or more compared to conventional radiographs. Combining phase retrieval with computed tomography (CT) can increase the signal-to-noise ratio (SNR) by up to two orders of magnitude over conventional CT at the same radiation dose, without loss of image quality. Our experiments reveal that as the radiation dose decreases, the relative improvement in SNR increases. We show that this enhancement can be traded for a reduction in dose greater than the square of the gain in SNR. Upon reducing the dose 300 fold, the phase-retrieved SNR was still up to 9.6 ± 0.2 times larger than the absorption contrast data with spatial resolution in the tens of microns. We show that this theoretically reveals the potential for dose reduction factors in the tens of thousands without loss in image quality, which would have a profound impact on medical and industrial imaging applications.


Conflict of interest statement

The authors declare that they have no competing interests.

Figures

Figure 1
Figure 1
CT slice reconstruction of rabbit kitten lungs. (a) Absorption contrast CT reconstruction at sample to detector distance 0.16 m. (b) Phase contrast CT at 2 m; (c) and with phase retrieval (TIE-Hom) at 2 m. The dark areas represent air-filled airways in the lungs and bones appear bright. Black and white boxes indicate typical positions of uniform regions of interest for SNR analysis. The exposure time was 10 ms per projection for all images. Separate greyscale palettes have been used for each image. Image dimensions: (a) 18.36 mm × 18.51 mm; (b) and (c), 20.65 mm × 18.51 mm.
Figure 2
Figure 2
Magnified lung tissue reconstructions as a function of propagation distance and exposure time (time stated per projection). The same greyscale palette has been used for all images. Image dimensions: 3.83 mm × 3.83 mm. Dark regions are cross-sections through the airways including large bronchioles and alveoli (~160 μm diameter). TIE-Hom retrieval has been employed for all but the top row of data. An increase in image quality of soft tissues is observed as both variables (propagation distance, and exposure time) increase. At the shortest distance (0.16 m) the raw reconstructions (no phase retrieval) are dominated by noise at the two shortest exposure times, but at the two longest exposure times individual alveoli are clearly visible. Even at 0.16 m, phase contrast halos highlight the airways and enhance their apparent spatial resolution, showing that this is not a true absorption contrast image. A substantial improvement in image quality is also seen when phase retrieval is applied, even at 0.16 m. Phase retrieval removes the halo artefacts and greatly suppresses noise without losing visibility of the microscopic alveoli, even for the 1 ms exposures. At larger distances the image quality appears remarkably consistent across all exposure settings, despite the dose varying by a factor of 300.
Figure 3
Figure 3
Plots of gain in SNR; phase retrieved data with respect to absorption contrast data, calculated separately at each exposure time. (a) Gain in SNR vs propagation distance. Exposure times per projection: 1 ms (squares, solid line), 10 ms (triangles, dashed line), 100 ms (circles, dash-dotted line), and 300 ms (crosses, dotted line). (b) Gain in SNR vs exposure time. Sample to detector distances were 0.16 m (squares, dotted line), 1.0 m (triangles, dashed line), and 2.0 m (circles, solid line). Uncertainties were calculated by summing fractional SNR uncertainties from phase- and absorption-contrast data, and scaled by the gain value.

References

    1. Bravin A, Coan P, Suortti P. X-ray phase-contrast imaging: from pre-clinical applications towards clinics. Physics in Medicine and Biology. 2013;58:R1–35. doi: 10.1088/0031-9155/58/1/R1. - DOI - PubMed
    1. Kitchen MJ, et al. Phase contrast X-ray imaging of mice and rabbit lungs: a comparative study. British Journal of Radiology. 2005;78:1018–1027. doi: 10.1259/bjr/13024611. - DOI - PubMed
    1. Zhao Y, et al. High-resolution, low-dose phase contrast X-ray tomography for 3D diagnosis of human breast cancers. PNAS. 2012;109:18290–18294. doi: 10.1073/pnas.1204460109. - DOI - PMC - PubMed
    1. Cloetens P, Barrett R, Baruchel J, Guigay J-P, Schlenker M. Phase objects in synchrotron radiation hard x-ray imaging. J. Phys. D: Appl. Phys. 1996;29:133–146. doi: 10.1088/0022-3727/29/1/023. - DOI
    1. Wilkins SW, Gureyev TE, Gao D, Pogany A, Stevenson AW. Phase-contrast imaging using polychromatic hard x-rays. Nature. 1996;384:335–338. doi: 10.1038/384335a0. - DOI

Publication types