. 2017 Nov 21;7(1):15945.
doi: 10.1038/s41598-017-16112-y.

Overexpression of suppressive microRNAs, miR-30a and miR-200c are associated with improved survival of breast cancer patients

Affiliations

Overexpression of suppressive microRNAs, miR-30a and miR-200c are associated with improved survival of breast cancer patients

Tsutomu Kawaguchi et al. Sci Rep. .

Abstract

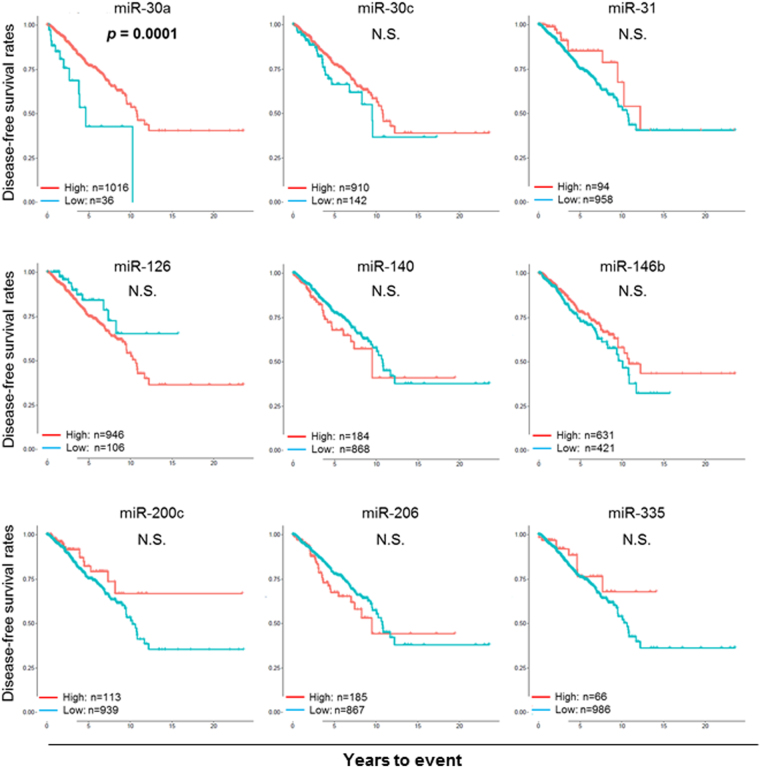
Some microRNAs (miRNAs) are known to suppress breast cancer. However, whether the expressions of these tumor suppressive miRNAs translate to patient survival were not investigated in large cohort. Nine miRNAs (miR-30a, miR-30c, miR-31, miR-126, miR-140, miR-146b, miR-200c, miR-206, and miR-335) known to be tumor suppressive miRNAs in breast cancer were investigated in Genomic Data Common data portal miRNA-Seq dataset and The Cancer Genome Atlas (TCGA) (n = 1052). Of the 9 miRNAs, miR-30a, miR-30c, miR-126, miR-140, miR-206, and miR-335 were found to have significantly lower expression in breast cancer tissues compared to paired normal breast tissue. High expression of miR-30a or miR-200c was associated with significantly better overall survival (OS). Gene Set Enrichment Analysis (GSEA) demonstrated that low expression levels of miR-30a had the tendency to associate with gene enrichment of EMT, while miR-200c did not, in TCGA cohort, and our findings support the need of validation using large cohort to use miRNA as prognostic biomarker for patients with breast cancer.


Conflict of interest statement

The authors declare that they have no competing interests.

Figures

Figure 1
Figure 1
Expression levels of the 9 tumor-suppressive miRNAs in breast cancer samples and their paired normal breast samples retrieved from TCGA dataset (n = 103). One-sided p < 0.05 was considered statistically significant for analysis of expression levels in cancer vs. normal tissue (tested normal greater than tumor).
Figure 2
Figure 2
Expression of 9 selected tumor suppressive miRNAs in breast cancer was studied for their impact on overall survival (OS). OS was compared using the Kaplan-Meier curves and log rank test between the high (red line) and low (blue line) expression groups determined by each miRNA-specific thresholds. P value in bold type indicates statistical significance.
Figure 3
Figure 3
Expression of 9 tumor suppressive miRNAs in breast cancer was studied for their impact on patient’s disease-free survival (DFS). DFS was compared using the Kaplan-Meier curves and log rank test between the high (red line) and low (blue line) expression groups determined by each miRNA-specific thresholds. P value in bold type indicates statistical significance.
Figure 4
Figure 4
OS analyses of miR-30a in each stage and subtypes (ER positive and non-triple negative subgroups). OS was compared using the Kaplan-Meier curves and log rank test between the high (red line) and low (blue line) expression groups determined by the miRNA-30a-specific thresholds. P value in bold type indicates statistical significance.
Figure 5
Figure 5
OS analyses of miR-200c in each stage and subtypes (ER positive and non-triple negative subgroups). OS was compared using the Kaplan-Meier curves and log rank test between the high and low expression groups determined by the miRNA-200c-specific thresholds. P value in bold type indicates statistical significance.
Figure 6
Figure 6
GSEA for expression levels of miR-30a or miR-200c. GSEA analyses were performed for HALLMARK EPITHELIAL MESENCHYMAL TRANSITION and HALLMARK TGF BETA SIGNALING using TCGA. ES, enrichment score; NES, normalized enrichment score.

References

    1. Bertone P, et al. Global identification of human transcribed sequences with genome tiling arrays. Science (New York, N.Y.) 2004;306:2242–2246. doi: 10.1126/science.1103388. - DOI - PubMed
    1. Cheng J, et al. Transcriptional maps of 10 human chromosomes at 5-nucleotide resolution. Science (New York, N.Y.) 2005;308:1149–1154. doi: 10.1126/science.1108625. - DOI - PubMed
    1. Birney E, et al. Identification and analysis of functional elements in 1% of the human genome by the ENCODE pilot project. Nature. 2007;447:799–816. doi: 10.1038/nature05874. - DOI - PMC - PubMed
    1. Kapranov P, et al. RNA maps reveal new RNA classes and a possible function for pervasive transcription. Science (New York, N.Y.) 2007;316:1484–1488. doi: 10.1126/science.1138341. - DOI - PubMed
    1. Wilusz JE, Sunwoo H, Spector DL. Long noncoding RNAs: functional surprises from the RNA world. Genes & development. 2009;23:1494–1504. doi: 10.1101/gad.1800909. - DOI - PMC - PubMed

Publication types