. 2017 Nov 21;7(1):15957.
doi: 10.1038/s41598-017-16289-2.

Dysbiosis of the microbiome in gastric carcinogenesis

Affiliations

Dysbiosis of the microbiome in gastric carcinogenesis

Natalia Castaño-Rodríguez et al. Sci Rep. .

Abstract

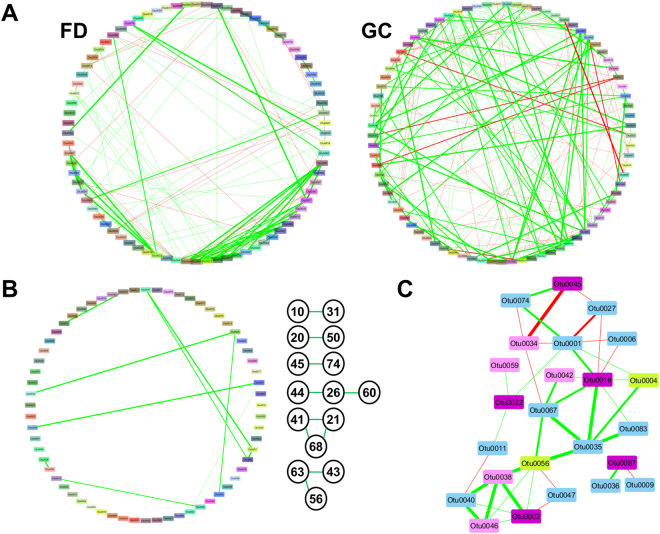
The gastric microbiome has been proposed as an etiological factor in gastric carcinogenesis. We compared the gastric microbiota in subjects presenting with gastric cancer (GC, n = 12) and controls (functional dyspepsia (FD), n = 20) from a high GC risk population in Singapore and Malaysia. cDNA from 16S rRNA transcripts were amplified (515F-806R) and sequenced using Illumina MiSeq 2 × 250 bp chemistry. Increased richness and phylogenetic diversity but not Shannon's diversity was found in GC as compared to controls. nMDS clustered GC and FD subjects separately, with PERMANOVA confirming a significant difference between the groups. H. pylori serological status had a significant impact on gastric microbiome α-diversity and composition. Several bacterial taxa were enriched in GC, including Lactococcus, Veilonella, and Fusobacteriaceae (Fusobacterium and Leptotrichia). Prediction of bacterial metabolic contribution indicated that serological status had a significant impact on metabolic function, while carbohydrate digestion and pathways were enriched in GC. Our findings highlight three mechanisms of interest in GC, including enrichment of pro-inflammatory oral bacterial species, increased abundance of lactic acid producing bacteria, and enrichment of short chain fatty acid production pathways.


Conflict of interest statement

The authors declare that they have no competing interests.

Figures

Figure 1
Figure 1
Alpha-diversity and phylogenetic diversity of the gastric microbiota. Phylogenetic diversity was calculated according to Faith. P-values were calculated using one-way ANOVA with a Tukey’s multiple comparisons test.
Figure 2
Figure 2
Composition of the gastric microbiota. (A) Non-metric multidimensional scaling plot and (B) PERMANOVA following square-root transformation and Bray-Curtis similarity resemblance. (C) Relative abundance of bacterial genera across FD and GC subjects following the removal of the contribution of Helicobacter. Colour legend is provided in Supplementary File 1. (D) Cladogram of LEfSe analysis between FD controls and GC patients nested for H. pylori serological status. Higher resolution colour legend is provided in Supplementary File 1. FD: Functional dyspepsia; GC: Gastric cancer; HP-NEG: negative for H. pylori; HP-POS: positive for H. pylori.
Figure 3
Figure 3
Relative abundance of bacterial genera of interest in FD controls and GC patients. Methylobacterium relative abundance was broken down to OTU contribution.
Figure 4
Figure 4
Prediction of the metabolic contribution of the gastric microbiota using PICRUSt. (A) Non-metric multidimensional scaling plot and (B) Cluster analysis with SIMPROF testing following Log(X + 1) transformation and Bray-Curtis similarity resemblance. (C) KEGG pathways (Level 3) enriched in GC using LEfSe analysis. P-values are presented at the end of the bars.
Figure 5
Figure 5
Network analysis of bacterial OTUs within the gastric microbiota. (A) Network plots for FD controls and GC patients. Correlations for OTUs 1–100 were calculated using SparCC and correlations greater than 0.6 or lower than −0.5 were visualized using Cytoscape. Co-occurrence and co-exclusion interactions were drawn in green and red, respectively. Thickness of the line indicates strength of the correlation. Full lists of correlations are provided in Supplementary File 1. (B) Similarities between the FD and GC networks, and the shared interactions between OTUs. Numbers represent OTUs that interact with each other (i.e. 10 = OTU0010). (C) Network analysis of OTUs that were identified to be enriched in GC using LEfSe. OTUs in dark purple were identified as enriched in GC in the nested analysis; OTUs in pink were identified as enriched in GC in the non-nested analysis; OTUs in yellow were enriched in FD in either the nested or non-nested analysis; OTUs in light blue were not found to be enriched using LEfSe. A full list of correlations is provided in Supplementary File 1.

References

    1. Ferlay, J. et al. GLOBOCAN 2012 v1.0, Cancer Incidence and Mortality Worldwide. IARC CancerBase No. 11 [Internet]. Lyon, France: International Agency for Research on Cancer (2013).
    1. Brenner H, Rothenbacher D, Arndt V. Epidemiology of stomach cancer. Methods Mol. Biol. 2009;472:467–477. doi: 10.1007/978-1-60327-492-0_23. - DOI - PubMed
    1. Goh KL, Cheah PL, Md N, Quek KF, Parasakthi N. Ethnicity and H. pylori as risk factors for gastric cancer in Malaysia: A prospective case control study. Am. J. Gastroenterol. 2007;102:40–45. doi: 10.1111/j.1572-0241.2006.00885.x. - DOI - PubMed
    1. Wroblewski LE, Peek RM, Jr., Wilson KT. Helicobacter pylori and gastric cancer: factors that modulate disease risk. Clin. Microbiol. Rev. 2010;23:713–739. doi: 10.1128/CMR.00011-10. - DOI - PMC - PubMed
    1. Lertpiriyapong K, et al. Gastric colonisation with a restricted commensal microbiota replicates the promotion of neoplastic lesions by diverse intestinal microbiota in the Helicobacter pylori INS-GAS mouse model of gastric carcinogenesis. Gut. 2014;63:54–63. doi: 10.1136/gutjnl-2013-305178. - DOI - PMC - PubMed

Publication types