. 2017 Oct 27:11:331.
doi: 10.3389/fncel.2017.00331. eCollection 2017.

Partial Aminoglycoside Lesions in Vestibular Epithelia Reveal Broad Sensory Dysfunction Associated with Modest Hair Cell Loss and Afferent Calyx Retraction

Affiliations

Partial Aminoglycoside Lesions in Vestibular Epithelia Reveal Broad Sensory Dysfunction Associated with Modest Hair Cell Loss and Afferent Calyx Retraction

David R Sultemeier et al. Front Cell Neurosci. .

Abstract

Although the effects of aminoglycoside antibiotics on hair cells have been investigated for decades, their influences on the dendrites of primary afferent neurons have not been widely studied. This is undoubtedly due to the difficulty in disassociating pathology to dendritic processes from that resulting from loss of the presynaptic hair cell. This was overcome in the present investigation through development of a preparation using Chinchilla laniger that enabled direct perilymphatic infusion. Through this strategy we unmasked gentamicin's potential effects on afferent calyces. The pathophysiology of the vestibular neuroepithelia after post-administration durations of 0.5 through 6 months was assessed using single-neuron electrophysiology, immunohistochemistry, and confocal microscopy. Hair cell densities within cristae central zones (0.5-, 1-, 2-, and 6-months) and utricle peri- and extrastriola (6-months) regions were determined, and damage to calretinin-immunoreactive calyces was quantified. Gentamicin-induced hair cell loss exhibited a profile that reflected elimination of a most-sensitive group by 0.5-months post-administration (18.2%), followed by loss of a second group (20.6%) over the subsequent 5.5 months. The total hair cell loss with this gentamicin dose (approximately 38.8%) was less than the estimated fraction of type I hair cells in the chinchilla's crista central zone (approximately 60%), indicating that viable type I hair cells remained. Extensive lesions to afferent calyces were observed at 0.5-months, though stimulus-evoked modulation was intact at this post-administration time. Widespread compromise to calyx morphology and severe attenuation of stimulus-evoked afferent discharge modulation was found at 1 month post-administration, a condition that persisted in preparations examined through the 6-month post-administration interval. Spontaneous discharge was robust at all post-administration intervals. All calretinin-positive calyces had retracted at 2 and 6 months post-administration. We found no evidence of morphologic or physiologic recovery. These results indicate that gentamicin-induced partial lesions to vestibular epithelia include hair cell loss (ostensibly reflecting an apoptotic effect) that is far less extensive than the compromise to stimulus-evoked afferent discharge modulation and retraction of afferent calyces (reflecting non-apoptotic effects). Additionally, calyx retraction cannot be completely accounted for by loss of type I hair cells, supporting the possibility for direct action of gentamicin on the afferent dendrite.

Keywords: ototoxicity; primary afferent; spontaneous discharge; stimulus–response coherence.


Figures

FIGURE 1
FIGURE 1
Comparison of CALB2+ calyces within cristae central zones from Normal, Vehicle Control, and Contralesion control specimens. The micrographs represent maximum intensity projections (A–C) and orthogonal optical sections (A′–C′) of whole-mounted horizontal semicircular canal cristae labeled with anti-CALB2 (red) and Nissl stain (grayscale). Calyx morphology was similar in all control specimens, and exhibited narrow fluted necks at their apex closely conforming to the type I hair cell morphology. Scale bar shown in (A) applies to all micrographs. (D) CALB2+ calyx and parent axon densities expressed as counts/100 μm2 epithelial area for horizontal, posterior, and superior cristae in all control specimens. See text for a discussion of the differences across epithelia. CALB2+ calyx densities were similar across all control conditions. (E) Central zone hair cell densities were similar across crista type and control conditions. The three control conditions were similar within any epithelium for each measure, and therefore the red triangles (and error bars) represent the mean control densities (±SD) over all conditions.
FIGURE 2
FIGURE 2
Vestibular afferent responses in untreated and vehicle controls. (A) The probability of encountering an afferent neuron projecting from each of the three epithelia served by the superior vestibular nerve in normal, untreated preparations is shown in this bar graph. This provided a perspective for the afferents probed at the recording site in untreated specimens that would be unresponsive to rotational stimuli (e.g., putative utricular afferents). These data showed that the majority of afferents accessible to microelectrode recording at this site projected from either the superior or horizontal cristae, which were readily identified by turntable rotation. Less than 20% of neurons encountered were unresponsive to rotation, which were identified as projecting from the utricle. (B) Afferents recorded from Vehicle Control specimens exhibited stimulus-evoked modulation similar to Normal (untreated) controls. Representative afferents that projected from the superior and horizontal cristae in one preparation are shown demonstrating robust modulation in response to sinusoidal turntable rotation (sinusoidal angular velocity stimulus trajectories, in °s-1, represented in the bottom traces). The scale of the vertical axes are similar in absolute range. Note the responses of the superior and horizontal afferents were approximately 180° out of phase (denoted by the dashed vertical line along each horizontal axis), illustrating the distinguishing characteristic of afferents projecting from these neuroepithelia. Afferents projecting from each crista in Vehicle Control specimens exhibited similarly robust modulation. Coherence and associated p-values for each full record are shown.
FIGURE 3
FIGURE 3
Pathophysiologic correlates in the 1st month following intraperilymphatic gentamicin administration. Micrographs of horizontal crista epithelia at 0.5 (A,B) and 1 (D,E) month following gentamicin administration illustrate the variability in the histopathology at these early post-administration periods. The discharge of two afferents from each preparation are shown to demonstrate the physiologic status of each (i.e., C corresponds to the micrographs in A and B; F corresponds to D and E). (A,B) Maximum intensity projection (A) and orthogonal optical section (B) views of CALB2+ afferents in the horizontal crista central zone 0.5 months after 1 μg gentamicin administration. All calyces retracted in this specimen, while remnant CALB2+ endings of parent axons and fine branches are observed. (C) In this preparation both horizontal and superior afferents exhibited robust responses to rotational stimuli despite the widespread central zone calyx retraction and very modest hair cell loss in this specimen (not shown). The 0.8 Hz stimulus trajectory (±30°⋅s-1) is represented by the bottom trace (blue). The coherence measures (Coh) demonstrated the high fidelity between stimulus and response that was retained at this early post-administration time. (D,E) Maximum intensity projection (D) and orthogonal optical section (E) views illustrating CALB2+ calyces in a horizontal crista central zone from a specimen harvested 1 month following 1 μg intraperilymphatic gentamicin. The fluted and narrow apical extensions seen in untreated calyces (see Figure 1) were absent in the majority of these calyces and appear to have retracted to exhibit wide openings in this treated specimen. This is illustrated in the orthogonal view (E) illustrating a calyx whose apical portion – just higher than the hair cell nucleus – is not observed. A 3D volume reconstruction of the boxed region (D, bottom) is shown at higher magnification in the inset (top right in D), for which the hair cell nuclei within the CALB2+ calyces were clearly visible through the widened apical openings of the calyces (recolored yellow). (F) Representative instantaneous discharge traces for two afferents recorded from the preparation represented in (D,E). These afferents were unresponsive to the sinusoidal rotation (0.8 Hz, 30°⋅s-1, bottom), confirmed by the low coherence values (Coh) shown for each perstimulus discharge record.
FIGURE 4
FIGURE 4
Sensory function is severely compromised by 2 months, and continues through 6 months, following intraperilymphatic gentamicin. (A) Representative responses of horizontal and superior semicircular canal afferents recorded from Untreated (i–iv) and gentamicin-treated (v–x) specimens in response to 0.8 Hz sinusoidal rotations of 15 (left) and 30°⋅s-1 (right) peak velocity (bottom traces in A). Among afferents recorded in three preparations at 2 months post-administration, most exhibited no response to rotation, similar to the traces in (ix,x) (verified by the low coherence values at each stimulus magnitude). However, in the gentamicin-treated preparation represented in this figure meager response were recorded in a few horizontal and superior afferents, shown in traces labeled (v–viii). Though the coherence values were lower than those typically measured in untreated preparations, the responses were verified for the horizontal afferent at both stimulus magnitudes, and the superior afferent only at 30°⋅s-1 magnitude. The third afferent from this preparation was unresponsive (ix,x). The discharge rate scale shown beneath the untreated horizontal afferent (30°⋅s-1) applies to all traces in (A). (B) Instantaneous discharge records of afferents during sinusoidal rotation (0.4 Hz, 30°⋅s-1; i,i′) obtained 6 months following gentamicin administration are shown. For comparison, representative perstimulus discharge records of afferents projecting from the superior (ii) and horizontal (iii) cristae in an untreated specimen are shown. The mean spontaneous discharge rates are provided at the left underneath each record, while stimulus–response coherence measures (Coh) and corresponding p-values (p) are shown at right. Note the high coherence values for afferents from the untreated specimen, even the superior afferent in which the stimulus-evoked modulation is very modest. The 10 afferents from the treated specimen (iv–xiii) were recorded in succession during the experimental session, and all exhibited low coherence measures that corresponded with probabilities greater than 0.2 that this measure could have arisen randomly. The low coherence measures confirmed that these afferents were unresponsive to the sinusoidal rotational stimulus. See text for more detailed interpretation.
FIGURE 5
FIGURE 5
Aggregate distributions of spontaneous discharge characteristics in vestibular afferents recorded after low-dose gentamicin administration. (A) Scatterplot illustrating the comparison of spontaneous discharge characteristics from gentamicin-treated specimens (green symbols) and the laboratory’s database of 430 semicircular canal afferents from normal (untreated) specimens (black/gray symbols). These data illustrated that the mean spontaneous ISIs among afferents from gentamicin-treated preparations appeared to be greater (right-shifted in this scatter plot) than afferents recorded from untreated specimens. These data are interpreted in the context of published data from semicircular canal (Baird et al., 1988) and utricular (Goldberg et al., 1990) afferents, shown in the inset, representing a comparison of spontaneous discharge characteristics from canal and utricle afferents recorded from the same laboratory, and therefore under similar conditions. (B) Normalized histograms of mean ISIs from gentamicin-treated (green bars, n = 132) and untreated (black/gray bars, n = 430) preparations (i.e., mean ISI data from A). The Kullback–Leibler divergence between these two distributions was 0.18, and resampling analyses indicated the probability that this KLD could have been derived from random sampling of a single combined distribution was less than 10-6 (i.e., p < 10-6). The inset histograms were derived from the published mean interspike interval (ISI) data of semicircular canal and utricular afferents (i.e., from inset in A). The KLD for these distributions was 0.08, reflecting the expected difference in mean intervals between canal and utricular afferents from the same preparations. See text for details.
FIGURE 6
FIGURE 6
Extensive calyx loss is seen in vestibular sensory epithelia exposed to 1 μg gentamicin. Horizontal semicircular canal cristae and utricles were immunolabeled with anti-CALB2 (red) and anti-TUBB3 (green) antibodies, and nuclei were labeled with a Nissl stain. (A–D) Confocal projections illustrating afferent calyces projecting to the cristae central-intermediate zones and utricle peristriola regions in contralesion control (A,B) and gentamicin-treated (C,D) specimens 6 months post-administration. Only three TUBB3+ calyces (arrows) can be seen in the micrograph of the treated utricle (D). (A′–D′) Projections of hair cell nuclei of the neuroepithelial areas shown in (A–D). Nuclei are colored in (A′,B′) to indicate type Ic (yellow), type Id (cyan), and type II (magenta) hair cells. In the treated epithelia (C′–D′) most hair cell types were indistinguishable because of extensive calyx loss, and nuclei are colored to indicate uncharacterized (blue) and type Id (cyan) hair cells. (A″–D″) Orthogonal optical sections illustrate diminished laminar organization of sensory and support cell nuclei (Nissl stain; blue) in gentamicin-treated specimens. Scale shown in A applies to all panels.
FIGURE 7
FIGURE 7
Gentamicin induced damage is similar across vestibular endorgans and at all post-administration time periods. Damage as illustrated by CALB2 immunoreactivity (red) and Nissl stain (grayscale) for endorgans of a single animal 2 months after administration (A–D) and in horizontal cristae ampullaris 0.5, 1, 2, and 6 months after exposure (E–H) is shown. Maximum intensity projections of confocal image stacks taken from the central-intermediate zone of the cristae and the peristriola region of the utricle demonstrate extensive CALB2+ calyx loss in all endorgans (A–D) and at all time periods (E–H). Orthogonal optical sections illustrate similar morphological characteristics in all endorgans (A′–D′) and at all time periods (E–H). Scale shown in A applies to all micrographs.
FIGURE 8
FIGURE 8
CALB2+ afferent damage after 1 μg gentamicin administration. Normalized CALB2+ calyx and parent axon densities, expressed as percentages of contralesion controls, are shown for horizontal, posterior and superior cristae at the specified post-administration times (i.e., 0.5, 1, 2, and 6 months). ANOVAs indicated the absence of a main effect for crista type, and therefore the mean densities across all cristae are represented by the red triangles. All data are shown as mean ± SD. Triple asterisks (∗∗∗) correspond to p < 0.001.
FIGURE 9
FIGURE 9
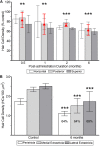
Hair cell survival after 1 μg gentamicin administration. (A) Hair cell survival in cristae from labyrinths treated with 1 μg gentamicin. As noted above, two-factor ANOVA revealed the absence of a main effect of crista type, and therefore the mean densities (±SD) are represented by the red triangles (and error bars). (B) Hair cell survival in utricles determined 6 months after gentamicin administration. The mean hair cell survival at this post-administration time in the peristriola (64%), medial extrastriola (64%), and lateral extrastriola (69%) were similar. All data are shown as means (±SD). Double asterisks (∗∗) correspond to p < 0.01; triple asterisks (∗∗∗) correspond to p < 0.001.
FIGURE 10
FIGURE 10
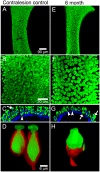
Surviving hair cells following gentamicin exposure exhibit aberrant morphology. Contralesion control (A–D) and gentamicin-treated (E–H) superior semicircular canal cristae were immunolabeled with anti-MYOVI (green) and anti-CALB2 (red) antibodies, and were Nissl-stained (blue) 6 months after gentamicin administration. (A,E) Low magnification confocal projections illustrating the distribution of MyoVI+ hair cells. (B,F) Higher magnification confocal projections images of the central-intermediate zones illustrate reduced MYOVI+ hair cell densities in the lesioned epithelia. (C,G) Orthogonal optical sections of the untreated and treated specimens. Cells with morphologies characteristic of type I (arrowhead) and type II (arrow) hair cells can be seen in an optical orthogonal section of the undamaged specimen (C). However, hair cells with aberrant morphologies resembling “tear drops” (arrowheads) and “barrels” (arrows) are observed in treated specimens (G). (D,H) 3D volume reconstructions show two MYOVI+ type I hair cells enveloped by a CALB2+ complex calyx in a contralesion control specimen (D), and a hair cell exhibiting “tear-drop” morphology is shown closely-apposed to a CALB2+ dendrite in a gentamicin-treated specimen (H). The CALB2 signal in (D) was made translucent to enable visualization of MYOVI signal. Scale bars are the same for (A,E) (90 μm), (B,C,F,G) (30 μm), and (D,H) (6 μm).
FIGURE 11
FIGURE 11
Biocytin labeled fibers illustrate patent small diameter dendritic branches and endings exhibiting bouton-like morphology in lesioned vestibular epithelia. Shown are micrographs of the horizontal semicircular canal crista and utricle from a specimen whose superior vestibular nerve was retrogradely labeled with TRITC-biocytin (green) 6 months post-administration. The specimens were also labeled with anti-CALB2 antibody (red) and Nissl stain (blue; nuclei in insets are grayscale). (A,B) Maximum intensity projections from the central and intermediate zones of the crista (A) and peristriola region of the utricle (B) illustrate the presence of biocytin-labeled fibers (arrows) projecting to the neuroepithelial regions harboring CALB2+ fibers. These fibers, which in untreated specimens would exhibit dimorphic dendritic morphologies (i.e., CALB2-negative fibers within these crista zones), were also without calyces as expected (see Figure 6). However, they do(exhibit a number of putative boutons en passant, seen as varicosities along thin dendritic branches. (C,D) Maximum intensity projections of hair cell nuclei present in the confocal projections shown in (A,B). Nuclei are colored to indicate representative hair cell nuclei closely apposed to a partially collapsed CALB2+ calyx (yellow in C and D), a partially collapsed biocytin-labeled calyx (cyan in D), and bouton-like endings (magenta in C). All other hair cell nuclei are shown in blue. Inset figures show representative orthogonal optical sections of stained nuclei (grayscale). (E–H′). Volume reconstructions of CALB2+ and biocytin-labeled dendrites illustrate the details of their projections in close proximity to hair cell nuclei. (E,E′) A 3D volume rendering of the corresponding boxed area in A illustrates bouton type endings (arrows) in close apposition to hair cell nuclei (magenta; E′). (F,F′) A 3D volume rendering of the corresponding boxed area in A shows a CALB2+ afferent wrapping around a hair cell nucleus (yellow) and a biocytin labeled neuron in close apposition to a hair cell nucleus (magenta). (G,G′) 3D volume renderings of the corresponding boxed region in B exhibiting a large-intermediate diameter biocytin labeled fiber forming a bowl at the base of a hair cell nucleus (cyan). (H,H′) 3D volume renderings of the corresponding boxed region in B show two CALB2+ fibers also labeled with TRITC-biocytin in close proximity to hair cells (nuclei shown in yellow). Note that CALB2 immunolabeling and TRITC-biocytin labeling closely overlap. Scale is the same for (A–D) (30 μm), and insets (72 μm). Scale is not shown for 3D volumes.)
FIGURE 12
FIGURE 12
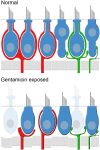
Summary schematic of partial lesion induced by low-dose gentamicin in the cristae central zones and utricle striola. The Normal (untreated) panel (top) depicts the components of these neuroepithelial regions, including types I and II hair cells exhibiting stereotyped morphologies, CALB2+ afferents with simple and complex calyces (i.e., calyx-only, red), dimorphic afferents (green), spherical hair cell nuclei, and tightly packed support cell nuclei. Vestibular epithelia exposed to Low-dose gentamicin (bottom), however, undergo several alterations that characterize the lesion. These include: (a) retraction of most calyces, including those of dimorphic afferents (right side of panel; Figures 3, 6, 7, 8); (b) modest hair cell loss (Figures 6, 9); (c) altered morphology of remaining hair cells, such that the stereotype morphologies of types I and II hair cells are not readily distinguished; these hair cells are viable as indicated by positive MYOVI immunolabeling (Figure 10); (d) remaining non-CALB2+ afferents projecting to the crista central zones and utricular striola (i.e., afferents originally exhibiting dimorphic morphologies) retain fine dendritic branches and putative postsynaptic boutons (Figure 11).

Similar articles

Cited by

References

    1. Alharazneh A., Luk L., Huth M., Monfared A., Steyger P. S., Cheng A. G., et al. (2011). Functional hair cell mechanotransducer channels are required for aminoglycoside ototoxicity. PLOS ONE 6:e22347. 10.1371/journal.pone.0022347 - DOI - PMC - PubMed
    1. Baird R. A., Desmadryl G., Fernandez C., Goldberg J. M. (1988). The vestibular nerve of the chinchilla. II. Relation between afferent response properties and peripheral innervation patterns in the semicircular canals. J. Neurophysiol. 60 182–203. - PubMed
    1. Bearzatto B., Servais L., Roussel C., Gall D., Baba-Aissa F., Schurmans S., et al. (2006). Targeted calretinin expression in granule cells of calretinin-null mice restores normal cerebellar functions. FASEB J. 20 380–382. 10.1096/fj.05-3785fje - DOI - PubMed
    1. Bignall J. R., Crofton J. W., Thomas J. A. (1951). Effect of streptomycin on vestibular function. Br. Med. J. 1 554–559. 10.1136/bmj.1.4706.554 - DOI - PMC - PubMed
    1. Bremer H. G., Versnel H., Hendriksen F. G., Topsakal V., Grolman W., Klis S. F. (2014). Does vestibular end-organ function recover after gentamicin-induced trauma in Guinea pigs? Audiol. Neurootol. 19 135–150. 10.1159/000357587 - DOI - PubMed

LinkOut - more resources