. 2017 Nov 2:11:334.
doi: 10.3389/fncel.2017.00334. eCollection 2017.

RIM-Binding Protein 2 Promotes a Large Number of CaV1.3 Ca2+-Channels and Contributes to Fast Synaptic Vesicle Replenishment at Hair Cell Active Zones

Affiliations

RIM-Binding Protein 2 Promotes a Large Number of CaV1.3 Ca2+-Channels and Contributes to Fast Synaptic Vesicle Replenishment at Hair Cell Active Zones

Stefanie Krinner et al. Front Cell Neurosci. .

Abstract

Ribbon synapses of inner hair cells (IHCs) mediate high rates of synchronous exocytosis to indefatigably track the stimulating sound with sub-millisecond precision. The sophisticated molecular machinery of the inner hair cell active zone realizes this impressive performance by enabling a large number of synaptic voltage-gated CaV1.3 Ca2+-channels, their tight coupling to synaptic vesicles (SVs) and fast replenishment of fusion competent SVs. Here we studied the role of RIM-binding protein 2 (RIM-BP2)-a multidomain cytomatrix protein known to directly interact with Rab3 interacting molecules (RIMs), bassoon and CaV1.3-that is present at the inner hair cell active zones. We combined confocal and stimulated emission depletion (STED) immunofluorescence microscopy, electron tomography, patch-clamp and confocal Ca2+-imaging, as well as auditory systems physiology to explore the morphological and functional effects of genetic RIM-BP2 disruption in constitutive RIM-BP2 knockout mice. We found that RIM-BP2 (1) positively regulates the number of synaptic CaV1.3 channels and thereby facilitates synaptic vesicle release and (2) supports fast synaptic vesicle recruitment after readily releasable pool (RRP) depletion. However, Ca2+-influx-exocytosis coupling seemed unaltered for readily releasable SVs. Recordings of auditory brainstem responses (ABR) and of single auditory nerve fiber firing showed that RIM-BP2 disruption results in a mild deficit of synaptic sound encoding.

Keywords: RIM-BP; STED microscopy; calcium; cochlea; electron microscopy; exocytosis; ribbon synapse.


Figures

Figure 1
Figure 1
RIM-BP2 forms stripe like clusters at the base of the synaptic IHC ribbon. (A) Expression analysis of RIM-BP2 in IHCs: Maximum projections of confocal stacks after immunohistochemistry of whole-mount explants of apical organs of Corti. RIM-BP2 immunofluorescence (green) co-localizes with presynaptic ribbons (CtBP2/RIBEYE, magenta) in RIM-BP2+/+ IHCs and is absent in parallel processed littermate RIM-BP2−/− IHCs, indicating specificity of the immunolabeling. Additional RIM-BP2 fluorescence in RIM-BP2+/+ IHCs most likely localizes to presynaptic efferent terminals (B). Scale bar: 10 μm. (B) Top: Maximum projections of confocal stacks after triple-immunostaining of whole-mount explants of apical organs of Corti. RIM-BP2 immunofluorescence (green) co-localizes with either presynaptic ribbons (CtBP2/RIBEYE, magenta) or Synapsin1/2 (gray) marked presynaptic terminals of efferent lateral olivocochlear neurons. Scale bar 5 μm. Bottom: Illustration of a mature murine IHC: Afferent type I SGNs innervate ribbon synapses at the IHC base. Efferent synapses of the lateral olivocochlear neurons form projections onto type I SGN synapses nearby the IHC. Location of presynaptic ribbons (CtBP2/RIBEYE) is highlighted in magenta. RIM-BP2 (green) forms clusters at the presynaptic density at the base of the synaptic ribbon and at the AZs of efferent presynaptic terminals. (C) Nanoscale organization of RIM-BP2: 2-color STED microscopy of individual active zones from whole mount explants of apical organs of Corti after immunohistochemistry resolved a mostly stripe or double-stripe-like expression pattern of RIM-BP2 (green) at the ribbon (CtBP2/RIBEYE, magenta). Simultaneously acquired confocal images could not resolve single or double stripes of RIM-BP2. Single XY-sections, scale bar: 500 nm. (A–C) Age of mice: p21.
Figure 2
Figure 2
RIM-BP2 disruption does not affect afferent IHC connectivity. (A) Left: Maximum projections of confocal stacks from whole-mount explants from apical organs of Corti of p21 mice, immunolabeled for CtBP2/RIBEYE (magenta) and GluA2/3 (green). Scale bar: 5 μm. Right: Higher magnification shows details of synapses. Scale bar: 2 μm; age of mice: p21. (B) 3D analysis of fluorescently labeled IHC ribbon synapses shows that the number of ribbons (CtBP2/RIBEYE spots, p = 0.9) and the number of ribbon-occupied synapses (number of juxtaposed RIBEYE/CtBP2 and GluA2/3 spots, p = 0.6) per IHC were not altered in RIM-BP2-deficient (RIM-BP2−/−, n = 38, N = 2) IHCs compared to control (RIM-BP2+/+, n = 56, N = 2) IHCs. Data represent grand averages, mean ± SEM; Wilcoxon rank test: significance level: n.s. p ≥ 0.05, n = number of IHCs, N = number of mice.
Figure 3
Figure 3
RIM-BP2 promotes voltage-dependent Ca2+-influx in IHCs. (A) Ca2+ current-voltage relationship of RIM-BP2-deficient (RIM-BP2−/−, n = 16, green) and control (RIM-BP2+/+, n = 17, black) IHCs. Current-voltage relationships (IVs) were calculated from the last 8 ms of currents evoked by step depolarizations to various potentials. Ca2+-current amplitude was significantly reduced in RIM-BP2-deficient IHCs. (B) Fractional activation curves of the whole-cell Ca2+-current: A Boltzmann function was fit to the normalized conductance curve (B) calculated from the Ca2+-current-voltage relationship (A). Average fit data (dashed traces) are displayed for both genotypes (RIM-BP2−/−, n = 16, green and RIM-BP2+/+, n = 17, black). Dashed lines indicate Vhalf and the slope k, reporting the voltage of half-maximal activation of the whole-cell Ca2+-current and the voltage-sensitivity of Ca2+-influx. (C) Ca2+-current, ICa during 200-ms step depolarization to −14 mV of RIM-BP2-deficient (RIM-BP2−/−, n = 11, green) and control (RIM-BP2+/+, n = 15, black) IHCs. Direct comparison of the Ca2+-currents through scaling of the Ca2+-currents showed no difference in the inactivation of the Ca2+-influx. (A–C) Mean ± SEM and statistical p-values are displayed in Table 1. Data information: Data represent IHC grand averages, mean ± SEM; Significance level: *p < 0.05. n = number of IHCs; age of mice: p14-p16.
Figure 4
Figure 4
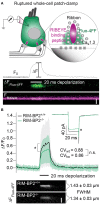
RIM-BP2 promotes the abundance of synaptic Ca2+-channels in IHCs. (A) Top: Illustration of the confocal Ca2+-imaging experimental design. IHCs were loaded with a fluorescently conjugated dimeric RIBEYE-binding peptide (10 μM) to visualize synaptic ribbons at the AZ, and a low affinity Ca2+-indicator Fluo-4FF (400 μM) to monitor synaptic Ca2+-influx. Bottom: Example line scan of a fluorescently labeled ribbon (Fribbon) and Fluo-4FF fluorescence change (ΔFFluo−4FF) at an individual IHC AZ during 20 ms depolarization (black bar) and temporal profile of Fluo-4FF fluorescence at the center of the ribbon. ΔFFluo−4FF from line-scans was normalized to their baseline fluorescence F0 hence ΔF/F0. Scale bar: 2 μm. (B) Top: Average temporal profile of synaptic Ca2+-signals (ΔF/F0) for RIM-BP2+/+ (n = 41, N = 14, black line) and RIM-BP2−/− (n = 42, N = 13, green line) AZs during IHC depolarizations (black bar). ΔF/F0 and its corresponding ICa were significantly reduced in RIM-BP2−/− IHCs (Wilcoxon rank test, both p = 0.01). ΔF/F0 data represent IHC grand averages, mean ± SD (shaded area). The coefficient of variation (CV) represents synapse heterogeneity and was comparable within genotypes (modified Levene's test). Bottom: Representative Ca2+-signals (same intensity-scale) of RIM-BP2+/+ and RIM-BP2−/− AZs showing comparable spatial spread of synaptic Ca2+ influx estimated by a Gaussian fit function (Student's t-test. p = 0.5). Scale bar: 2 μm. Data information: Data represent grand averages, mean ± SEM, unless ΔF/F0 (see above); Significance level: n.s. p ≥ 0.05, *p < 0.05. n = number of AZs, N = number of IHCs; age of mice: p14-16.
Figure 5
Figure 5
RIM-BP2 promotes synaptic Ca2+-channel abundance at IHC ribbon synapses downstream of bassoon. (A,B) XY-sections of individual AZs acquired with high-resolution 2D 2-color STED microscopy. Whole-mount explants of apical RIM-BP2+/+ and RIM-BP2−/− organs of Corti were immunolabeled for CtBP2/RIBEYE (magenta) and CaV1.3 (green, A) or bassoon (green, B). Scale bars: 500 nm. (A) CaV1.3 clusters were subjectively classified in “(double-) stripe-like,” “round” and “complex” apparent shapes. (C) 2D Gaussian functions were fit to each individual STED image of “stripe-shaped” CaV1.3 and bassoon clusters to approximate the cluster dimensions. Fit amplitudes and FWHM of the long and short axis (illustrated) of the Gaussian function were used for quantitative analysis in (D,E). Scale bar: 500 nm. (D,E) Quantitative analysis of CaV1.3 (D) and bassoon (E) cluster STED images described in (C). Data of FWHM long and short axis, the ratio of long over short axis, cluster area and integral are displayed as individual data points (RIM-BP2+/+ in gray, RIM-BP2−/− in green) and grand averages as mean ± SEM (black). (D) RIM-BP2+/+ n = 37, N = 2; RIM-BP2−/− n = 49, N = 2. (E) RIM-BP2+/+ n = 127, N = 2; RIM-BP2−/− n = 124, N = 2; (D,E) Mean ± SEM and statistical p-values are displayed in Table 2. Significance levels: n.s. p ≥ 0.05, *p < 0.05, **p < 0.01, ***p < 0.001; n = number of AZs, N = number of mice; age of mice: p21-p23.
Figure 6
Figure 6
RIM-BP2 promotes sustained exocytosis in IHCs. (A) Left: Relationship of the exocytic membrane capacitance changes (ΔCm, top) and the corresponding whole-cell Ca2+-current integrals (QCa, bottom) of RIM-BP2-deficient (RIM-BP2−/−, n = 10, green) and control (RIM-BP2+/+, n = 12, black) IHCs for various depolarization durations to −14 mV. Ca2+-current integrals were significantly reduced during all depolarization durations (p = 0.01–0.002). Exocytic ΔCm was significantly reduced in RIM-BP2−/− IHCs during 50 (p = 0.0007), 100 (p = 0.002), and 200 ms (p = 0.0007) depolarizations representing the sustained phase of SV release whose rate is governed by vesicle resupply to the RRP. A line was fit to the sustained phase of exocytosis to each individual IHC (from 50 to 200 ms, dashed line) to estimate the kinetics of vesicle turnover during ongoing stimulation. Right: IHC grand average (mean ± SEM) of line fit slopes as estimates for SV turnover rates. A significant reduction (Wilcoxon rank test, p = 0.001) was observed in RIM-BP2−/− IHCs (n = 10, green) compared to control RIM-BP2+/+ (n = 12, black) IHCs. (B) The ratio the exocytic ΔCm and its corresponding integrated Ca2+-current (QCa) showed a significant difference between the two genotypes for the sustained phase of exocytosis (50–200 ms, p = 0.01–0.003), but not for RRP exocytosis (20 ms, p = 0.9). After the extracellular [Ca2+]e was elevated from 2 to 5 mM in RIM-BP2−/− (n = 7) IHCs the ratio between ΔCm and QCa was indistinguishable from RIM-BP2+/+ levels (p = 0.4–0.9). (A,B) Data information: Data represent IHC grand averages, mean ± SEM; Student's t-test unless specified differently (see above), Significance levels: n.s. p ≥ 0.05, *p < 0.05, **p < 0.01, ***p < 0.001; n = number of IHCs; age of mice: p14-p16.
Figure 7
Figure 7
RIM-BP2 disruption did not affect Ca2+-influx—exocytosis coupling. Double-logarithmic plot of exocytic membrane capacitance changes (ΔCm) and corresponding whole-cell Ca2+-current integrals (QCa) during 20 ms depolarizations and perfusion of IHCs with isradipine to gradually decrease the Ca2+-influx exocytosis. Symbols represent individual data points from RIM-BP2-deficient (RIM-BP2−/−, n = 7, each 20–43 data points, green) and control (RIM-BP2+/+, n = 6, each 20–42 data points, black) IHC depolarizations. Solid lines represent best fit power function [ΔCm = A(QCa)m] to all data points of each genotype. The estimates of the apparent Ca2+-cooperativity m for each individual cell were statistically indistinguishable (p = 0.5) between genotypes indicating normal Ca2+-influx—exocytosis coupling; Data information: Student's t-test, n = number of IHCs; age of mice: p14-p16.
Figure 8
Figure 8
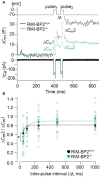
RIM-BP2 facilitates fast recruitment of SVs after RRP-depletion. (A) A paired-pulse protocol was used to measure SV replenishment after RRP-depletion. Average exocytic membrane capacitance traces (Cm, middle) and corresponding Ca2+-currents (ICa, bottom) of RIM-BP2−/− (n = 18, green) and control (RIM-BP2+/+, n = 14, black) IHCs in response to a pair of 20 ms depolarizations separated by an inter-pulse interval (Δt) of 50 ms (top). SV replenishment was measured as the paired-pulse ratio between the second and the first exocytic membrane capacitance changes (ΔCm2/ΔCm1). (B) Paired-pulse ratios (ΔCm2/ΔCm1) at varying inter-pulse intervals (Δt) of RIM-BP2-deficient (RIM-BP2−/−, n = 18, green) and control (RIM-BP2+/+, n = 14, black) IHCs were significantly reduced in RIM-BP2−/− IHCs for RRP recovery times of 50 ms (p = 0.02). For longer RRP recovery times (>50 ms) RRP replenishment seemed normal in RIM-BP2-deficient IHCs (p = 0.1–0.8). The time course of RRP recovery was estimated by fitting the paired-pulse data with a single exponential fit function (dashed lines). τ was significantly slower in RIM-BP2−/− IHCs (RIM-BP2−/−, n = 5, green) compared to control (RIM-BP2+/+, n = 5, black) IHCs (p = 0.04). Data represent IHC averages (empty circles) and IHC grand averages, mean ± SEM (filled circles); Student's t-test: *p < 0.05. (A,B) n = number of IHCs; age of mice: p14-p16.
Figure 9
Figure 9
RIM-BP2 regulates the distance of SVs to the presynaptic membrane. (A) Exemplary virtual sections of RIM-BP2−/− and RIM-B2+/+ ribbon synapses (Top) and side and top view of respective 3D models (Bottom). The overall synapse ultrastructure in RIM-BP2−/− IHCs was normal: Synaptic ribbons (red) were anchored to the presynaptic membrane (blue) via a presynaptic density (PD, pink). SVs that were located within a 100 nm distance from the PD and with a membrane-to-membrane distance of ≤50 nm away from the presynaptic plasma membrane were classified as “membrane proximal” SVs (MP-SVs, yellow). SVs that appeared within 80 nm around the presynaptic ribbon within the first SV layer around the ribbon were considered as “ribbon associated” SVs (RA-SVs, green). Scale bar: 100 nm (B) Quantitative analysis of electron tomograms: reconstructed ribbon (Student's t-test p = 0.13) and PD area (Wilcoxon rank test p = 0.13) (left) as well as the average number of MP (Student's t-test p = 0.14) and RA (Student's t-test p = 0.76) SVs (right) were unaltered in RIM-BP2−/− AZs (n = 9, N = 2) compared to RIM-BP2+/+ AZs (n = 9, N = 2). Data represent grand averages, mean ± SEM; Significance level: n.s. p ≥ 0.05; n = number of tomograms, N = number of mice; age of mice: p21 (C) shortest (membrane-to-membrane) distance of MP-SVs [from B] to the plasma membrane and presynaptic density. Plot shows distances of individual SVs (open circles) and mean ± SEM (closed circles) in RIM-BP2−/− AZs (n = 9, N = 2) and RIM-BP2+/+ AZs (n = 9, N = 2) with no significant difference regarding the average distance of MP SVs to the membrane (Student's t-test p = 0.8) or the PD (Wilcoxon rank test, p = 0.6). (D) Distribution of MP-SVs (B) regarding their shortest (membrane-to-membrane) distance to the plasma membrane (Top) and the PD (Bottom). Histograms show the number of SVs (bin size 5 nm, right y-axis) with respect to their distance to the plasma membrane (Top) or PD (Bottom). The cumulative density function (solid line) shows the probability of SVs (left y-axis) being located at a specific distance to the membrane (Top) or the PD (Bottom). The Kolmogorov-Smirnov test was used to compare the probability distribution of SVs. Top: A large fraction (70%) of SVs was located within ~25 nm and a small fraction (30%) of SVs was located within ~25–50 nm away from the plasma membrane. A significantly different distribution of SVs was observed for both the large (p = 0.004) and the small (p = 0.02) fractions of MP-SVs. Bottom: No difference in the distribution of SVs was observed with respect to the PD (p = 0.7). Comparing the distribution of SVs from the small and large pool as defined for the plasma membrane distribution, but with respect to the PD, also revealed no difference in the SV distribution with respect to the PD (small fraction: p = 0.6, large fraction p = 0.07). (C,D) Significance levels: n.s. p ≥ 0.05, *p < 0.05, **p < 0.01.
Figure 10
Figure 10
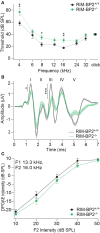
RIM-BP2 disruption caused a mild synaptopathic hearing impairment. (A) Auditory brainstem response (ABR) thresholds were elevated in RIM-BP2-deficient mice compared to control mice especially at 4 (p = 0.005), 8 (p = 0.02), and 16 kHz (p = 0.002). (B) Compared to control mice ABR waveforms (80 dB peak equivalent, 20 Hz stimulation rate) of RIM-BP2-deficient mice elicited a significantly reduced ABR wave I amplitude (p = 0.03), representing the compound action potential of SGNs. (C) At the frequency of strongest hearing threshold increase 16 kHz, see (A), otoacoustic emission amplitudes were unaltered in RIM-BP2-deficient mice compared to control mice indicating normal mechanoelectrical transduction and cochlear amplification (F1: 13.3 kHz, F2: 16 kHz) (p = 0.1–0.9). (A–C) RIM-BP2+/+ (n = 11), RIM-BP2−/− (n = 8); Data information: Data represent grant averages, mean ± SEM; one way ANOVA, p-values are from post hoc Tukey's multiple comparison: *p < 0.05, **p < 0.01, ***p < 0.001; n = number of mice; age of mice: 8–10 weeks.
Figure 11
Figure 11
Higher fraction of fiber with low spontaneous firing rates in single unit recordings from RIM-BP2−/− auditory nerve fibers (A) Distribution of spontaneous firing rates of single units in RIM-BP2+/+ (black; n = 35; N = 6) and RIM-BP2−/− (green; n = 43; N = 3) auditory nerve fibers (ANFs). The histogram represents the distribution of their frequency (left y-axis) and the solid lines represent the cumulative probability density (right y-axis) of spontaneous firing rates. The fraction of ANFs with low spontaneous firing rates was significantly higher in RIM-BP2−/− mice. Wilcoxon rank test, p = 0.04. (B) Representative tuning curves of ANF from RIM-BP2+/+ (black; n = 36; N = 6) and RIM-BP2−/− (green; n = 43; N = 4) mice demonstrate easily distinguishable characteristic frequencies. (B) ANF sound thresholds at their characteristic frequency were comparable between the two genotypes: 41.68 ± 5.03 dB for RIM-BP2+/+ (n = 36; N = 6) and 38.42 ± 3.6 dB for RIM-BP2−/− (n = 43; N = 4). Student's t-test, p = 0.60. Each data point represents the response of single unit of ANF. (A,B) Data information: significance levels: n.s. p ≥ 0.05, *p < 0.05; n = number of single units of ANFs and N = number of mice. Box and whisker plot represents median, lower/upper quartiles and 10th−90th percentiles.
Figure 12
Figure 12
RIM-BP2−/− auditory nerve fibers have reduced onset firing rates, an increased postsynaptic first spike latency and slower recovery. (A) Peak-aligned peri-stimulus time histogram (PSTH) of the response of ANFs to 50 ms tone burst stimulation (at characteristic/best frequency, 30 dB above threshold; stimulus paradigm illustrated in gray) in RIM-BP2+/+ (black; n = 35; N = 6) and RIM-BP2−/− (green; KO n = 43; N = 4). PSTH presented as mean (solid lines) ± SEM (shaded area). Peak onset firing rate was reduced in RIM-BP2−/− ANFs. Student's t-test, p = 0.02. (B) Median first spike latency of PSTH (A) was increased in RIM-BP2−/− ANFs (Student's t-test, p = 0.004) while the variance in first spike latency remained unperturbed. Wilcoxon rank test, p = 0.23. Each data point represents the response of single unit of ANF. (C) The time course of recovery of the ANF was assessed by a 100 ms masker tone followed by 15 ms probe tone presented after a silent interval (recovery time) of variable duration (Δt) (at characteristic/best frequency, 30 dB above threshold; stimulus paradigm illustrated in gray). Recovery was plotted as the ratio of ANF peak response to probe tone to the ANF peak response to masker tone (solid boxes ± SEM). Student's t-test, p = 0.04. Dotted lines represent single exponential fits to the time course of recovery. Time constants (τ) of recovery, displayed on the graph as mean ± SEM were comparable between the two genotypes (Wilcoxon rank test, p = 0.81). RIM-BP2+/+ (black; n = 40; N = 6) and RIM-BP2−/− (green; n = 43; N = 4). (A–C) Data information: Significance levels: n.s. p ≥ 0.05, *p < 0.05, **p < 0.01; n = number of single units of ANFs and N = number of mice. Age of mice: 9–10 weeks. Box and whisker plot represents median, lower/upper quartiles and 10th−90th percentiles.

Similar articles

Cited by

References

    1. Acuna C., Liu X., Gonzalez A., Südhof T. C. (2015). RIM-BPs mediate tight coupling of action potentials to Ca2+-triggered neurotransmitter release. Neuron 87, 1234–1247. 10.1016/j.neuron.2015.08.027 - DOI - PubMed
    1. Augustine G. J., Adler E. M., Charlton M. P. (1991). The calcium signal for transmitter secretion from presynaptic nerve terminals. Ann. N. Y. Acad. Sci. 635, 365–381. 10.1111/j.1749-6632.1991.tb36505.x - DOI - PubMed
    1. Brandt A., Khimich D., Moser T. (2005). Few CaV1. 3 channels regulate the exocytosis of a synaptic vesicle at the hair cell ribbon synapse. J. Neurosci. 25:11577. 10.1523/JNEUROSCI.3411-05.2005 - DOI - PMC - PubMed
    1. Buran B. N., Strenzke N., Neef A., Gundelfinger E. D., Moser T., Liberman M. C. (2010). Onset coding is degraded in auditory nerve fibers from mutant mice lacking synaptic ribbons. J. Neurosci. 30, 7587–7597. 10.1523/JNEUROSCI.0389-10.2010 - DOI - PMC - PubMed
    1. Cho S., Li G.-L., von Gersdorff H. (2011). Recovery from short-term depression and facilitation is ultrafast and Ca2+ dependent at auditory hair cell synapses. J. Neurosci. 31, 5682–5692. 10.1523/JNEUROSCI.5453-10.2011 - DOI - PMC - PubMed

LinkOut - more resources