. 2017 Nov 6:8:588.
doi: 10.3389/fneur.2017.00588. eCollection 2017.

Kainic Acid-Induced Post-Status Epilepticus Models of Temporal Lobe Epilepsy with Diverging Seizure Phenotype and Neuropathology

Affiliations

Kainic Acid-Induced Post-Status Epilepticus Models of Temporal Lobe Epilepsy with Diverging Seizure Phenotype and Neuropathology

Daniele Bertoglio et al. Front Neurol. .

Abstract

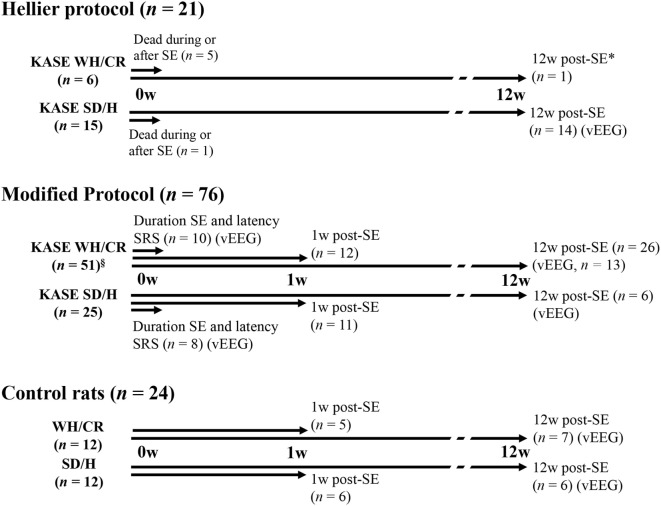
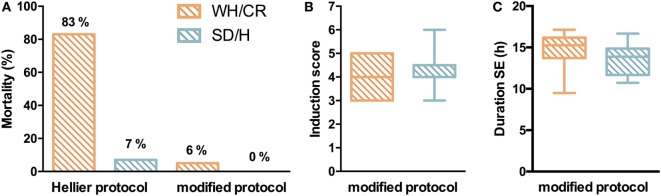
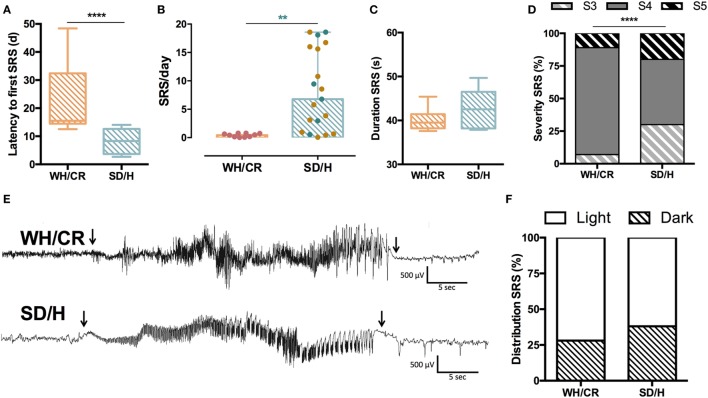
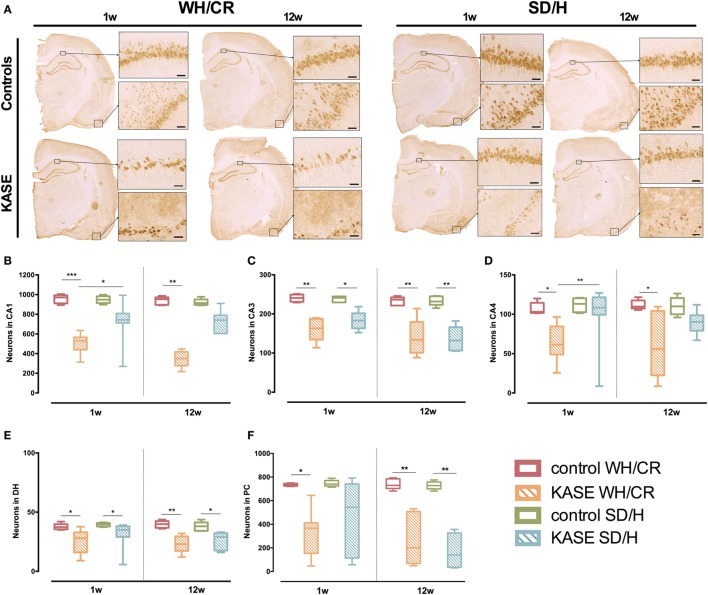
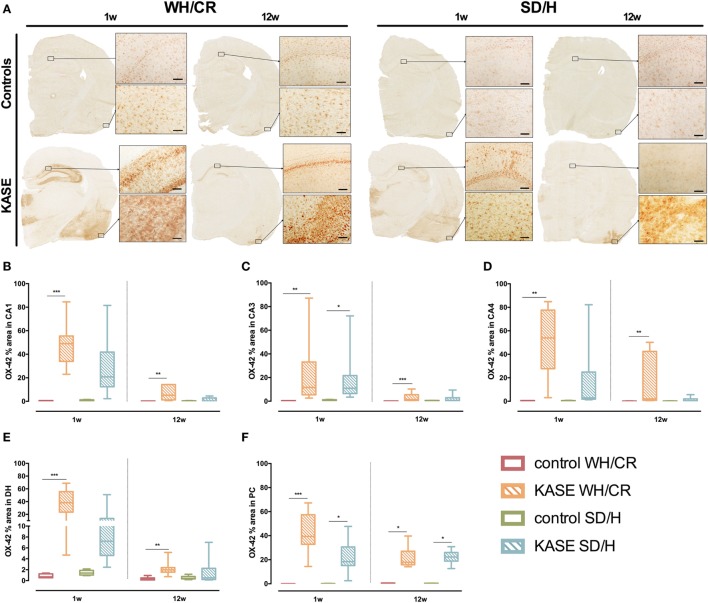
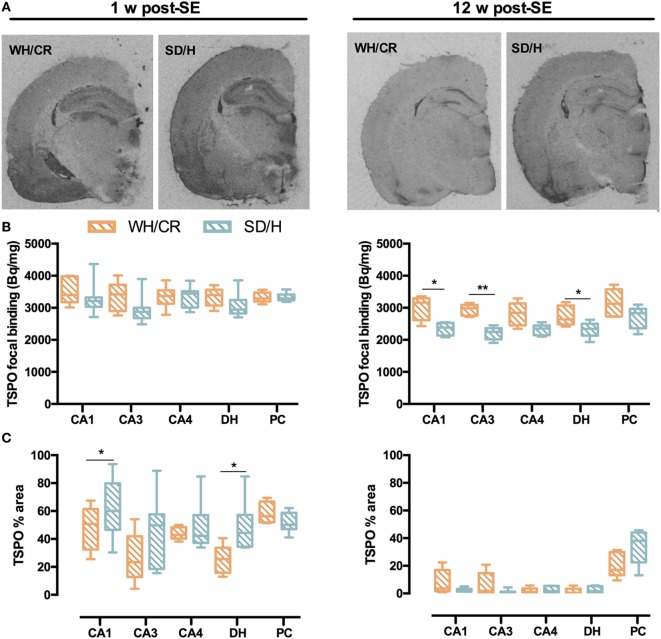
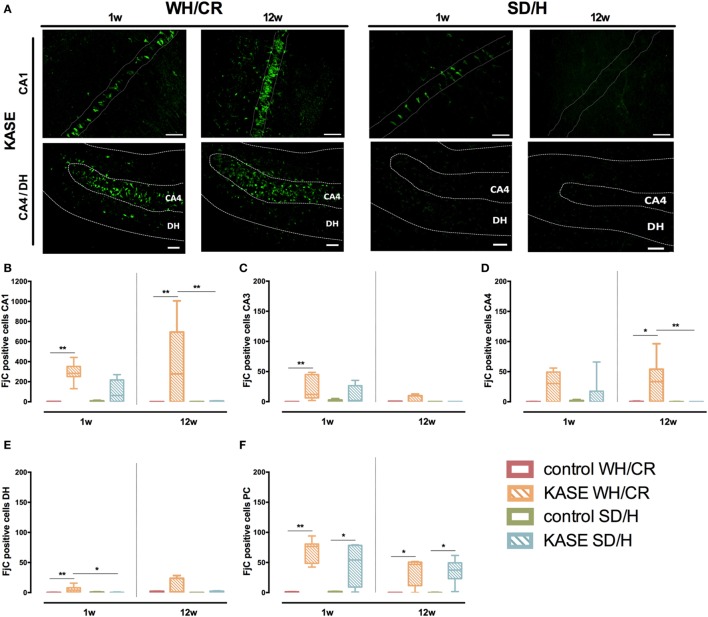
The aim of epilepsy models is to investigate disease ontogenesis and therapeutic interventions in a consistent and prospective manner. The kainic acid-induced status epilepticus (KASE) rat model is a widely used, well-validated model for temporal lobe epilepsy (TLE). As we noted significant variability within the model between labs potentially related to the rat strain used, we aimed to describe two variants of this model with diverging seizure phenotype and neuropathology. In addition, we evaluated two different protocols to induce status epilepticus (SE). Wistar Han (Charles River, France) and Sprague-Dawley (Harlan, The Netherlands) rats were subjected to KASE using the Hellier kainic acid (KA) and a modified injection scheme. Duration of SE and latent phase were characterized by video-electroencephalography (vEEG) in a subgroup of animals, while animals were sacrificed 1 week (subacute phase) and 12 weeks (chronic phase) post-SE. In the 12 weeks post-SE groups, seizures were monitored with vEEG. Neuronal loss (neuronal nuclei), microglial activation (OX-42 and translocator protein), and neurodegeneration (Fluorojade C) were assessed. First, the Hellier protocol caused very high mortality in WH/CR rats compared to SD/H animals. The modified protocol resulted in a similar SE severity for WH/CR and SD/H rats, but effectively improved survival rates. The latent phase was significantly shorter (p < 0.0001) in SD/H (median 8.3 days) animals compared to WH/CR (median 15.4 days). During the chronic phase, SD/H rats had more seizures/day compared to WH/CR animals (p < 0.01). However, neuronal degeneration and cell loss were overall more extensive in WH/CR than in SD/H rats; microglia activation was similar between the two strains 1 week post-SE, but higher in WH/CR rats 12 weeks post-SE. These neuropathological differences may be more related to the distinct neurotoxic effects of KA in the two rat strains than being the outcome of seizure burden itself. The divergences in disease progression and seizure outcome, in addition to the histopathological dissimilarities, further substantiate the existence of strain differences for the KASE rat model of TLE.

Keywords: epilepsy model; epileptogenesis; spontaneous recurrent seizures; status epilepticus; strain; translocator protein.


Figures

Figure 1
Figure 1
Schematic diagram illustrating the experimental design, the number of animals used for each SE induction protocol, and strain. Three animal groups were included in the study: a group of animals (duration SE and latency SRS) was vEEG monitored to determine the duration of SE and the latency to the first SRS (modified protocol: KASE WH/CR, n = 10; KASE SD/H, n = 8). A second group of animals (1 w post-SE) was sacrificed at subacute phase for postmortem analysis (modified protocol: KASE WH/CR, n = 12; KASE SD/H, n = 11; control rats: WH/CR, n = 5; SD/H, n = 6). Finally, a third group of animals (12 w post-SE) was vEEG monitored during chronic epilepsy and sacrificed for postmortem analysis (Hellier protocol: KASE SD/H, n = 14, only vEEG; modified protocol: KASE WH/CR, n = 26; SD/H, n = 6; control rats: WH/CR, n = 7; SD/H, n = 6). vEEG indicates animal that underwent vEEG monitoring. * was not included for further vEEG analysis or postmortem evaluation. §Three WH/CR died during SE. vEEG indicates animals underwent electrode implantation and were vEEG monitored. SE, status epilepticus; w, weeks; KASE, kainic acid-induced status epilepticus; WH/CR, Wistar Han/Charles River; SD/H, Sprague-Dawley/Harlan; n, number; vEEG, video-electroencephalography; SRS, spontaneous recurrent seizures.
Figure 2
Figure 2
Status epilepticus (SE) in KASE WH/CR and KASE SD/H rats. (A) Mortality rates for both rat strains during SE induction. (B) Severity of the SE between the two strains during the modified protocol. Hellier protocol: WH/CR n = 6 and SD/H n = 15; modified protocol: WH/CR n = 51 and SD/H n = 25 (A,B). (C) Duration of SE in WH/CR (n = 10) and SD/H (n = 8) during the modified protocol. WH/CR, Wistar Han/Charles River; SD/H, Sprague-Dawley/Harlan; KASE, kainic acid-induced status epilepticus.
Figure 3
Figure 3
SRS characterization in kainic acid-induced SE (KASE) WH/CR and KASE SD/H rats. (A) WH/CR rats (n = 10) showed a significant longer latency to the first SRS when compared to SD/H (n = 8). Mann–Whitney U test. ****p < 0.0001. (B) SRS frequency during the chronic period. A significant higher number of SRS per day was demonstrated for the SD/H rats compared to the WH/CR rats 12 weeks post-status epilepticus (SE). Red and blue dots represent WH/CR and SD/H, respectively, following modified protocol; brown dots represent SD/H following Hellier protocol. Mann–Whitney U test. **p < 0.01 after considering only animals that underwent modified SE protocol. (C) The duration of SRS was similar in both strains. (D) WH/CR and SD/H were characterized by different distribution of SRS. ****p < 0.0001. Fischer’s exact test. (E) Representative spontaneous electrographic seizure (S4) during chronic period (12 weeks post-SE) of a WH/CR and SD/H rat. Arrows indicate the onset and the end of the seizure. (F) The circadian distribution of SRS was similar in both strains with a higher frequency of SRS during the light phase. WH/CR n = 10 and SD/H n = 6 (C,D,F). WH/CR, Wistar Han/Charles River; SD/H, Sprague-Dawley/Harlan; SRS, spontaneous recurrent seizures; d, days. Graph B is reported as mean ± SD.
Figure 4
Figure 4
Neuronal loss in KASE WH/CR and KASE SD/H rats. (A) Representative KASE and control rats 1 and 12 weeks post-status epilepticus (SE). At both time points, a significant difference could be demonstrated for the investigated regions (B–F) between the respective control and KASE WH/CR animals, while for the SD/H animals only in CA3 and DH 1 week post-SE, and CA3, DH, and PC 12 weeks post-SE (C,E,F). In addition, for the CA1 and CA4 sub-regions, significant higher neuronal loss could be demonstrated for the KASE WH/CR animals compared to KASE SD/H rats 1 week post-SE. Kruskal–Wallis test with post hoc Dunn’s test (B–F). 1 week post-SE: control WH/CR n = 5, KASE WH/CR n = 10, control SD/H n = 5 and KASE SD/H n = 9; 12 weeks post-SE: control WH/CR n = 7, KASE WH/CR n = 6, control SD/H n = 6 and KASE SD/H n = 6. Insets were taken at 10× magnification. Scale bar = 50 µm. *p < 0.05, **p < 0.01. WH/CR, Wistar Han/Charles River; SD/H, Sprague-Dawley/Harlan; w, week; CA, cornu ammonis; DH, dentate hilus; PC, piriform cortex; KASE, kainic acid-induced status epilepticus.
Figure 5
Figure 5
Microglial activation in KASE WH/CR and KASE SD/H rats. (A) Representative KASE and control rats 1 and 12 weeks post-status epilepticus (SE). For all investigated regions, a significant difference could be demonstrated between WH/CR controls and KASE rats 1 week post-SE as well as 12 weeks post-SE (B–F). For the SD/H rats, this was only observed for the CA3 sub-region of the hippocampus and PC 1 week post-SE, while only in PC during the chronic period. Kruskal–Wallis test with post hoc Dunn’s test (B–F). *p < 0.05, **p < 0.01, ***p < 0.001. 1 week post-SE: control WH/CR n = 4–5, KASE WH/CR n = 8–10, control SD/H n = 5 and KASE SD/H n = 6; 12 weeks post-SE: control WH/CR n = 5–6, KASE WH/CR n = 7, control SD/H n = 4–6 and KASE SD/H n = 6–8. Insets were taken at 10× magnification. Scale bar = 100 µm. WH/CR, Wistar Han/Charles River; SD/H, Sprague-Dawley/Harlan; w, week; CA, cornu ammonis; DH, dentate hilus; PC, piriform cortex; KASE, kainic acid-induced status epilepticus.
Figure 6
Figure 6
TSPO focal binding and % area in WH/CR and SD/H rats. (A) Representative autoradiograms showing TSPO expression 1 and 12 weeks post-status epilepticus (SE). (B) TSPO focal binding in the subacute phase was similar for the two strains, while in the chronic phase, it was higher for the KASE WH/CR rats for all the brain regions except for the CA4 and PC when compared to KASE SD/H animals. (C) The TSPO% area was significantly increased in the KASE SD/H animals in the CA1 and DH when compared to the KASE WH/CR rats 1 week post-SE. Twelve weeks post-SE no differences could be determined. Mann–Whitney U test (B,C). *p < 0.05, **p < 0.01. KASE WH/CR n = 5–7 and KASE SD/H n = 6. TSPO, translocator protein; WH/CR, Wistar Han/Charles River; SD/H, Sprague-Dawley/Harlan; w, week; CA, cornu ammonis; DH, dentate hilus; PC, piriform cortex; KASE, kainic acid-induced status epilepticus.
Figure 7
Figure 7
Neurodegeneration in KASE WH/CR and KASE SD/H rats. (A) Representative CA1 and CA4/DH images for KASE rats 1 and 12 weeks post-status epilepticus (SE). During both subacute and chronic phases, KASE WH/CR displayed an overall more extensive neurodegeneration than KASE SD/H in the investigated regions (B–F). Kruskal–Wallis test with post hoc Dunn’s test (B–F). *p < 0.05, **p < 0.01. One week post-SE: control WH/CR n = 4–5, KASE WH/CR n = 8–10, control SD/H n = 5 and KASE SD/H n = 6; 12 weeks post-SE: control WH/CR n = 5–6, KASE WH/CR n = 7, control SD/H n = 4–6 and KASE SD/H n = 6. Representative images: CA1 = 40× magnification, CA4/DH = 20× magnification. Scale bar = 50 µm. WH/CR, Wistar Han/Charles River; SD/H, Sprague-Dawley/Harlan; w, week; CA, cornu ammonis; DH, dentate hilus; PC, piriform cortex; KASE, kainic acid-induced status epilepticus.

References

    1. Loscher W. Critical review of current animal models of seizures and epilepsy used in the discovery and development of new antiepileptic drugs. Seizure (2011) 20(5):359–68.10.1016/j.seizure.2011.01.003 - DOI - PubMed
    1. Loscher W, Klitgaard H, Twyman RE, Schmidt D. New avenues for anti-epileptic drug discovery and development. Nat Rev Drug Discov (2013) 12(10):757–76.10.1038/nrd4126 - DOI - PubMed
    1. Levesque M, Avoli M, Bernard C. Animal models of temporal lobe epilepsy following systemic chemoconvulsant administration. J Neurosci Methods (2016) 260:45–52.10.1016/j.jneumeth.2015.03.009 - DOI - PMC - PubMed
    1. Morimoto K, Fahnestock M, Racine RJ. Kindling and status epilepticus models of epilepsy: rewiring the brain. Prog Neurobiol (2004) 73(1):1–60.10.1016/j.pneurobio.2004.03.009 - DOI - PubMed
    1. Grone BP, Baraban SC. Animal models in epilepsy research: legacies and new directions. Nat Neurosci (2015) 18(3):339–43.10.1038/nn.3934 - DOI - PubMed