. 2017 Nov 6:8:1515.
doi: 10.3389/fimmu.2017.01515. eCollection 2017.

PPARgamma Deficiency Counteracts Thymic Senescence

Affiliations

PPARgamma Deficiency Counteracts Thymic Senescence

David Ernszt et al. Front Immunol. .

Abstract

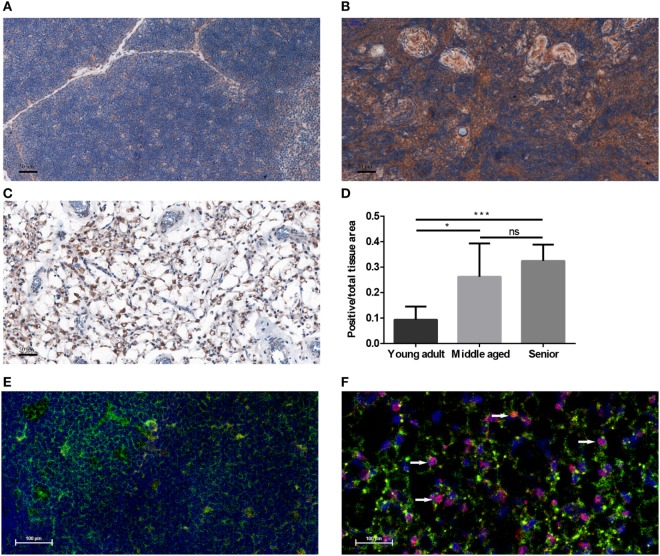
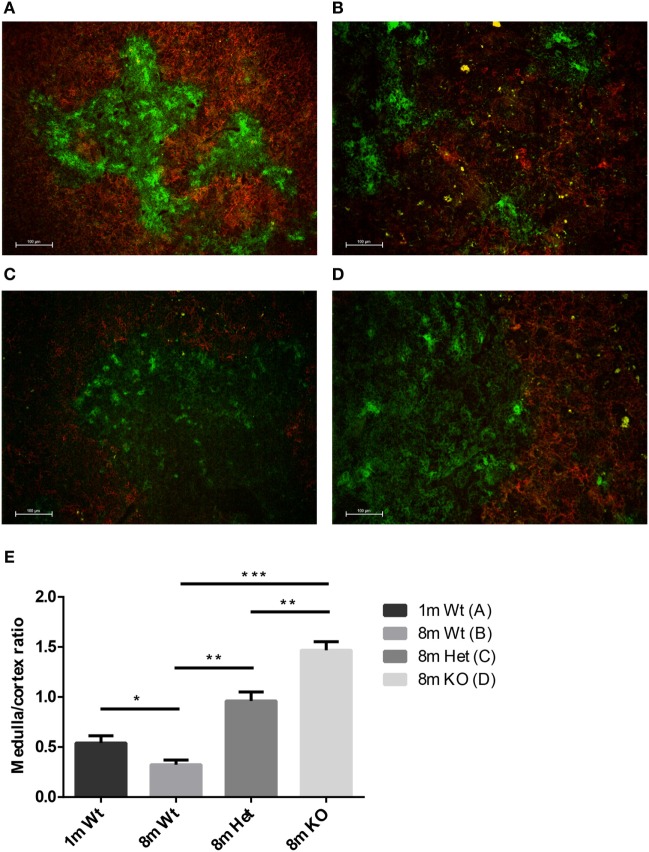
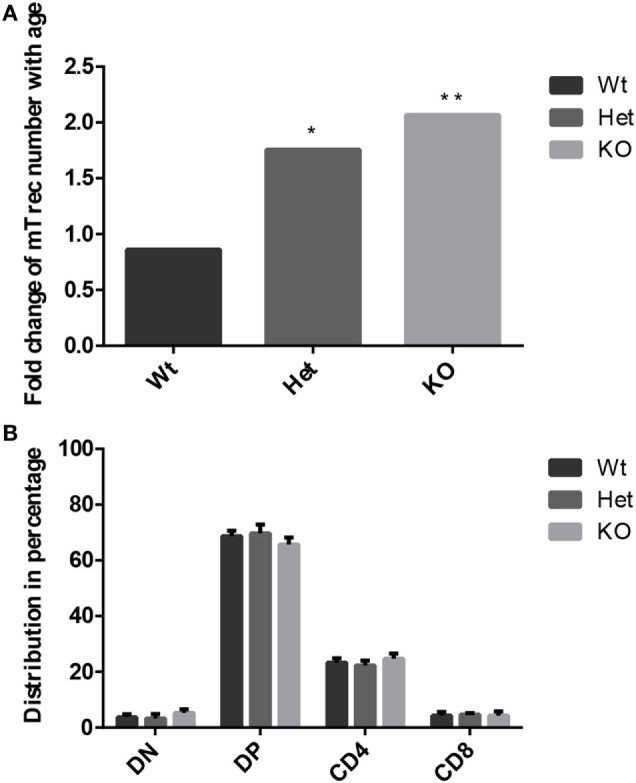
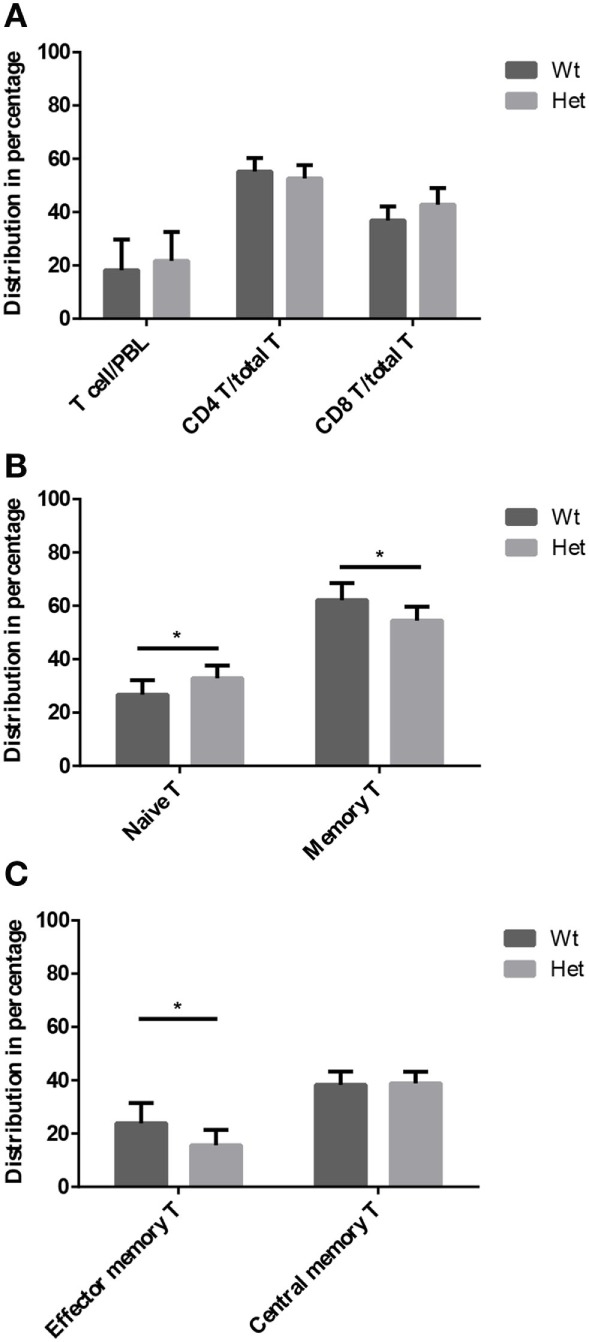
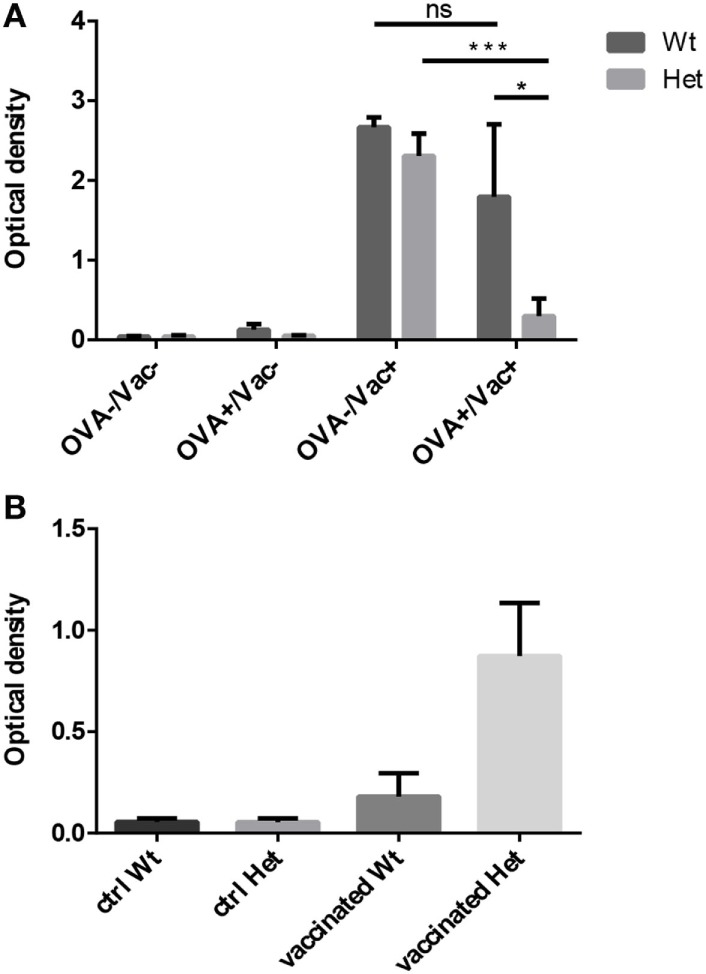
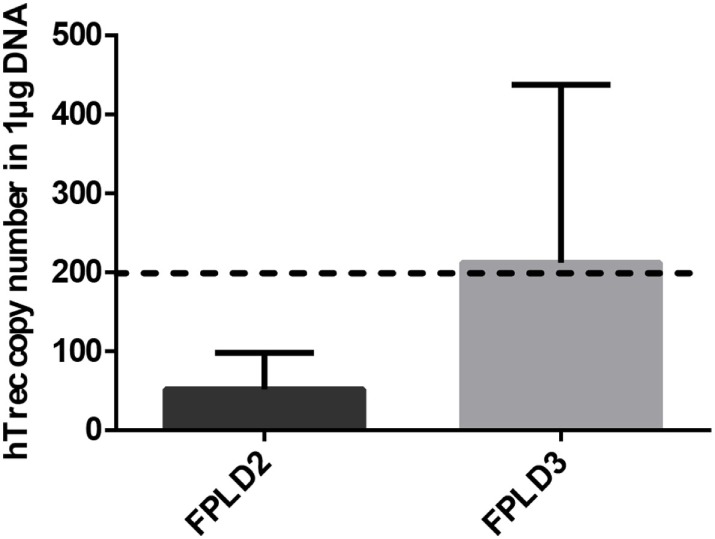
Thymic senescence contributes to increased incidence of infection, cancer and autoimmunity at senior ages. This process manifests as adipose involution. As with other adipose tissues, thymic adipose involution is also controlled by PPARgamma. This is supported by observations reporting that systemic PPARgamma activation accelerates thymic adipose involution. Therefore, we hypothesized that decreased PPARgamma activity could prevent thymic adipose involution, although it may trigger metabolic adverse effects. We have confirmed that both human and murine thymic sections show marked staining for PPARgamma at senior ages. We have also tested the thymic lobes of PPARgamma haplo-insufficient and null mice. Supporting our working hypothesis both adult PPARgamma haplo-insufficient and null mice show delayed thymic senescence by thymus histology, thymocyte mouse T-cell recombination excision circle qPCR and peripheral blood naive T-cell ratio by flow-cytometry. Delayed senescence showed dose-response with respect to PPARgamma deficiency. Functional immune parameters were also evaluated at senior ages in PPARgamma haplo-insufficient mice (null mice do not reach senior ages due to metabolic adverse affects). As expected, sustained and elevated T-cell production conferred oral tolerance and enhanced vaccination efficiency in senior PPARgamma haplo-insufficient, but not in senior wild-type littermates according to ELISA IgG measurements. Of note, humans also show increased oral intolerance issues and decreased protection by vaccines at senior ages. Moreover, PPARgamma haplo-insufficiency also exists in human known as a rare disease (FPLD3) causing metabolic adverse effects, similar to the mouse. When compared to age- and metabolic disorder-matched other patient samples (FPLD2 not affecting PPARgamma activity), FPLD3 patients showed increased human Trec (hTrec) values by qPCR (within healthy human range) suggesting delayed thymic senescence, in accordance with mouse results and supporting our working hypothesis. In summary, our experiments prove that systemic decrease of PPARgamma activity prevents thymic senescence, albeit with metabolic drawbacks. However, thymic tissue-specific PPARgamma antagonism would likely solve the issue.

Keywords: PPARgamma; immunity; rejuvenation; senescence; thymus.


Figures

Figure 1
Figure 1
PPARgamma expression in the adult thymus. Human formalin-fixed, paraffin-embedded (FFPE) thymic sections were analyzed for PPARgamma expression by immunohistochemistry in age groups of 20–30 years called young adult (A), 50–60 years called middle-aged (B), and 70–80 years called senior (C). Brown color reaction (DAB) shows PPARgamma expression. Blue color (hematoxylin) shows nuclear counter-stain and defines total cellular areas. The ratio of PPARgamma-expressing cellular areas and total cellular areas is also shown for the different age groups (D). Immunofluorescent staining is also shown for mouse at 1 month of age called young adult and at 15 months of age called senior (E,F). Green color shows epithelial cells (anti-EpCAM1-FITC), red color shows preadipocytes (anti-PPARgamma primary AB with Alexa-555 secondary AB) and blue color defines nuclei (DAPI counter-stain). Note arrowheads pointing at double-staining (EpCAM-1+/PPARgamma+) cells (F). Both stainings show expected patterns: EpCAM-1 staining presents cell surface markers, while PPARgamma-staining shows nuclear localization (observed in magenta color due to overlap with DAPI nuclear counterstain on Figure 1F). For exact numerical data, refer to Supplementary Material. Significant differences are shown by asterisks (ns for not significant, * for p ≤ 0.05, ** for p ≤ 0.01, *** for p ≤ 0.001).
Figure 2
Figure 2
Ratio of epithelial compartments in the adult thymus. Mouse thymic cryosections were stained differentially for medullary (anti-EpCAM1-FITC++, anti-Ly51-PE) and cortical (anti-Ly51-PE++, anti-EpCAM1-FITC+) epithelial compartments. Wild-type thymus is shown at 1 month (A) and 8 months of age (B). PPARgamma heterozygous (C) and PPARgamma KO (D) animals are shown at 8 months of age. The ratio of medullary and cortical epithelial compartment is also shown (E) for both ages and genetic backgrounds. For exact numerical data, refer to Supplementary Material. Significant differences are shown by asterisks (ns for not significant, * for p ≤ 0.05, ** for p ≤ 0.01, *** for p ≤ 0.001).
Figure 3
Figure 3
Thymocyte development in the adult thymus. Changes in level of mouse T-cell recombination excision circles (mTrecs) was evaluated by Taqman digital qPCR in wild-type, PPARgamma heterozygous, and PPARgamma KO thymocytes (A). The columns represent mTrec values measured at 8 months divided by those measured at 1 month for every strain. The ratio of thymocyte subpopulations was assessed by flow-cytometry at 8 months of age in wild-type, PPARgamma heterozygous and PPARgamma KO animals (B). Double negative (CD4, CD8), double positive (CD4+, CD8+), and single positive (CD4+ or CD8+) subpopulations are shown. For the measurement of every sample, 100,000 cells were stained and 10,000 events (parent R1 morphological lymphocyte gate) were recorded by flow-cytometry. For exact cell numbers, refer to Supplementary Material. Significant differences are shown by asterisks (ns for not significant, * for p ≤ 0.05, ** for p ≤ 0.01, *** for p ≤ 0.001).
Figure 4
Figure 4
T-cell subpopulations in adult peripheral blood. Peripheral blood T-cell subpopulations were evaluated by flow-cytometry at 12 months of age in wild-type and PPARgamma heterozygous animals (KO animals decease by this age). Percent distribution of T-cells (CD3+), helper T-cells (CD3+, CD4+), and cytotoxic T-cells (CD3+, CD8+) is shown by (A). Also, the percent distribution of naive T-cells (CD3+, CD44, CD62L+) and memory T-cells (CD3+, CD44+, CD62L+/−) was evaluated within the CD3-gate of T-cells (B). Further analysis of memory T-cell subpopulation shows percent distribution of effector memory T-cells (CD3+, CD44+, CD62L) and central memory T-cells (CD3+, CD44+, CD62L+) within the CD3-gate of T-cells (C). For the measurement of every sample, 100,000 cells were stained and 10,000 events (parent R1 morphological lymphocyte gate) were recorded by flow-cytometry. For exact cell numbers, refer to Supplementary Material. Significant differences are shown by asterisks (ns for not significant, * for p ≤ 0.05, ** for p ≤ 0.01, *** for p ≤ 0.001).
Figure 5
Figure 5
Functional immunological experiments in adult hosts. Oral tolerance induction capacity to ovalbumin (OVA) was assayed in wild-type and PPARgamma heterozygous animals at 12 months of age. Animals received OVA by either drinking water, i.p. injection, both or neither. OVA-specific IgG titers were evaluated 3 weeks later by ELISA method (A). The presented figure was obtained using 1:400 dilution of serum. Mean ELISA OD values are shown for each study group. Human seasonal influenza vaccine (3Fluart) was injected (0.1 ml, 1×, i.m.) into wild-type and PPARgamma heterozygous animals at 9 months of age. Serum IgG titers specific to a vaccine component (H1N1 A/California/7/2009 strain) were tested 3 months later by ELISA method (B). The presented figure was obtained using 1:50 dilution of serum. Maximal ELISA OD values are shown for each study group. For exact numerical data, refer to Supplementary Material. Significant differences are shown by asterisks (ns for not significant, * for p ≤ 0.05, ** for p ≤ 0.01, *** for p ≤ 0.001).
Figure 6
Figure 6
Thymus function in adult FPLD patients. Level of human T-cell recombination excision circle (hTrec) was measured by Taqman digital qPCR in peripheral blood leukocytes of age-matched and disease-matched rare disease patients with FPLD2 condition (lipodystrophy due to LMNA deficiency) and FPLD3 condition (lipodystrophy due to PPARgamma deficiency) (Figure 6). Patient sample numbers were n = 3 for FPLD2 and n = 5 for FPLD3. For exact numerical data, refer to Supplementary Material. For age-matched (approx. 50 years of age) range of healthy human hTrec values, refer to the work of Lynch et al. (38). Accordingly, the lower limit of healthy human hTrec threshold (approximaterly 200 copies/μg DNA) is represented by dotted line.

Similar articles

Cited by

References

    1. Ammazzalorso A, De Filippis B, Giampietro L, Amoroso R. Blocking the peroxisome proliferator-activated receptor (PPAR): an overview. ChemMedChem (2013) 8(10):1609–16.10.1002/cmdc.201300250 - DOI - PubMed
    1. Montagner A, Rando G, Degueurce G, Leuenberger N, Michalik L, Wahli W. New insights into the role of PPARs. Prostaglandins Leukot Essent Fatty Acids (2011) 85(5):235–43.10.1016/j.plefa.2011.04.016 - DOI - PubMed
    1. Christodoulides C, Vidal-Puig A. PPARs and adipocyte function. Mol Cell Endocrinol (2010) 318(1–2):61–8.10.1016/j.mce.2009.09.014 - DOI - PubMed
    1. Janani C, Ranjitha Kumari BD. PPAR gamma gene – a review. Diabetes Metab Syndr (2015) 9(1):46–50.10.1016/j.dsx.2014.09.015 - DOI - PubMed
    1. Lefterova MI, Haakonsson AK, Lazar MA, Mandrup S. PPARγ and the global map of adipogenesis and beyond. Trends Endocrinol Metab (2014) 25(6):293–302.10.1016/j.tem.2014.04.001 - DOI - PMC - PubMed