. 2017 Oct 27:8:1825.
doi: 10.3389/fpls.2017.01825. eCollection 2017.

Genotypic Variation in Nitrogen Utilization Efficiency of Oilseed Rape (Brassica napus) Under Contrasting N Supply in Pot and Field Experiments

Affiliations

Genotypic Variation in Nitrogen Utilization Efficiency of Oilseed Rape (Brassica napus) Under Contrasting N Supply in Pot and Field Experiments

Huiying He et al. Front Plant Sci. .

Abstract

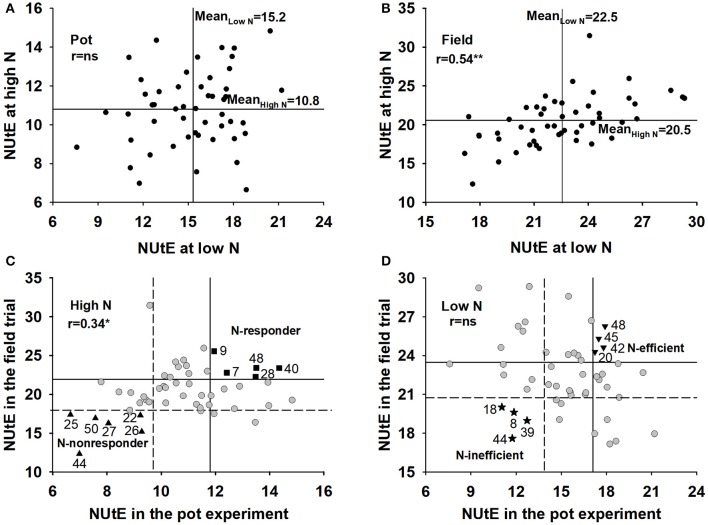
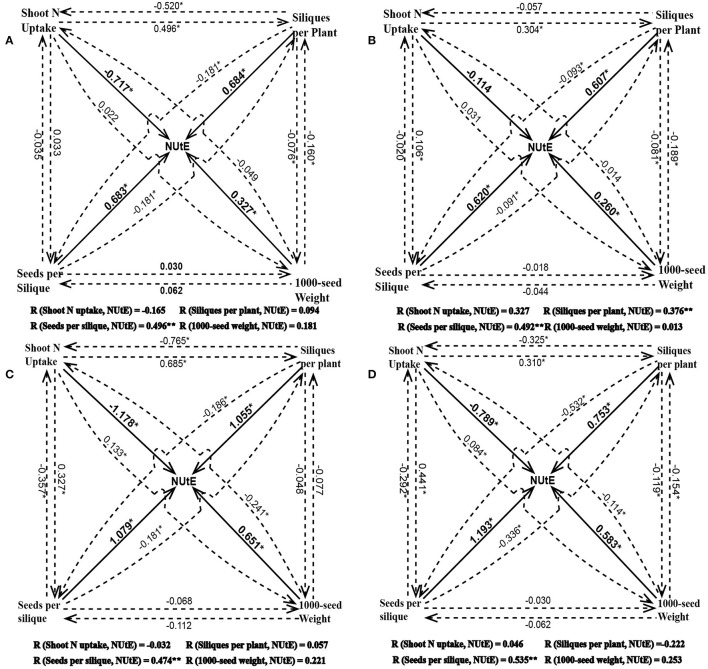
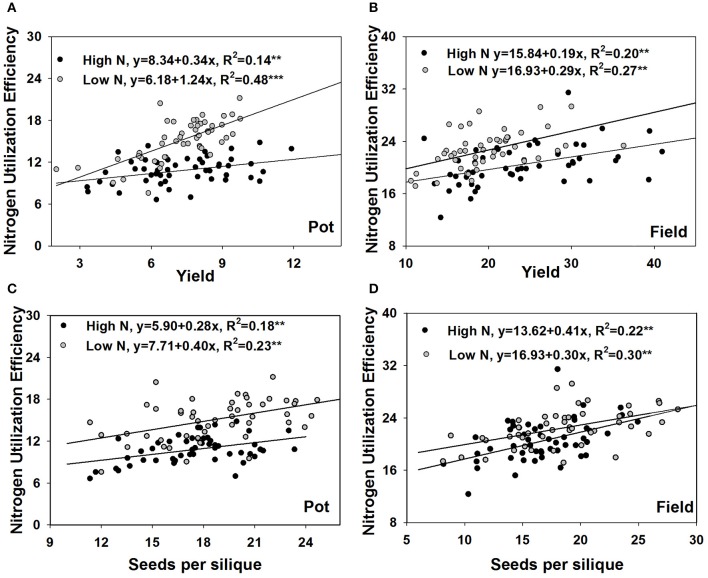
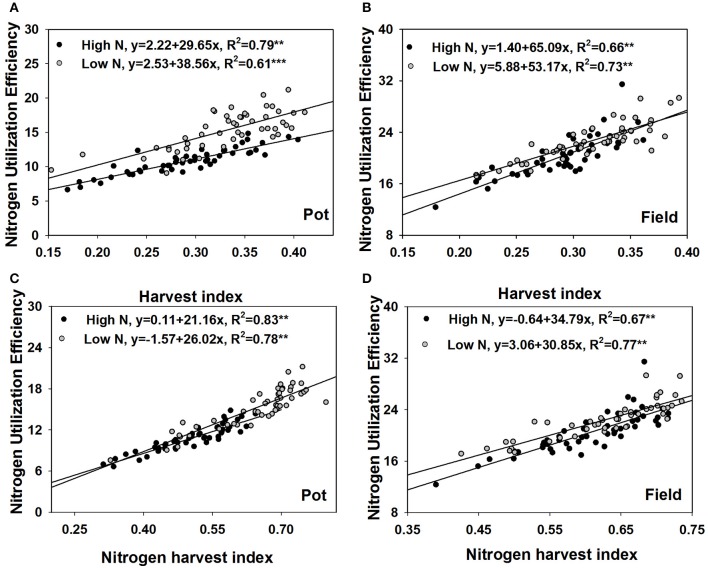
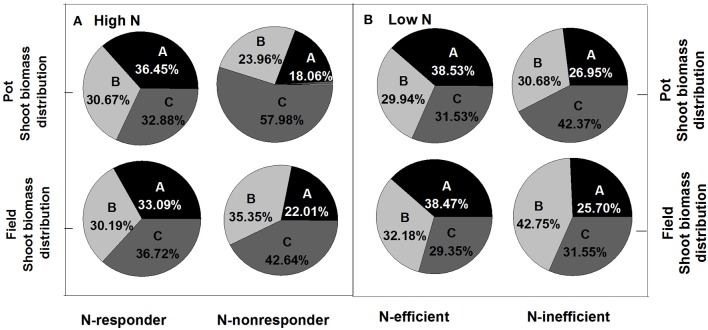
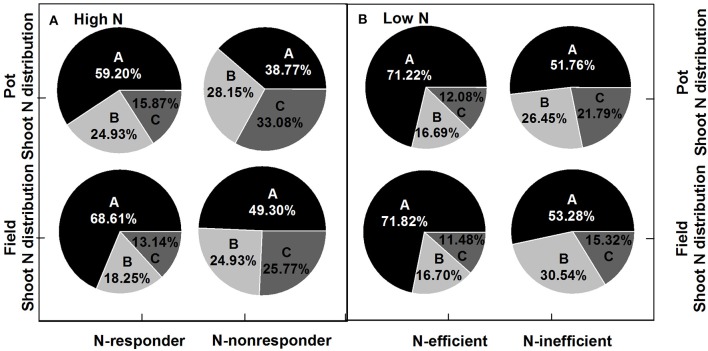
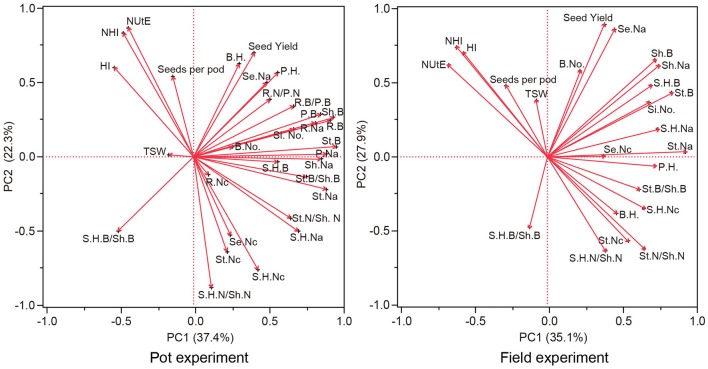
Oilseed rape (Brassica napus) characteristically has high N uptake efficiency and low N utilization efficiency (NUtE, seed yield/shoot N accumulation). Determining the NUtE phenotype of various genotypes in different growth conditions is a way of finding target traits to improve oilseed rape NUtE. The aim of this study was to compare oilseed rape genotypes grown on contrasting N supply rates in pot and field experiments to investigate the genotypic variations of NUtE and to identify indicators of N efficient genotypes. For 50 oilseed rape genotypes, NUtE, dry matter and N partitioning, morphological characteristics, and the yield components were investigated under high and low N supplies in a greenhouse pot experiment and a field trial. Although the genotype rankings of NUtE were different between the pot experiment and the field trial, some genotypes performed consistently in both two environments. N-responder, N-nonresponder, N-efficient and N-inefficient genotypes were identified from these genotypes with consistent NUtE. The correlations between the pot experiment and the field trial in NUtE were only 0.34 at high N supplies and no significant correlations were found at low N supplies. However, Pearson coefficient correlation (r) and principal component analysis showed NUtE had similar genetic correlations with other traits across the pot and field experiment. Among the yield components, only seeds per silique showed strong and positive correlations with NUtE under varying N supply in both experiments (r = 0.47**; 0.49**; 0.47**; 0.54**). At high and low N supply, NUtE was positively correlated with seed yield (r = 0.45**; 0.53**; 0.39**; 0.87**), nitrogen harvest index (NHI, r = 0.68**; 0.82**; 0.99**; 0.89**), and harvest index (HI, r = 0.79**; 0.83**; 0.90**; 0.78**) and negatively correlated with biomass distribution to stem and leaf (r = -0.34**; -0.45**; -0.37**; 0.62**), all aboveground plant section N concentration (r from -0.30* to -0.80**), N distribution to the vegetative parts (silique husk, stem and leaf) (r from -0.40** to -0.83**). N-efficient (N-responder) genotypes produced more seeds per silique and had significantly higher NHI and HI than did N-inefficient (N-nonresponder) genotypes. In conclusion, across the pot and field experiments, the 50 genotypes had similar underlying traits correlated with NUtE and seeds per silique may be a good indicator of NUtE.

Keywords: canola; harvest index; nitrogen harvest index; nitrogen use efficiency; seeds per silique; variety trials.


Figures

Figure 1
Figure 1
Mean NUtE for 50 oilseed rape genotypes under high and low N supply in a the pot experiment (A) and a the field experiment (B), selection for N-responder and N-nonresponder genotypes at high N rates in the pot and field experiments (C) and N-efficient and N-inefficient genotypes at low N rates in the pot and field experiments (D). NUtE intervals at four standard errors of the genotype effect above and below the median are indicated by vertical lines in the pot experiment (C,D) and by horizontal lines in the field experiment (C,D).The horizontal line represents the mean of the genotypes in the pot experiment and the vertical line represents the mean in the field experiment (A,B). r means Pearson Coefficient correlations between x axis and y axis. ns means not significant; *means significant at p < 0.05.
Figure 2
Figure 2
The Path coefficient for NUtE, yield components and shoot N uptake at high N treatment in the pot experiment (A), at low N treatment in the pot experiment (B), at high N treatment in the field trial (C), and at low N treatment in the field trial (D). The solid line represents the direct effect of a given parameter on NUtE and the dotted line represents the indirect effect of the corresponding parameter on NUtE via the other parameters. The value near a vector means effect of trait at the starting point on the trait at the terminal point of the vector (i.e., in A 0.683 is the direct effect value of seeds per silique on NUtE and −0.181 is the indirect effect value of seeds per silique on NUtE through siliques per plant). R is the Pearson coefficient of correlation (the final effect, i.e., 0.496 represents the sum of direct effect of seeds per silique on NUtE and the indirect effect of seeds per silique on NUtE through shoot N uptake, siliques per plant and 1000-seed weight). *represents p < 0.05.
Figure 3
Figure 3
Regression analysis of NUtE with yield in the pot experiment (A) and the field experiment (B), with seeds number per silique in the pot experiment (C) and the field experiment (D).
Figure 4
Figure 4
Regression analysis of NUtE with harvest index in the pot experiment (A) and the field experiment (B), with nitrogen harvest index in the pot experiment (C) and the field experiment (D).
Figure 5
Figure 5
Ratios of plant section to shoot biomass of N-responder and N-nonresponder genotypes under high N rates (A) and N-efficient and N-inefficient genotypes under low N rates (B). A, grain; B, silique husk; C, stem and leaf.
Figure 6
Figure 6
N uptake ratios of plant section to shoot of N-responder and N-nonresponder genotypes at high N rates (A) and of N-efficient and N-inefficient genotypes at low N rates (B). A, grain; B, silique husk; C, stem and leaf.
Figure 7
Figure 7
Component pattern for principal components 1 and 2 for genetic correlations of NUtE, seed yield and components, biomass distribution, N distribution and morphological traits. NUtE, nitrogen utilization efficiency; S.H.B., silique husk biomass; St.B., stem biomass; Sh.B., shoot biomass; R.B., root biomass; P.B., plant biomass; S.H.B/Sh.B, silique husk biomass/shoot biomass; St.B/Sh.B, stem biomass/plant biomass; P.H., plant height; B.H., branch height; B.No., branch number; Si.No., silique number; TSW, 1000-seed weight; Se.Nc., seed N concentration; S.H.Nc, silique husk N concentration; St.Nc, stem N concentration; R.Nc, root N concentration; Se.Na, seed N accumulation; S.H.Na, silique husk N accumulation; St.Na, stem N accumulation; Sh.Na, shoot N accumulation, R.Na, root N accumulation; P.Na, plant N accumulation; HI, harvest index; NHI, nitrogen harvest index; S.H.N/Sh.N, silique husk N/shoot N; St.N/Sh.N, stem N/shoot N.

References

    1. Angadi S. V., Cutforth H. W., McConkey B. G., Gan Y. (2003). Yield adjustment by canola grown at different plant populations under semiarid conditions. Crop. Sci. 43, 1358–1366. 10.2135/cropsci2003.1358 - DOI
    1. Aufhammer W., Kübler E., Bury M. (1994). Nitrogen uptake and nitrogen residuals of winter oil-seed rape and fallout rape. J. Agron. Crop Sci. 172, 255–264.
    1. Avice J. C., Etienne P. (2014). Leaf senescence and nitrogen remobilization efficiency in oilseed rape (Brassica napus L.). J. Exp. Bot. 65, 3813–3824. 10.1093/jxb/eru177 - DOI - PubMed
    1. Balint T., Rengel Z. (2008). Nitrogen efficiency of canola genotypes varies between vegetative stage and grain maturity. Euphytica 164, 421–432. 10.1007/s10681-008-9693-6 - DOI
    1. Bao S. D. (2000). The Soil and Agro-Chemistry Analysis, 3rd Edn. Beijing: Agricultural Press.

LinkOut - more resources