. 2017 Sep 22;8(52):89848-89866.
doi: 10.18632/oncotarget.21163. eCollection 2017 Oct 27.

Rapid, ultra low coverage copy number profiling of cell-free DNA as a precision oncology screening strategy

Affiliations

Rapid, ultra low coverage copy number profiling of cell-free DNA as a precision oncology screening strategy

Daniel H Hovelson et al. Oncotarget. .

Abstract

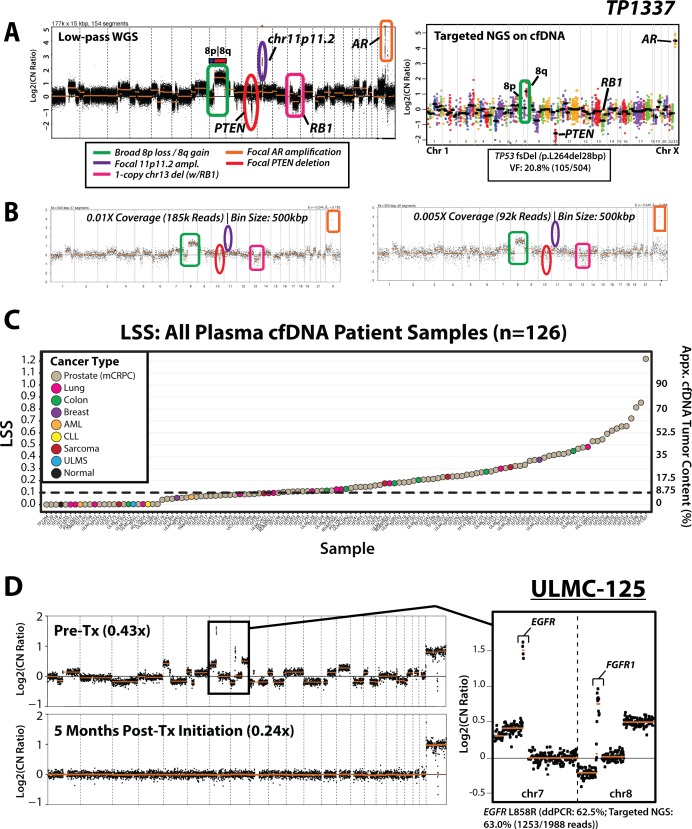
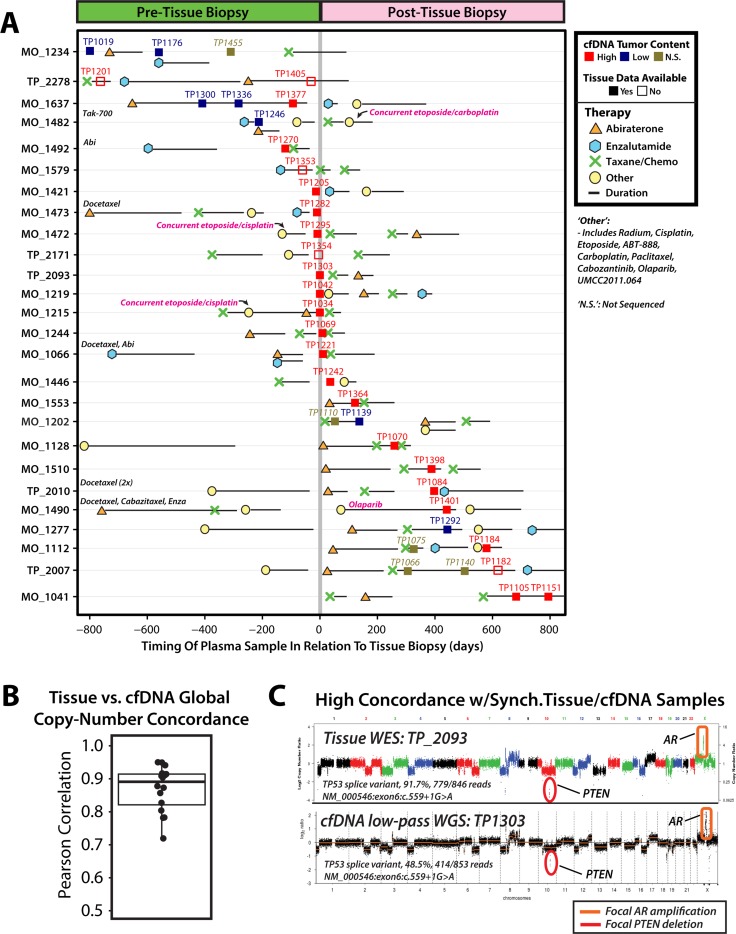
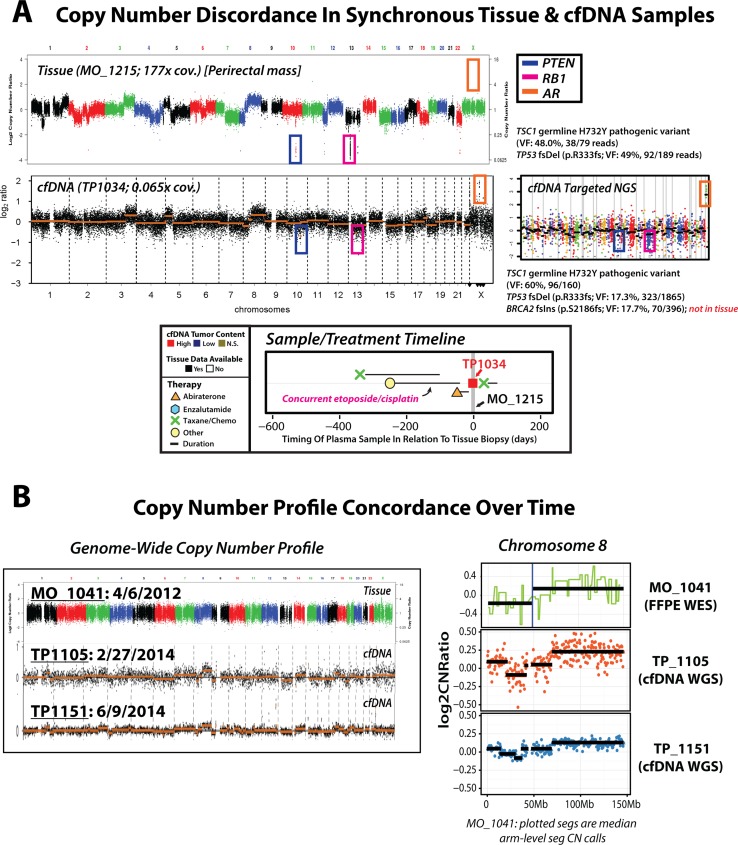
Current cell-free DNA (cfDNA) next generation sequencing (NGS) precision oncology workflows are typically limited to targeted and/or disease-specific applications. In advanced cancer, disease burden and cfDNA tumor content are often elevated, yielding unique precision oncology opportunities. We sought to demonstrate the utility of a pan-cancer, rapid, inexpensive, whole genome NGS of cfDNA approach (PRINCe) as a precision oncology screening strategy via ultra-low coverage (~0.01x) tumor content determination through genome-wide copy number alteration (CNA) profiling. We applied PRINCe to a retrospective cohort of 124 cfDNA samples from 100 patients with advanced cancers, including 76 men with metastatic castration-resistant prostate cancer (mCRPC), enabling cfDNA tumor content approximation and actionable focal CNA detection, while facilitating concordance analyses between cfDNA and tissue-based NGS profiles and assessment of cfDNA alteration associations with mCRPC treatment outcomes. Therapeutically relevant focal CNAs were present in 42 (34%) cfDNA samples, including 36 of 93 (39%) mCRPC patient samples harboring AR amplification. PRINCe identified pre-treatment cfDNA CNA profiles facilitating disease monitoring. Combining PRINCe with routine targeted NGS of cfDNA enabled mutation and CNA assessment with coverages tuned to cfDNA tumor content. In mCRPC, genome-wide PRINCe cfDNA and matched tissue CNA profiles showed high concordance (median Pearson correlation = 0.87), and PRINCe detectable AR amplifications predicted reduced time on therapy, independent of therapy type (Kaplan-Meier log-rank test, chi-square = 24.9, p < 0.0001). Our screening approach enables robust, broadly applicable cfDNA-based precision oncology for patients with advanced cancer through scalable identification of therapeutically relevant CNAs and pre-/post-treatment genomic profiles, enabling cfDNA- or tissue-based precision oncology workflow optimization.

Keywords: cell-free DNA; copy-number analysis; precision oncology; prostate cancer; whole genome sequencing.


Conflict of interest statement

CONFLICTS OF INTEREST C.H., T.T., J.L. and E.K. are current or former employees of Takara Bio USA. D.H.H. has received travel support from Thermo Fisher. S.A.T has received travel support from, and had a sponsored research agreement with Compendia Bioscience/Life Technologies/ThermoFisher that provided access to the targeted sequencing panel used herein. No other aspect of this study was supported by Compendia Bioscience/Life Technologies/ThermoFisher. The University of Michigan has been issued a patent on ETS gene fusions in prostate cancer on which A.M.C. and S.A.T. are co-inventors. The diagnostic field of use has been licensed to Hologic/Gen-Probe, Inc., which has sublicensed rights to Roche/Ventana Medical Systems. S.A.T. has an unrelated sponsored research agreement with Astellas. S.A.T. has served as a consultant for and received honoraria from Roche/Ventana Medical Systems, Almac Diagnostics, Janssen, AbbVie and Astellas/Medivation. S.A.T. is a co-founder of, consultant for and Laboratory Director of Strata Oncology. The other authors have no competing interests to declare.

Figures

Figure 1
Figure 1. Leveraging tumor-derived cfDNA distribution in advanced cancer to develop a pan-cancer, rapid, inexpensive, ultra-low pass whole genome next generation sequencing (NGS) cfDNA precision oncology workflow (PRINCe)
(A) Theoretical cfDNA tumor content distributions and typical next-generation sequencing (NGS) coverage requirements for mutation profiling are presented for early detection (left) and precision oncology in advanced disease (right) applications. In early detection context, the majority of cfDNA samples are expected to have a low proportion of tumor-derived cfDNA fragments (e.g., < 5%), whereas advanced cancers have an elevated proportion of tumor-derived cfDNA. Tumor content requiring ultra-deep, extreme-fidelity (e.g. 10,000x coverage) targeted sequencing are shaded red, while those amenable to targeted sequencing on larger panels or whole-exome/whole-genome (WES/WGS) are shaded blue and green, respectively. (B) Copy number alterations (CNAs) are frequent across human cancers. The fraction of the genome altered (FGA, see Methods) by CNAs in 11,576 The Cancer Genome Atlas (TCGA) samples from 32 solid tumor types is shown across multiple thresholds (overall cohort on left, individual tumor types on right). Increased FGA in a cohort of 129 advanced/metastatic cancers (prostate, kidney, lung and breast cancers) subjected to exome sequencing in the MI-ONCOSEQ program (plotted on the right panel) is seen in comparison to the TCGA cohort, consistent with increasing frequency of CNAs in advanced/metastatic cancers. (C) Schematic for pan-cancer, rapid, inexpensive, ultra-low pass NGS cfDNA workflow (PRINCe). Segmented copy-number calls from ultra-low-pass cfDNA whole-genome sequencing are generated, followed by CNA-clustering based tumor content approximation to inform on precision oncology management. In patients with sufficient tumor content by PRINCe (e.g. > 5–10%), CNA profiles may directly guide treatment (if focal targSupplementary Table alterations are identified), enable routine panel, WGS, or WES based cfDNA NGS tuned to tumor content, as well as establish pre-treatment (tx) CNA profiles for disease (dx) monitoring post-therapy. More costly ultra-deep, extreme fidelity cfDNA and tissue based profiling can thus be reserved for patients with low cfDNA tumor content.
Figure 2
Figure 2. cfDNA tumor content approximation and disease monitoring applications for targeted and ultra-low-pass whole-genome sequencing (WGS) of cell-free DNA from patients with advanced cancer
(A) Genome-wide log2(CopyNumberRatio) (Log2CN) calls for TP1337, a high tumor content cfDNA sample from a patient with mCRPC, are displayed for low-pass WGS data (0.82x whole-genome coverage) and targeted NGS data. Key copy-number alterations (CNA) detected are circled, including broad gain of 8q (green), focal amplification of chr11p11.2 (purple) and AR (orange), and focal RB1 (1-copy; pink) and PTEN (2-copy; red) deletions. Copy number and mutation data from deep coverage targeted NGS data is provided at right from unamplified TP1337 cfDNA (1,102× targeted NGS coverage) using the DNA component of the Oncomine Comprehensive Assay (OCP), a pan cancer NGS panel developed for FFPE tissue samples. For genes with sufficient amplicons for CNA calling, amplicon (dots) and gene (black bars)-level log base 2 copy number ratio (Log2 [CN Ratio]) estimates (compared to a composite reference sample) are plotted. All CNAs seen by low-pass WGS are detected via targeted NGS CNA analysis (chr11p11.2 is not targeted by OCP). A prioritized high confidence somatic 28 bp frameshift deletion in TP53 (p.L264del28bp; variant fraction (VF) = 20.8% (105/504 total sequencing reads)) detected by OCP is shown in the inset box. (B) In silico downsampling experiments highlight the ability to detect both focal and broad copy-number alterations from TP1337 cfDNA WGS data at whole-genome coverages down to 0.005×. Bin size and number of high-quality (MAPQ ≥ 37) mapped reads used for copy-number analysis are indicated at each coverage, and regions affected by copy-number alterations detected in original low-pass WGS are circled. (C) Distribution of cfDNA tumor content estimates (right axis) from least-squares distance metric (LSS) values (left axis) for 124 patient cfDNA samples (123 from patients with advanced cancer, including TP1178 (from a patient with untreated advanced prostate cancer), along with 1 normal control sample (TP1147). All patient samples are colored by cancer type (indicated in the legend). (D) Low-pass WGS copy-number for pre- and post- EGFR inhibitor (erlotonib) treatment plasma cfDNA samples from ULMC-125, a patient with metastatic lung cancer. Multiple whole-chromosome and arm-level gains/losses as well as focal amplifications are present in the pre-treatment cfDNA sample with high tumor content. A zoomed view of chromosomes 7 and 8 show focal EGFR and FGFR1 amplifications in the pre-treatment sample (an activating EGFR L858R mutation was previously detected at 62.5% variant fraction by digital droplet PCR [ddPCR]). Low-pass WGS sequencing of a cfDNA sample taken 5 months post-treatment initiation (bottom) showed no detectable copy-number alterations genome-wide, and no detectable L858R mutation by ddPCR analysis (L858R variant fraction: 0.0%). Low-pass WGS copy-number bin size: 500 kbp; segmentation p-value threshold: 0.01.
Figure 3
Figure 3. Comparison of synchronous and asynchronous tissue and cfDNA biospecimens collected from patients with metastatic castration-resistant prostate cancer (mCRPC) yields highly concordant genome-wide copy number profiles
(A) Treatment and cfDNA sample collection timeline plotted in relation to tissue specimen collection date for 26 men with metastatic castration-resistant prostate cancer (mCRPC) eligible for tissue-based comprehensive whole-exome and whole-transcriptome NGS profiling. Treatment start and cfDNA sample dates are plotted relative to tissue specimen collection date (denoted by solid vertical gray line) for each individual. As indicated in the legend, treatments have been divided into 4 separate categories, including: abiraterone (orange triangle), enzalutamide (blue hexagon), taxane-based chemotherapy (green ‘X’) and other (yellow circle), and treatment duration is indicated by solid black horizontal lines extending rightward from treatment start dates. Therapies categorized as ‘other’ include: radium, cisplatin, etoposide, ABT-888, carboplatin, paclitaxel, cabozantinib, olaparib, and UMCC2011.064. Where appropriate, ‘other’ treatment including etoposide and cisplatin or carboplatin for individuals with prostate cancer containing small cell/neuroendocrine features are noted. As indicated in the legend, samples are colored by LSS-based tumor content approximation with high (LSS > 0.1, red), low (LSS < 0.1, blue), and not sequenced (‘N.S.’, brown). For a subset of men, tissue-based molecular data was not available, as indicated by filled (tissue data available) or unfilled (tissue data not available) squares. Displayed sample dates are restricted to +/− 800 days from date of tissue specimen collection, and therapies administered > 800 days before tissue specimen collection are written at the left-hand side of corresponding individual timelines. (B) Correlations between genome-wide tissue and cfDNA segmented copy-number profiles are plotted for 16 patients with available comprehensive tissue NGS profiling data and PRINCe assessment of ≥ 1 high tumor content cfDNA sample (see Methods). Each point represents the correlation of genome-wide copy number profile for a single cfDNA sample as compared to the patient-matched tissue-based copy-number profile. A box-and-whisker plot behind points indicates the interquartile range (IQR), with the top and bottom of box representing 25th and 75th percentile, respectively, while bold horizontal line within the box represents the median correlation value. Whiskers stretch to 1.5 times the IQR for this sample distribution. (C) Tissue whole exome sequencing (WES) (top; tissue id: TP_2093) and cfDNA low-pass whole genome sequencing (WGS) (bottom; cfDNA id: TP1303) genome-wide copy-number profiles for biospecimens collected on the same day from a patient with mCRPC (TP_2093). Genome-wide copy-number concordance is statistically significant (Pearson correlation coefficient: 0.94, p < 0.001), and focal 2-copy deletion of PTEN and focal high-level AR amplification are cleared detected in both the tissue and cfDNA as indicated. A TP53 splice variant (NM_000546:exon 6:c.559+1G>A) identified via WES tissue profiling (91.7% variant fraction (VF), 846 covering reads) is also detected by cfDNA targeted NGS (48.5% VF, 853 covering reads).
Figure 4
Figure 4. Unique precision oncology considerations identified via serial and synchronous tissue and cfDNA NGS-based profiling in patients with advanced prostate cancer
(A) Genome-wide (tissue and cfDNA) and targeted (cfDNA only) NGS copy number profiles are displayed, along with treatment and sample timeline, for synchronous (same-day) tissue and cfDNA specimens from a patient with metastatic castration-resistant prostate cancer (mCRPC) with a history of both primary prostatic adenocarcinoma and a metastatic lesion with small cell carcinoma/neuroendocrine features. Tissue whole exome sequencing (WES) copy number analysis of a frozen perirectal mass tissue biopsy specimen (top left) revealed focal, deep deletions in both PTEN and RB1, and no AR copy-number alterations, consistent with histological reports of high-grade poorly differentiated carcinoma with neuroendocrine features. Individual dots in tissue WES copy-number profile represent exon-level copy-number estimates displayed in genome order, and dots are colored by corresponding chromosomes. cfDNA low-pass whole genome sequencing (WGS) copy number profiling identified focal deep deletions in PTEN and RB1, as well as high level focal AR amplification, highlighting circulating evidence of both AR-driven and AR-independent clones. Individual dots in cfDNA low-pass WGS plot represent bin-level copy-number estimates displayed in genome order (left to right), with segmented copy-number alterations represented by orange horizontal lines. Both tissue (WES) and cfDNA (targeted NGS; copy-number prfile ) mutation profiling identified a TSC1 germline H732Y pathogenic variant (tissue: 48% variant fraction (VF), 79 covering reads; cfDNA: 60% VF, 160 covering reads) and somatic TP53 frameshift deletion (p.R333fs; tissue: 49% VF, 189 covering reads; cfDNA: 17%, 1865 covering reads), while cfDNA targeted NGS identified a BRCA2 frameshift insertion (p.S2186fs; 18% VF, 396 covering reads) not present in the tissue sample, further supporting detection of multiple clones via cfDNA PRINCe assessment. The cfDNA targeted NGS copy number profile is presented at right, showing confirmation of focal PTEN and RB1 deletions along with high-level focal AR amplification as seen by low-pass WGS. Zoomed view of treatment and sample timeline for this patient is presented at bottom, as previously described (see Figure 3). (B) Genome-wide (left) and chromosome 8 (right) copy number profiles from multiple biospecimens taken over time from a single patient with metastatic castration-resistant prosate cancer (mCRPC) (tissue id: MO_1041; cfDNA ids: TP1105 and TP1151). WES of a formalin fixed paraffin embedded (FFPE) tissue biopsy specimen (top left) revealed low but detectable tumor content, and identified copy-number loss affecting 8p and arm-level gain of 8q (at right). Low-pass WGS of a cfDNA specimen collected almost 2 years after tissue biopsy (TP1105, middle left) revealed elevated cfDNA tumor content with frequent copy-number alterations genome-wide, including copy-number loss affecting chr8p and arm-level gain of chr8q (displayed at right), as detected in initial tissue profiling. A subsequent cfDNA sample (TP1151) again showed detection of elevated cfDNA tumor content and a highly concordant genome-wide copy number profile, with faithful representation of the 8p loss and 8q gain events detected in previous specimens. Overall, these results highlight the consistent representation of early genomic events as inferred from circulating tumor DNA profiled in our cohort.
Figure 5
Figure 5. Exploratory analyses of association between circulating biomarkers and outcome in patients with metastatic castration-resistant prostate cancer (mCRPC) supports cfDNA detectable AR amplification as a poor overall prognostic factor independent of treatment type
(A) Waterfall plot summarizing prostate specific antibody (PSA) response for all samples from men with mCRPC with complete PSA data (n = 90). Height of bars represent the percentage change in PSA response as calculated by subtracting the PSA level at sample date from the best PSA observed after sample date while on the current or initiated treatment, and dividing by starting PSA value. Bars are ordered horizontally within treatment category (Abi/Enza, Taxane, or Other) by PSA response. Bars are colored by cfDNA detectable AR amplification status (yellow = cfDNA detectable AR amplification; gray = no cfDNA detectable AR amplification) and bars corresponding to samples taken from men who have received more than one line of therapy post-ADT are outlined in bold. (BE) Kaplan-Meier survival curves are plotted for analyses exploring association between cfDNA detectable AR amplification (B, D) or cfDNA tumor content (C, E) and total time on therapy in both unstratified (B-C) and stratified (D-E; by treatment type) analyses of our mCRPC cohort. Unstratified analysis of single cfDNA samples from men on or starting taxane-based chemotherapy or second-generation anti-androgens abiraterone or enzalutamide (n = 57 men) highlight significant differences in time on therapy for both (B) cfDNA detectable AR amplification (Kaplan-Meier log-rank test, chi-square = 15.3, p < 0.0001) and (C) elevated cfDNA tumor content (Kaplan-Meier log-rank test, chi-square = 8.2, p < 0.0042). Analyses stratified by treatment (starting or on taxane vs. abiraterone/enzalutamide) show (D) cfDNA detectable AR amplification (yes/no) (Kaplan-Meier log-rank test, chi-square = 21.9, p < 0.0001) and (E) cfDNA tumor content (Kaplan-Meier log-rank test, chi-square = 18.9, p = 0.0003) again demonstrate significant differences in time on therapy. Survival curves are colored by corresponding strata, and risk tables at selected timepoints are displayed below each Kaplan-Meier plot.

References

    1. Roychowdhury S, Chinnaiyan AM. Translating cancer genomes and transcriptomes for precision oncology. CA Cancer J Clin. 2016;66:75–88. https://doi.org/10.3322/caac.21329. - DOI - PMC - PubMed
    1. Hyman DM, Solit DB, Arcila ME, Cheng DT, Sabbatini P, Baselga J, Berger MF, Ladanyi M. Precision medicine at Memorial Sloan Kettering Cancer Center: clinical next-generation sequencing enabling next-generation targeted therapy trials. Drug Discov Today. 2015;20:1422–8. https://doi.org/10.1016/j.drudis.2015.08.005. - DOI - PMC - PubMed
    1. Cheng DT, Mitchell TN, Zehir A, Shah RH, Benayed R, Syed A, Chandramohan R, Liu ZY, Won HH, Scott SN, Brannon AR, O’Reilly C, Sadowska J, et al. Memorial Sloan Kettering-Integrated Mutation Profiling of Actionable Cancer Targets (MSK-IMPACT): A Hybridization Capture-Based Next-Generation Sequencing Clinical Assay for Solid Tumor Molecular Oncology. J Mol Diagn. 2015;17:251–64. https://doi.org/10.1016/j.jmoldx.2014.12.006. - DOI - PMC - PubMed
    1. Hovelson DH, McDaniel AS, Cani AK, Johnson B, Rhodes K, Williams PD, Bandla S, Bien G, Choppa P, Hyland F, Gottimukkala R, Liu G, Manivannan M, et al. Development and validation of a scalable next-generation sequencing system for assessing relevant somatic variants in solid tumors. Neoplasia. 2015;17:385–99. https://doi.org/10.1016/j.neo.2015.03.004. - DOI - PMC - PubMed
    1. Grasso C, Butler T, Rhodes K, Quist M, Neff TL, Moore S, Tomlins SA, Reinig E, Beadling C, Andersen M, Corless CL. Assessing copy number alterations in targeted, amplicon-based next-generation sequencing data. J Mol Diagn. 2015;17:53–63. https://doi.org/10.1016/j.jmoldx.2014.09.008. - DOI - PMC - PubMed