. 2017 Nov 1;8(11):7510-7520.
doi: 10.1039/c7sc03514d. Epub 2017 Sep 12.

Laboratory-scale photoredox catalysis using hydrated electrons sustainably generated with a single green laser

Affiliations

Laboratory-scale photoredox catalysis using hydrated electrons sustainably generated with a single green laser

Robert Naumann et al. Chem Sci. .

Abstract

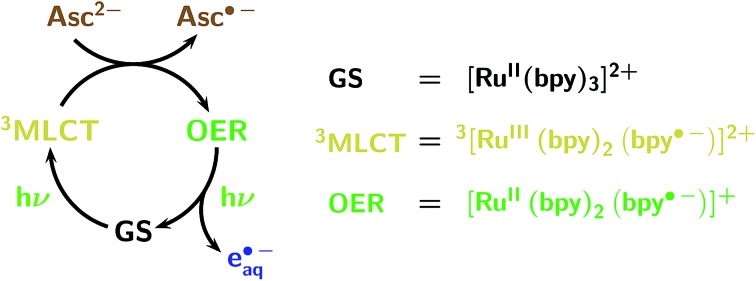
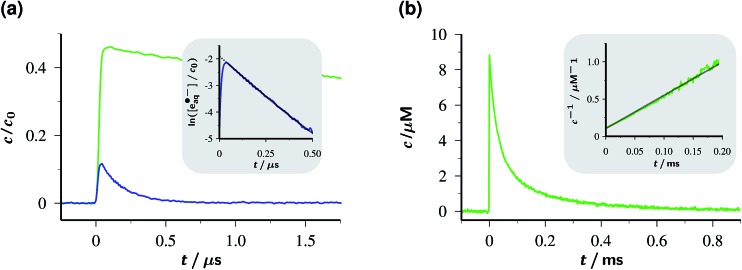
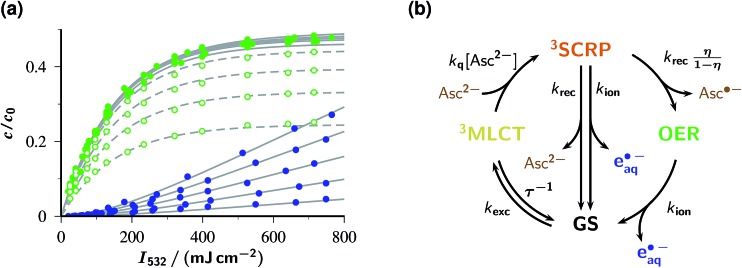
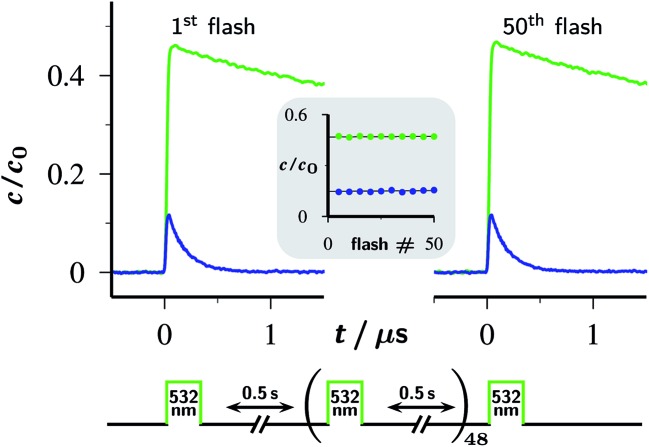
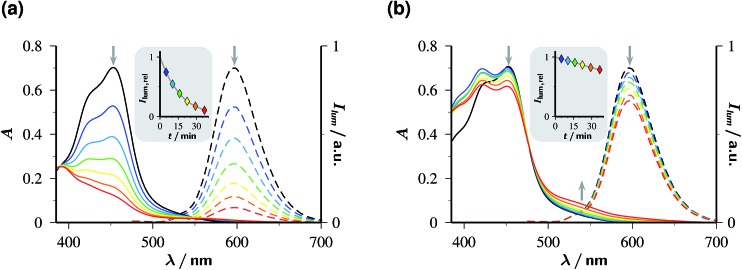
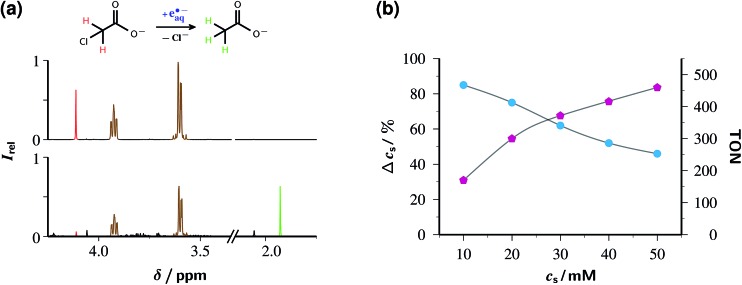
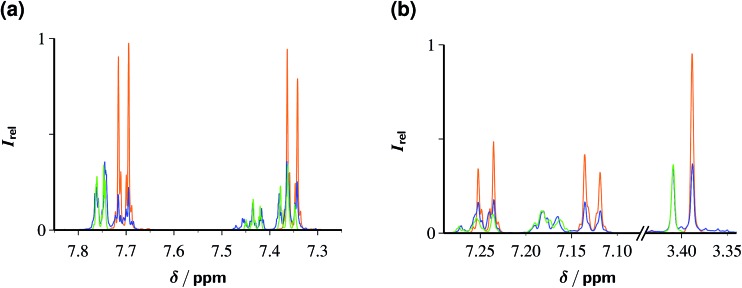
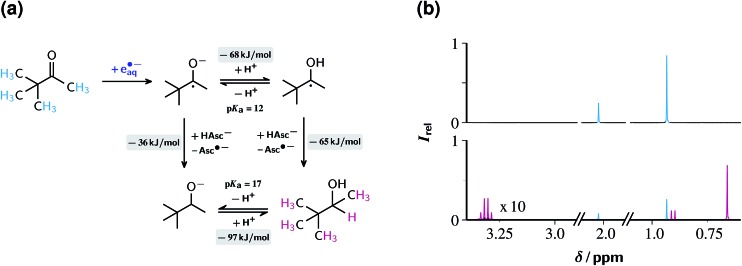
The ruthenium-tris-bipyridyl dication as catalyst combined with the ascorbate dianion as bioavailable sacrificial donor provides the first regenerative source of hydrated electrons for chemical syntheses on millimolar scales. This electron generator is operated simply by illumination with a frequency-doubled Nd:YAG laser (532 nm) running at its normal repetition rate. Much more detailed information than by product studies alone was obtained by photokinetical characterization from submicroseconds (time-resolved laser flash photolysis) up to one hour (preparative photolysis). The experiments on short timescales established a reaction mechanism more complex than previously thought, and proved the catalytic action by unchanged concentration traces of the key transients over a number of flashes so large that the accumulated electron total surpassed the catalyst concentration many times. Preparative photolyses revealed that the sacrificial donor greatly enhances the catalyst stability through quenching the initial metal-to-ligand charge-transfer state before destructive dd states can be populated from it, such that the efficiency of this electron generator is no longer limited by catalyst decomposition but by electron scavenging by the accumulating oxidation products of the ascorbate. Applications covered dechlorinations of selected aliphatic and aromatic chlorides and the reduction of a model ketone. All these substrates are impervious to photoredox catalysts exhibiting lower reducing power than the hydrated electron, but the combination of an extremely negative standard potential and a long unquenched life allowed turnover numbers up to 1400 with our method.


Figures

Fig. 1
Fig. 1. Cyclic mechanism (acceptor cycle) of the green-light (532 nm) ionization of Rubpy, as established by two-pulse laser flash photolysis. The colour code of this figure is used throughout this work for the Rubpy-derived species (ground state GS, metal-to-ligand charge-transfer excited state 3MLCT, one-electron reduced form OER; formulas included at the right of the mechanism), the hydrated electron eaq˙, and the ascorbate dianion Asc2– serving as sacrificial donor.
Fig. 2
Fig. 2. Decay traces of the key species OER and eaq˙ in the Rubpy/Asc2– catalytic system. Graph (a), OER (top) and eaq˙ (bottom) concentrations c relative to the starting Rubpy concentration c 0 for the standard composition of the system in this work (c 0, 50 µM; 50 mM sodium ascorbate in 100 mM NaOH, pH 12.65) on a µs timescale following a single green pulse of intensity 760 mJ cm–2. Inset, log-linear plot of the eaq˙ trace demonstrating the first-order decay over 3.5 half lifes and the back-extrapolation (dotted part of the gray fit curve) to obtain the true eaq˙ concentration immediately after the flash despite the rounding of the tip (see, main plot) by the fast decay. Graph (b), second-order OER decay on a ms timescale, with the usual linearization over the first 2.5 half lifes as the inset. Same concentrations as in (a); laser intensity, 94 mJ cm–2. For further explanation, see text.
Fig. 3
Fig. 3. Response of the catalytic system to the laser intensity and the concentration of the sacrificial donor. Graph (a), initial post-flash concentrations c relative to the starting Rubpy concentration c 0 (50 µM) for OER (green) and eaq˙ (blue) as functions of the intensity I 532 of a single green laser flash with the Asc2– concentration as parameter. The gray curves represent a global fit for the kinetic scheme shown in (b); best-fit parameters with the effective laser pulse duration T and with the intensities I 532 specified in mJ cm–2, k exc T = 6.6 × 10⁻³ I 532, T/τ = 1.7 × 10⁻², k q T = 42 M–1, k rec T = 0.94, η = 0.48, k ion T = 6.0 × 10⁻⁴ I 532. The ascorbate weight-in concentrations, in ascending order of the curves for each observed species, are 0.5 mM, 1 mM, 2 mM, 5 mM (open symbols and dashed curves, OER only; for clarity, the data and fit curves for eaq˙ have been omitted) and 10 mM, 20 mM, 50 mM, 100 mM, 250 mM (filled symbols and solid curves). Experimental temperature, 303 K. Graph (b), enhanced kinetic model used for the global fit, with 3SCRP being the spin-correlated radical pair . For further explanation, see text.
Fig. 4
Fig. 4. Fifty-fold repetition of the experiment of Fig. 2a with the timing diagram (duration of the laser flashes not drawn to scale) shown below the plotted first and last set of concentration traces for OER (upper trace, green) and eaq˙ (lower trace, blue). The inset displays the concentrations of these two species immediately after each fifth flash as functions of the flash number, using the same colour code as in the traces. Experimental conditions are given in the caption of Fig. 2a; for further information, see text.
Fig. 5
Fig. 5. Stability of 50 µM Rubpy at pH 12.65 under continuous flashing with 532 nm at 10 Hz; intensity per flash, 352 mJ cm–2. Graph (a), without Asc2–; graph (b), with 45 mM Asc2– in the solutions. Solid lines, absorption spectra; dashed lines, emission spectra (excitation wavelength, 453 nm; filter effects and quenching avoided by 15-fold dilution and acidification to pH 1, compare ESI-1.1†). Colour code and illumination time in minutes (values corrected for aliquot removal in brackets) for all spectra: black, 0 (0); blue, 5 (5); cyan, 10 (10.35); green, 15 (16.11); yellow, 20 (22.34); orange, 25 (29.12); red, 30 (36.58). The insets give the normalized luminescence intensities as functions of the irradiation duration; the solid lines are smoothing spline fits to guide the eye.
Fig. 6
Fig. 6. Detoxification of chloroacetate ClAcA with the green-light driven catalytic system of this work. Graph (a) depicts the gross reaction above the 1H-NMR spectra before (upper trace) and after (lower trace) laser irradiation (532 nm, 600 mJ cm–2, 10 Hz repetition rate, 1 h illumination time) of an aqueous solution (pH 12.65) of 50 µM Rubpy and 45 mM of Asc2– (after correction for residual AscH) initially also containing 10 mM ClAcA. Both spectra were recorded after acidic workup (pH 1), and their vertical scales are identical. Signal assignment and colour code: chloroacetic acid, 4.11 ppm (s), red; acetic acid, 1.93 ppm (s), green; ascorbic acid, 3.93 ppm (m) and 3.60 ppm (m), brown. Graph (b) displays the outcome of a series of such experiments with identical illumination conditions, pH and catalyst concentration as in (a) but 89 mM Asc2– (corrected) and the ClAcA concentration c S as the independent variable. Workup and detection as in (a). Circles, cyan, left vertical scale, relative substrate consumption Δc S; pentagons, magenta, right vertical scale, TON. The gray lines are spline fits to guide the eye. For further details, see text.
Fig. 7
Fig. 7. Dechlorination of 5 mM ClPhA (a) and 5 mM ClPhAcA (b) with eaq˙ generated from an aqueous solution of 100 µM Rubpy and 100 mM Asc2– at pH 11.6 by illumination with 532 nm laser flashes (intensity, 600 mJ cm–2; repetition rate, 10 Hz) for 1 h each. The 1H-NMR spectra before the illumination (orange) and those after illumination (blue) have been superimposed with identical vertical scales, and overlaid with the spectra (green) of authentic reference samples of the products benzoic acid (a) and phenyl acetic acid (b). Further explanation, see text.
Fig. 8
Fig. 8. Reduction of the ketone TBMK with eaq˙. Graph (a), reaction scheme, with pertaining reaction energies underlayed with gray, and the observed protons of the substrate and the product colour coded. Graph (b), 1H-NMR spectra before (top) and after (bottom) illumination with 532 nm and 600 mJ cm–2 at 10 Hz for 30 min of a 10 mM aqueous TBMK solution at pH 11.6 also containing 50 µM Rubpy and 100 mM ascorbate (weight-in concentration). Spectra recorded after acidic workup, see ESI-1.1. Signal assignment and colour code; TBMK, 2.02 ppm (s) and 0.93 ppm, cyan; 3,3-dimethyl-2-butanol, 3.31 ppm (q), 0.91 ppm (d) and 0.66 ppm (s), magenta. Further explanation, see text.

References

    1. Zeitler K. Angew. Chem., Int. Ed. 2009;48:9785–9789. - PubMed
    1. Narayanam J. M. R., Stephenson C. R. J. Chem. Soc. Rev. 2011;40:102–113. - PubMed
    1. Xuan J., Xiao W.-J. Angew. Chem., Int. Ed. 2012;51:6828–6838. - PubMed
    1. Prier C. K., Rankic D. A., MacMillan D. W. C. Chem. Rev. 2013;113:5322–5363. - PMC - PubMed
    1. Koike T., Akita M. Inorg. Chem. Front. 2014;1:562–576.