

Cholesterol-directed nanoparticle assemblies based on single amino acid peptide mutations activate cellular uptake and decrease tumor volume
- PMID: 29163910
- PMCID: PMC5676250
- DOI: 10.1039/c7sc02616a
Cholesterol-directed nanoparticle assemblies based on single amino acid peptide mutations activate cellular uptake and decrease tumor volume
Abstract
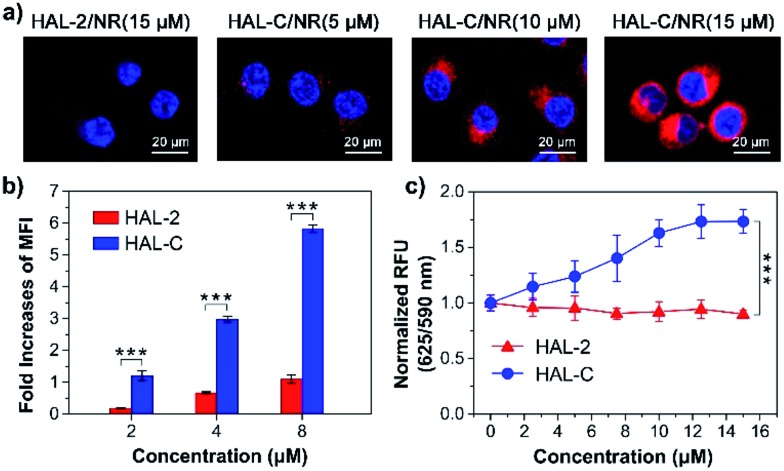
Peptide drugs have been difficult to translate into effective therapies due to their low in vivo stability. Here, we report a strategy to develop peptide-based therapeutic nanoparticles by screening a peptide library differing by single-site amino acid mutations of lysine-modified cholesterol. Certain cholesterol-modified peptides are found to promote and stabilize peptide α-helix formation, resulting in selectively cell-permeable peptides. One cholesterol-modified peptide self-assembles into stable nanoparticles with considerable α-helix propensity stabilized by intermolecular van der Waals interactions between inter-peptide cholesterol molecules, and shows 68.3% stability after incubation with serum for 16 h. The nanoparticles in turn interact with cell membrane cholesterols that are disproportionately present in cancer cell membranes, inducing lipid raft-mediated endocytosis and cancer cell death. Our results introduce a strategy to identify peptide nanoparticles that can effectively reduce tumor volumes when administered to in in vivo mice models. Our results also provide a simple platform for developing peptide-based anticancer drugs.
Figures


Similar articles
-
Synthesis, stability, and cellular internalization of gold nanoparticles containing mixed peptide-poly(ethylene glycol) monolayers.Anal Chem. 2007 Mar 15;79(6):2221-9. doi: 10.1021/ac061578f. Epub 2007 Feb 9. Anal Chem. 2007. PMID: 17288407
-
Gold nanoparticles stabilize peptide-drug-conjugates for sustained targeted drug delivery to cancer cells.J Nanobiotechnology. 2018 Mar 30;16(1):34. doi: 10.1186/s12951-018-0362-1. J Nanobiotechnology. 2018. PMID: 29602308 Free PMC article.
-
Assemblies of d-Peptides for Targeting Cell Nucleolus.Bioconjug Chem. 2019 Oct 16;30(10):2528-2532. doi: 10.1021/acs.bioconjchem.9b00524. Epub 2019 Sep 27. Bioconjug Chem. 2019. PMID: 31550136 Free PMC article.
-
Lipid-polymer hybrid nanoparticles as a new generation therapeutic delivery platform: a review.Eur J Pharm Biopharm. 2013 Nov;85(3 Pt A):427-43. doi: 10.1016/j.ejpb.2013.07.002. Epub 2013 Jul 17. Eur J Pharm Biopharm. 2013. PMID: 23872180 Review.
-
In vivo targeted delivery of nanoparticles for theranosis.Acc Chem Res. 2011 Oct 18;44(10):1018-28. doi: 10.1021/ar2000138. Epub 2011 Aug 18. Acc Chem Res. 2011. PMID: 21851104 Review.
Cited by
-
Anti-cancer peptides: classification, mechanism of action, reconstruction and modification.Open Biol. 2020 Jul;10(7):200004. doi: 10.1098/rsob.200004. Epub 2020 Jul 22. Open Biol. 2020. PMID: 32692959 Free PMC article. Review.
-
Fluoroalkylation promotes cytosolic peptide delivery.Sci Adv. 2020 Aug 12;6(33):eaaz1774. doi: 10.1126/sciadv.aaz1774. eCollection 2020 Aug. Sci Adv. 2020. PMID: 32851155 Free PMC article.
-
Antimicrobial peptide moricin induces ROS mediated caspase-dependent apoptosis in human triple-negative breast cancer via suppression of notch pathway.Cancer Cell Int. 2023 Jun 21;23(1):121. doi: 10.1186/s12935-023-02958-y. Cancer Cell Int. 2023. PMID: 37344820 Free PMC article.
-
Peptide-based drugs in immunotherapy: current advances and future prospects.Med Oncol. 2025 Apr 23;42(5):177. doi: 10.1007/s12032-025-02739-9. Med Oncol. 2025. PMID: 40266466 Review.
References
Grants and funding
LinkOut - more resources
Full Text Sources
Other Literature Sources