

Quantitative first principles calculations of protein circular dichroism in the near-ultraviolet
- PMID: 29163925
- PMCID: PMC5637123
- DOI: 10.1039/c7sc00586e
Quantitative first principles calculations of protein circular dichroism in the near-ultraviolet
Abstract
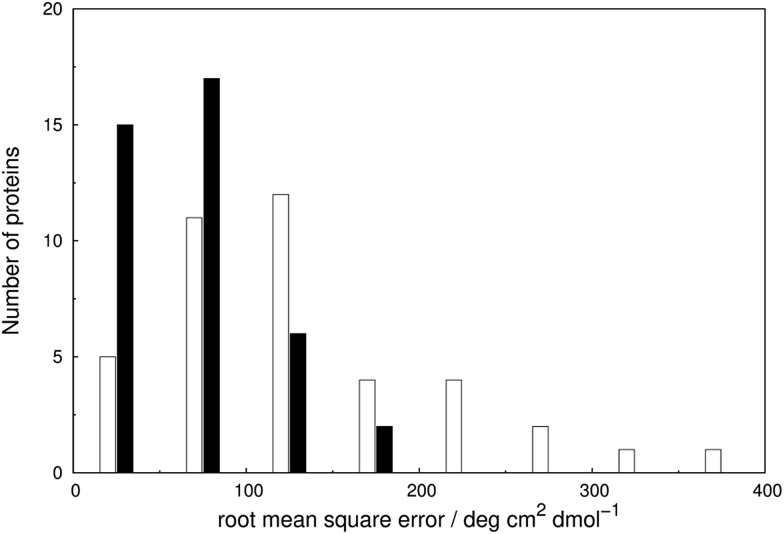
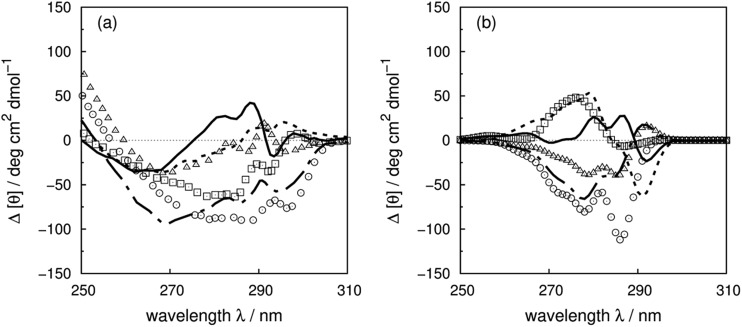
Vibrational structure in the near-UV circular dichroism (CD) spectra of proteins is an important source of information on protein conformation and can be exploited to study structure and folding. A fully quantitative theory of the relationship between protein conformation and optical spectroscopy would facilitate deeper interpretation of and insight into biophysical and simulation studies of protein dynamics and folding. We have developed new models of the aromatic side chain chromophores toluene, p-cresol and 3-methylindole, which incorporate ab initio calculations of the Franck-Condon effect into first principles calculations of CD using an exciton approach. The near-UV CD spectra of 40 proteins are calculated with the new parameter set and the correlation between the computed and the experimental intensity from 270 to 290 nm is much improved. The contribution of individual chromophores to the CD spectra has been calculated for several mutants and in many cases helps rationalize changes in their experimental spectra. Considering conformational flexibility by using families of NMR structures leads to further improvements for some proteins and illustrates an informative level of sensitivity to side chain conformation. In several cases, the near-UV CD calculations can distinguish the native protein structure from a set of computer-generated misfolded decoy structures.
Figures


Similar articles
-
Near-Ultraviolet Circular Dichroism and Two-Dimensional Spectroscopy of Polypeptides.Molecules. 2021 Jan 13;26(2):396. doi: 10.3390/molecules26020396. Molecules. 2021. PMID: 33451152 Free PMC article.
-
DichroCalc: Improvements in Computing Protein Circular Dichroism Spectroscopy in the Near-Ultraviolet.J Mol Biol. 2018 Jul 20;430(15):2196-2202. doi: 10.1016/j.jmb.2017.12.009. Epub 2017 Dec 16. J Mol Biol. 2018. PMID: 29258819
-
First-principles calculations of protein circular dichroism in the near ultraviolet.Biochemistry. 2004 Aug 31;43(34):11092-102. doi: 10.1021/bi049031n. Biochemistry. 2004. PMID: 15323568
-
First-principles calculations of protein circular dichroism in the far-ultraviolet and beyond.Chirality. 2006 May 15;18(5):340-7. doi: 10.1002/chir.20264. Chirality. 2006. PMID: 16557524 Review.
-
A significant role for high-energy transitions in the ultraviolet circular dichroism spectra of polypeptides and proteins.Chirality. 2010;22 Suppl 1:E22-9. doi: 10.1002/chir.20857. Chirality. 2010. PMID: 21038392 Review.
Cited by
-
The Structural Fingerprint of Therapeutic Monoclonal Antibodies Determined Using a Combination of Near-UV Circular Dichroism and Statistical Approach for Comparative Analysis.Anal Chem. 2025 Jun 24;97(24):12578-12586. doi: 10.1021/acs.analchem.5c00718. Epub 2025 Jun 10. Anal Chem. 2025. PMID: 40494510 Free PMC article.
-
Architectural digest: Thermodynamic stability and domain structure of a consensus monomeric globin.Biophys J. 2023 Aug 8;122(15):3117-3132. doi: 10.1016/j.bpj.2023.06.016. Epub 2023 Jun 23. Biophys J. 2023. PMID: 37353934 Free PMC article.
-
Computed optical spectra of SARS-CoV-2 proteins.Chem Phys Lett. 2020 Nov;758:137935. doi: 10.1016/j.cplett.2020.137935. Epub 2020 Aug 29. Chem Phys Lett. 2020. PMID: 33518776 Free PMC article.
-
Molecular Changes in Dengue Envelope Protein Domain III upon Interaction with Glycosaminoglycans.Pathogens. 2020 Nov 11;9(11):935. doi: 10.3390/pathogens9110935. Pathogens. 2020. PMID: 33187224 Free PMC article.
-
Near-Ultraviolet Circular Dichroism and Two-Dimensional Spectroscopy of Polypeptides.Molecules. 2021 Jan 13;26(2):396. doi: 10.3390/molecules26020396. Molecules. 2021. PMID: 33451152 Free PMC article.
References
-
- Kelly S. M., Jess T. J., Price N. C. Biochim. Biophys. Acta, Proteins Proteomics. 2005;1751:119. - PubMed
-
- Burley S. L., Petsko G. A. Science. 1985;229:23. - PubMed
-
- Ptitsyn O. B. Adv. Protein Chem. 1995;47:83. - PubMed
-
- Freskgård P. O., Martensson L. G., Jonasson P., Jonsson B. H., Carlsson U. Biochemistry. 1994;33:14281. - PubMed
LinkOut - more resources
Full Text Sources
Other Literature Sources