. 2017 Nov 8;3(6):265-273.
doi: 10.1192/bjpo.bp.117.005058. eCollection 2017 Nov.

Individual differences in schizophrenia

Affiliations

Individual differences in schizophrenia

Edmund T Rolls et al. BJPsych Open. .

Abstract

Background: Whether there are distinct subtypes of schizophrenia is an important issue to advance understanding and treatment of schizophrenia.

Aims: To understand and treat individuals with schizophrenia, the aim was to advance understanding of differences between individuals, whether there are discrete subtypes, and how first-episode patients (FEP) may differ from multiple episode patients (MEP).

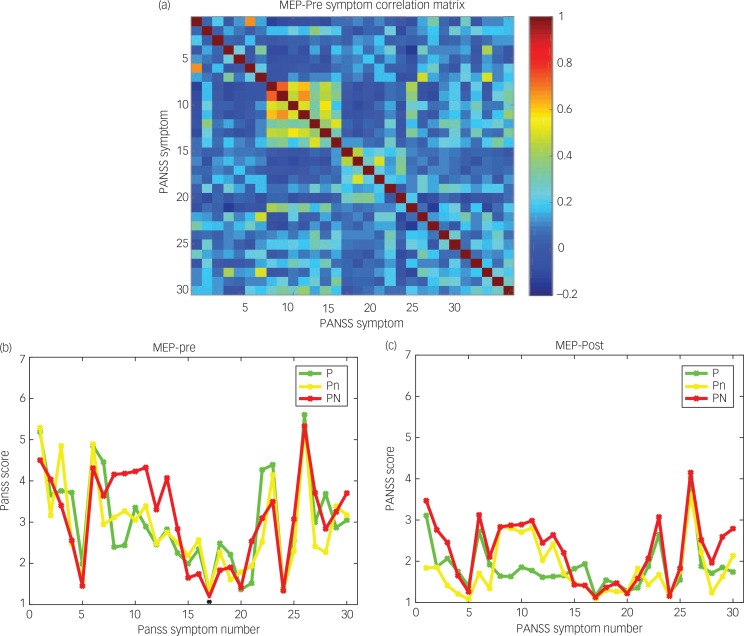
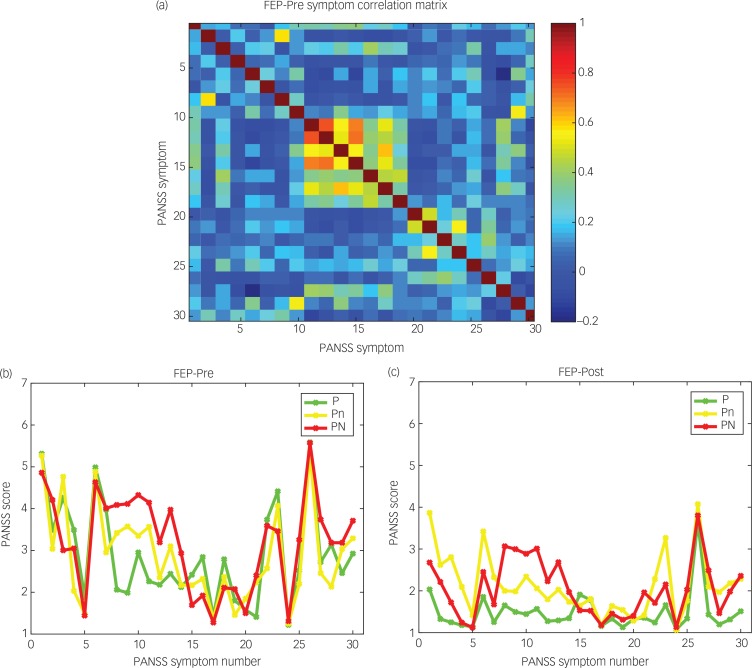
Method: These issues were analysed in 687 FEP and 1880 MEP with schizophrenia using the Positive and Negative Syndrome Scale for (PANSS) schizophrenia before and after antipsychotic medication for 6 weeks.

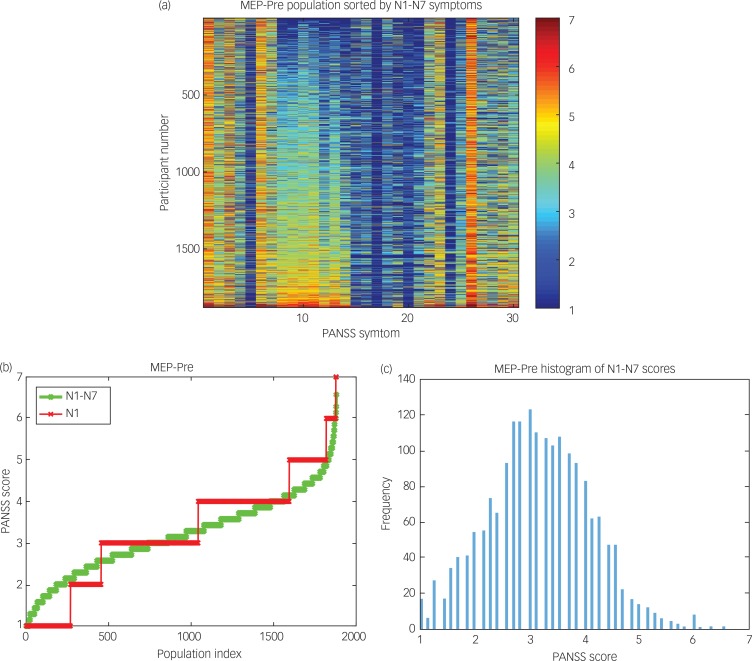
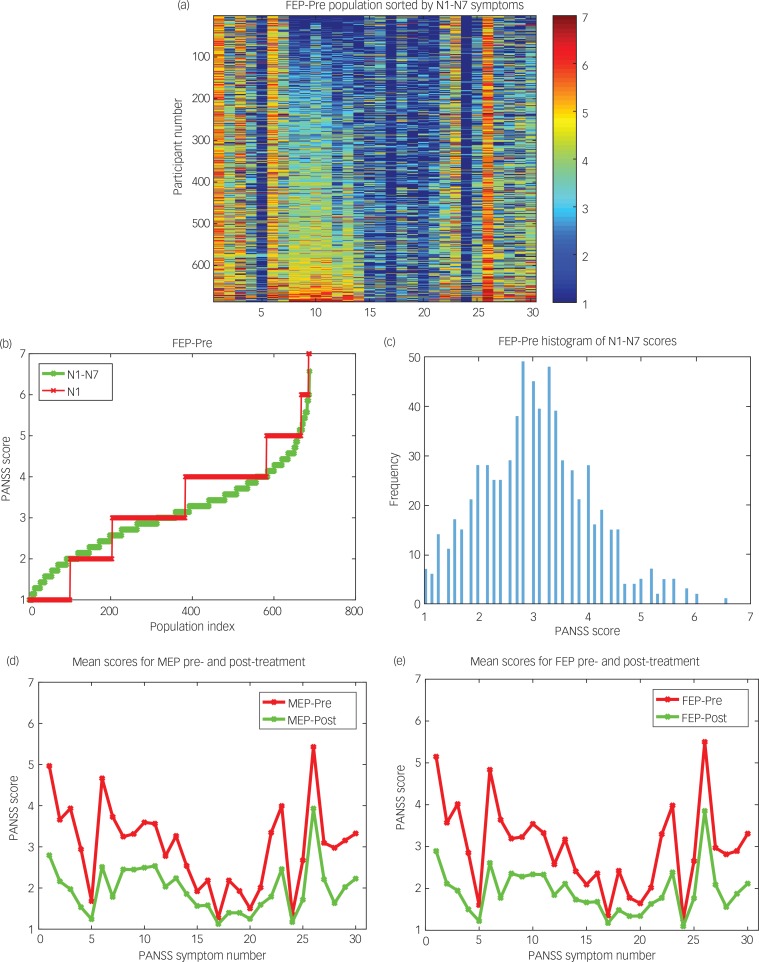
Results: The seven Negative Symptoms were correlated with each other and with P2 (conceptual disorganisation), G13 (disturbance of volition), and G7 (motor retardation). The main difference between individuals was in the cluster of seven negative symptoms, which had a continuous unimodal distribution. Medication decreased the PANSS scores for all the symptoms, which were similar in the FEP and MEP groups.

Conclusions: The negative symptoms are a major source of individual differences, and there are potential implications for treatment.

Declaration of interests: L.P. received speaker fees from Otsuka Canada and educational grant from Janssen Canada in 2017.

Copyright and usage: © The Royal College of Psychiatrists 2017. This is an open access article distributed under the terms of the Creative Commons Non-Commercial, No Derivatives (CC BY-NC-ND) license.


Figures

Fig. 1
Fig. 1. (a) MEP_Pre symptom correlation matrix. The colour bar indicates the value of the Pearson correlation. In PANSS (14), P1–P7 are Symptoms 1–7, N1–N7 are Symptoms 8–14 and G1–G16 are Symptoms 15–30. The values for each score are 1–7. The symptoms are as follows: Delusions (P1), Conceptual disorganisation (P2), Hallucinations (P3), Hyperactivity (P4), Grandiosity (P5), Suspiciousness/persecution (P6), Hostility (P7), Blunted affect (N1), Emotional withdrawal (N2), Poor rapport (N3), Passive/apathetic social withdrawal (N4), Difficulty in abstract thinking (N5), Lack of spontaneity and flow of conversation (N6), Stereotyped thinking (N7), Somatic concern (G1), Anxiety (G2), Guilt feelings (G3), Tension (G4), Mannerisms and posturing (G5), Depression (G6), Motor retardation (G7), Uncooperativeness (G8), Unusual thought content (G9), Disorientation (G10), Poor attention (G11), Lack of judgment and insight (G12), Disturbance of volition (G13), Poor impulse control (G14), Preoccupation (G15) and Active social avoidance (G16). (b) MEP_Pre average symptom values in the three patient clusters detected by k-means. (c) MEP_Post average symptom values in the three patient clusters detected by k-means.
Fig. 2
Fig. 2. (a) MEP_Pre group sorted by the average value of the negative symptoms, N1–N7 (Symptoms 8–14). The colour bar on the right shows the PANSS score in the range 1–7. (b) The average score for Symptoms N1–N7 shown sorted by its value in each member of the MEP_Pre population (green). The red plot shows the value for N1. (c) A histogram of the average score for Symptoms N1–N7 in the MEP_Pre group.
Fig. 3
Fig. 3. (a) FEP_Pre symptom correlation matrix. The colour bar indicates the value of the Pearson correlation. In PANSS (14), P1–P7 are Symptoms 1–7, N1–N7 are Symptoms 8–14 and G1–G16 are Symptoms 15–30. The values for each score are 1–7. (b) FEP_Pre average symptom values in the three patient clusters detected by k-means. (c) FEP_Post average symptom values in the three patient clusters detected by k-means.
Fig. 4
Fig. 4. (a) FEP_Pre group sorted by the average value of the negative symptoms, N1–N7 (Symptoms 8–14). The colour bar on the right shows the PANSS score in the range 1–7. (b) The average score for Symptoms N1–N7 shown sorted by its value in each member of the FEP_Pre population (green). The red plot shows the value for N1. (c) A histogram of the average score for Symptoms N1–N7 in the FEP_Pre group. (d and e) PANSS symptom scores before and after treatment for (d) the MEP and (e) the FEP groups.

Similar articles

Cited by

References

    1. Tsuang MT, Lyons MJ, Faraone SV. Heterogeneity of schizophrenia. Conceptual models and analytic strategies. Br J Psychiatry 1990; 156: 17–26. - PubMed
    1. Schizophrenia Working Group of the Psychiatric Genomics C. Biological insights from 108 schizophrenia-associated genetic loci. Nature 2014; 511: 421–7. - PMC - PubMed
    1. Rolls ET. Cerebral Cortex: Principles of Operation. Oxford University Press, 2016.
    1. Rolls ET, Loh M, Deco G, Winterer G. Computational models of schizophrenia and dopamine modulation in the prefrontal cortex. Nat Rev Neurosci 2008; 9: 696–709. - PubMed
    1. Li T, Wang Q, Zhang J, Rolls ET, Yang W, Palaniyappan L, et al. Brain-wide analysis of functional connectivity in first-episode and chronic stages of schizophrenia. Schizophr Bull 2017; 43: 436–48. - PMC - PubMed