Quantitative Analysis of Electro-Anatomical Maps: Application to an Experimental Model of Left Bundle Branch Block/Cardiac Resynchronization Therapy
- PMID: 29164019
- PMCID: PMC5477765
- DOI: 10.1109/JTEHM.2016.2634006
Quantitative Analysis of Electro-Anatomical Maps: Application to an Experimental Model of Left Bundle Branch Block/Cardiac Resynchronization Therapy
Abstract
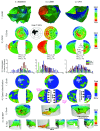
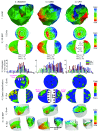
Electro-anatomical maps (EAMs) are commonly acquired in clinical routine for guiding ablation therapies. They provide voltage and activation time information on a 3-D anatomical mesh representation, making them useful for analyzing the electrical activation patterns in specific pathologies. However, the variability between the different acquisitions and anatomies hampers the comparison between different maps. This paper presents two contributions for the analysis of electrical patterns in EAM data from biventricular surfaces of cardiac chambers. The first contribution is an integrated automatic 2-D disk representation (2-D bull's eye plot) of the left ventricle (LV) and right ventricle (RV) obtained with a quasi-conformal mapping from the 3-D EAM meshes, that allows an analysis of cardiac resynchronization therapy (CRT) lead positioning, interpretation of global (total activation time), and local indices (local activation time (LAT), surrogates of conduction velocity, inter-ventricular, and transmural delays) that characterize changes in the electrical activation pattern. The second contribution is a set of indices derived from the electrical activation: speed maps, computed from LAT values, to study the electrical wave propagation, and histograms of isochrones to analyze regional electrical heterogeneities in the ventricles. We have applied the proposed methods to look for the underlying physiological mechanisms of left bundle branch block (LBBB) and CRT, with the goal of optimizing the therapy by improving CRT response. To better illustrate the benefits of the proposed tools, we created a set of synthetically generated and fully controlled activation patterns, where the proposed representation and indices were validated. Then, the proposed analysis tools are used to analyze EAM data from an experimental swine model of induced LBBB with an implanted CRT device. We have analyzed and compared the electrical activation patterns at baseline, LBBB, and CRT stages in four animals: two without any structural disease and two with an induced infarction. By relating the CRT lead location with electrical dyssynchrony, we evaluated current hypotheses about lead placement in CRT and showed that optimal pacing sites should target the RV lead close to the apex and the LV one distant from it.
Keywords: Cardiac resynchronization therapy; electro-anatomical mapping system; lead placement; left bundle branch block; quantitative pattern analysis; subject-specific 2D and 3D data representation.
Figures


Similar articles
-
Different regions of latest electrical activation during left bundle-branch block and right ventricular pacing in cardiac resynchronization therapy patients determined by coronary venous electro-anatomic mapping.Eur J Heart Fail. 2014 Nov;16(11):1214-22. doi: 10.1002/ejhf.178. Epub 2014 Oct 15. Eur J Heart Fail. 2014. PMID: 25315161
-
Left ventricular electrical activation during right ventricular pacing in heart failure patients with LBBB: visualization by electrocardiographic imaging and implications for cardiac resynchronization therapy.J Electrocardiol. 2015 Jan-Feb;48(1):53-61. doi: 10.1016/j.jelectrocard.2014.09.002. Epub 2014 Sep 16. J Electrocardiol. 2015. PMID: 25301520 Clinical Trial.
-
Acute biventricular hemodynamic effects of cardiac resynchronization therapy in right bundle branch block.Heart Rhythm. 2018 Oct;15(10):1525-1532. doi: 10.1016/j.hrthm.2018.05.017. Epub 2018 May 23. Heart Rhythm. 2018. PMID: 29800750
-
Assessment of mechanical dyssynchrony in cardiac resynchronization therapy.Dan Med J. 2014 Dec;61(12):B4981. Dan Med J. 2014. PMID: 25441737 Review.
-
Optimizing CRT - Do We Need More Leads and Delivery Methods.J Atr Fibrillation. 2015 Apr 30;7(6):1202. doi: 10.4022/jafib.1202. eCollection 2015 Apr-May. J Atr Fibrillation. 2015. PMID: 27957161 Free PMC article. Review.
Cited by
-
Extrapolation of Ventricular Activation Times From Sparse Electroanatomical Data Using Graph Convolutional Neural Networks.Front Physiol. 2021 Oct 18;12:694869. doi: 10.3389/fphys.2021.694869. eCollection 2021. Front Physiol. 2021. PMID: 34733172 Free PMC article.
-
Influence of Left Bundle Branch Block on the Electrocardiographic Changes Induced by Acute Coronary Artery Occlusion of Distinct Location and Duration.Front Physiol. 2019 Feb 12;10:82. doi: 10.3389/fphys.2019.00082. eCollection 2019. Front Physiol. 2019. PMID: 30809155 Free PMC article.
-
Comparative Anesthesia Effect of Brachial Plexus Block Based on Smart Electronic Medical Ultrasound-Guided Positioning and Traditional Anatomical Positioning.J Healthc Eng. 2021 Feb 25;2021:6676610. doi: 10.1155/2021/6676610. eCollection 2021. J Healthc Eng. 2021. Retraction in: J Healthc Eng. 2023 Oct 11;2023:9790279. doi: 10.1155/2023/9790279. PMID: 33728033 Free PMC article. Retracted.
References
-
- Zipes D. P., et al. , “ACC/AHA/ESC 2006 guidelines for management of patients with ventricular arrhythmias and the prevention of sudden cardiac death,” Europace, vol. 8, no. 9, pp. 746–837, 2006. - PubMed
-
- Duckett S. G., et al. , “Relationship between endocardial activation sequences defined by high-density mapping to early septal contraction (septal flash) in patients with left bundle branch block undergoing cardiac resynchronization therapy,” Europace, vol. 14, no. 1, pp. 99–106, 2012. - PubMed
-
- Silva E., et al. , “Integration of mechanical, structural and electrical imaging to understand response to cardiac resynchronization therapy,” Revista Española Cardiología, vol. 67, no. 10, pp. 813–821, 2014. - PubMed
-
- Gepstein L., Hayam G., and Ben-Haim S., “A novel method for nonfluoroscopic catheter-based electroanatomical mapping of the heart. In vitro and in vivo accuracy results,” Circulation, vol. 95, no. 6, pp. 1611–1622, 1997. - PubMed
-
- Auricchio A., et al. , “Characterization of left ventricular activation in patients with heart failure and left bundle-branch block,” Circulation, vol. 109, no. 9, pp. 133–139, 2004. - PubMed
LinkOut - more resources
Full Text Sources
Other Literature Sources
Research Materials
Miscellaneous

