. 2017 Oct 30:7:251.
doi: 10.3389/fonc.2017.00251. eCollection 2017.

Anti-inflammatory Microglia/Macrophages As a Potential Therapeutic Target in Brain Metastasis

Affiliations

Anti-inflammatory Microglia/Macrophages As a Potential Therapeutic Target in Brain Metastasis

Kleopatra E Andreou et al. Front Oncol. .

Abstract

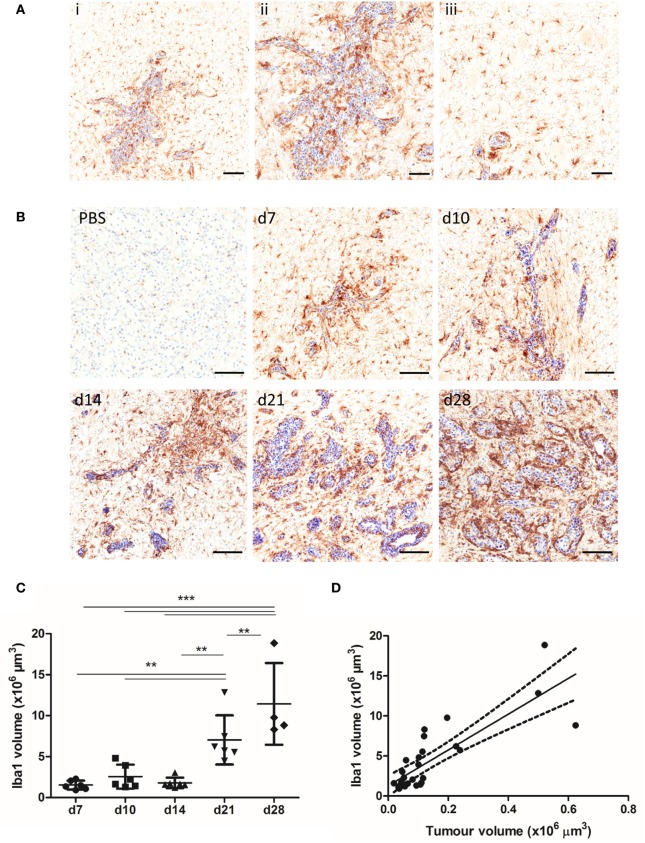
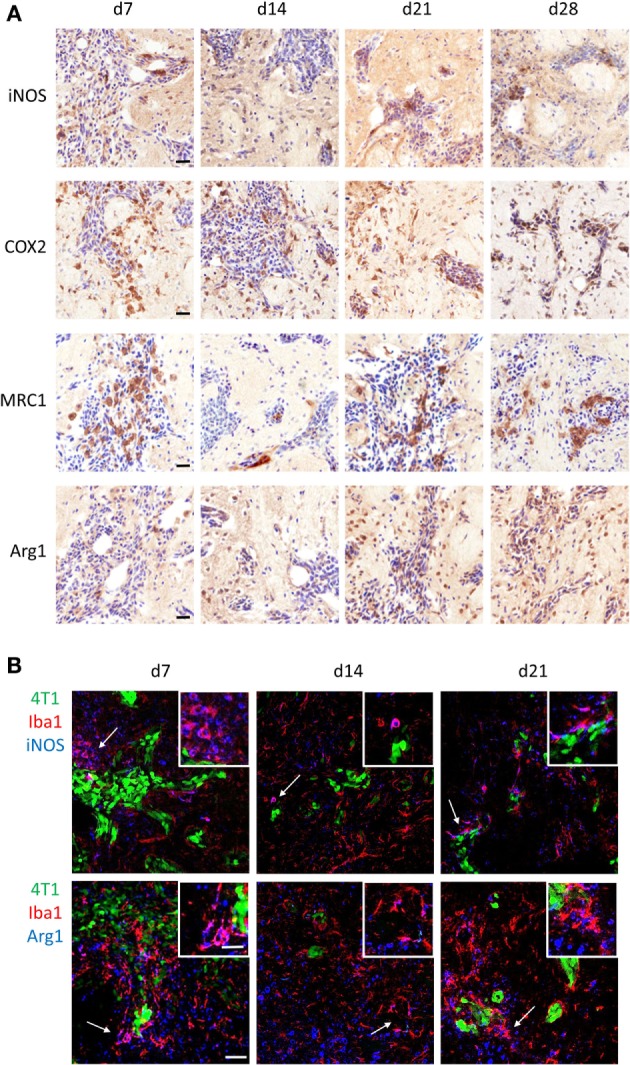
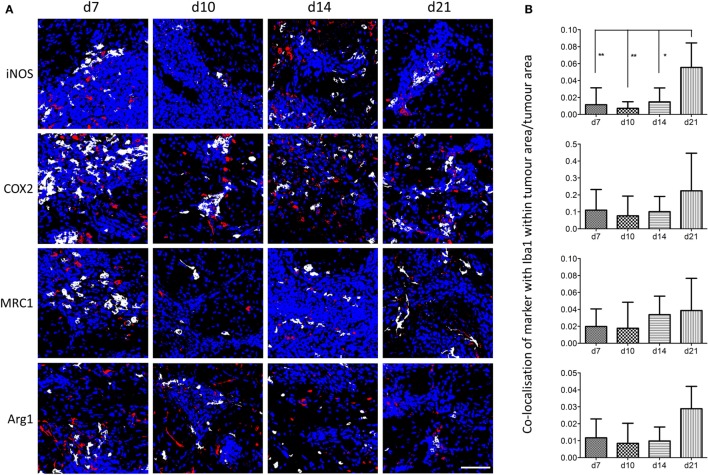
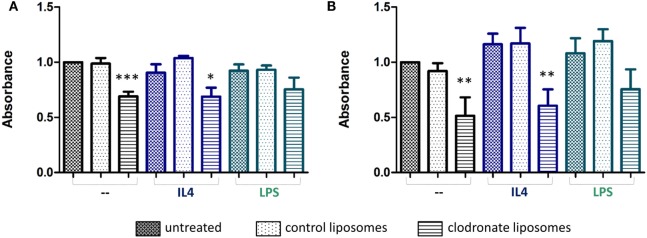
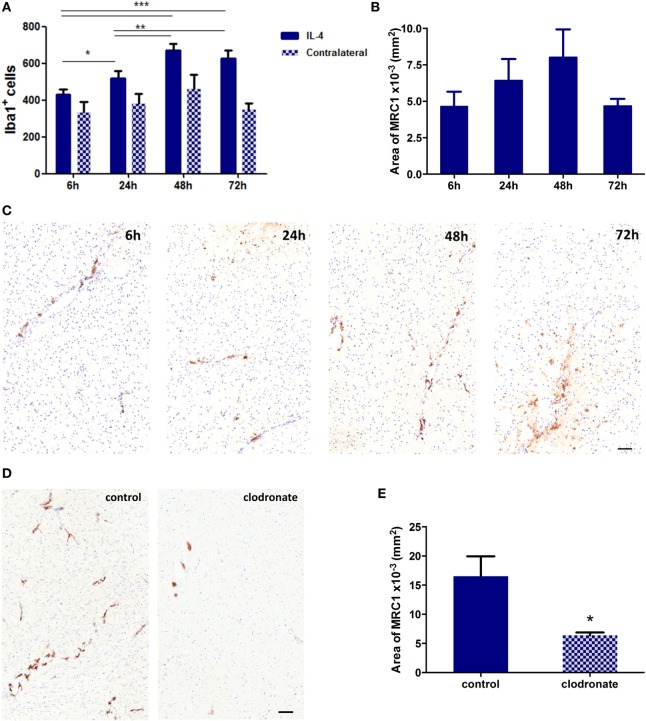
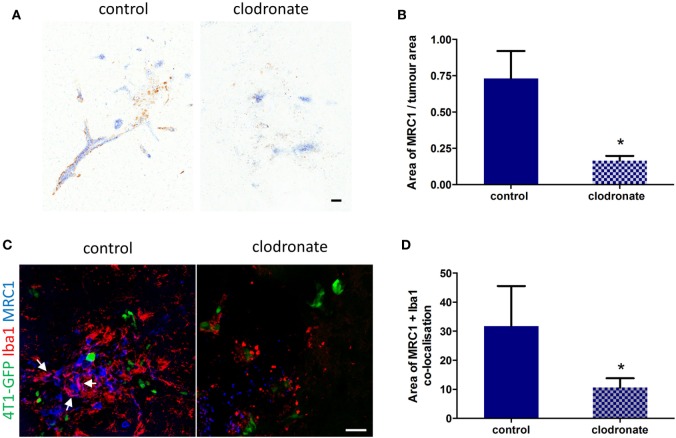
Brain metastasis is a common complication of cancer patients and is associated with poor survival. Histological data from patients with brain metastases suggest that microglia are the major immune population activated around the metastatic foci. Microglia and macrophages have the ability to polarize to different phenotypes and to exert both tumorigenic and cytotoxic effects. However, the role of microglia/macrophages during the early stages of metastatic growth in the brain has not yet been determined. The aim of this study was to profile microglial/macrophage activation in a mouse model of breast cancer brain metastasis during the early stages of tumor growth, and to assess the role of the anti-inflammatory microglial/macrophage population, specifically, during this phase. Following intracerebral injection of 5 × 10³ 4T1-GFP mammary carcinoma cells into female BALB/c mice, robust microglial/macrophage activation around the 4T1 metastatic foci was evident throughout the time-course studied (28 days) and correlated positively with tumor volume (R2 = 0.67). Populations of classically (proinflammatory) and alternatively (anti-inflammatory) activated microglia/macrophages were identified immunohistochemically by expression of either induced nitric oxide synthase/cyclooxygenase 2 or mannose receptor 1/arginase 1, respectively. Temporally, levels of both pro- and anti-inflammatory cells were broadly stable across the time-course. Subsequently, selective depletion of the anti-inflammatory microglia/macrophage population by intracerebral injection of mannosylated clodronate liposomes significantly reduced metastatic tumor burden (p < 0.01). Moreover, increased levels of apoptosis were associated with tumors in clodronate liposome treated animals compared to controls (p < 0.05). These findings suggest that microglia/macrophages are important effectors of the inflammatory response in the early stages of brain metastasis, and that targeting the anti-inflammatory microglial/macrophage population may offer an effective new therapeutic avenue for patients with brain metastases.

Keywords: anti-inflammatory; brain metastasis; macrophages; microglia; mouse models.


Figures

Figure 1
Figure 1
(A) Iba1+ microglia/macrophages (brown) are detected in close association with the tumor foci (ii) and within the broader tumor microenvironment (iii) in the 4T1-GFP metastatic brains, as shown by a representative image of a brain section (counterstained with cresyl violet) at day 7 after intracerebral injection of 5 × 103 4T1-GFP cells. (B) Representative immunohistochemical images showing increased expression of Iba1 at days 7, 10, 14, 21, and 28 after intracerebral injection of 5 × 103 4T1-GFP cells compared to intracerebral PBS injection (d7). (C) Quantitation of the Iba1+ immunostained area in the metastatic brain showed a significant increase over time (n = 4–6 per group). **p < 0.01, ***p < 0.001; one-way ANOVA with Tukey’s multiple comparison test. (D) Pearson correlation plot of microglial/macrophage infiltration (Iba1+) area against tumor volume (cresyl violet foci) revealed a strong positive correlation (R2 = 0.671). Scale bars 100 µm [(A), i, (B)] or 50 µm [(A), ii, iii].
Figure 2
Figure 2
(A) Immunohistochemical detection (brown stain) of the proinflammatory markers induced nitric oxide synthase (iNOS) and cyclooxygenase 2, and the anti-inflammatory markers mannose receptor 1 and arginase 1 (Arg1) at days 7, 10, 14, and 21 after intracerebral injection of 5 × 103 4T1-GFP cells (sections counterstained with cresyl violet). (B) Detection of pro- and anti-inflammatory microglia/macrophages in the metastatic brain by immunofluorescent colocalization of Iba1 with either iNOS (top panel) or Arg1 (bottom panel) at days 7, 14, and 21 after intracerebral injection of 5 × 103 4T1-GFP cells. Arrows show areas of colocalization, which are magnified in the insets. Scale bars 20 µm (A), 50 µm (B), or 25 µm [(B) insets].
Figure 3
Figure 3
(A) Matlab generated images of iNOS+, COX2+, MRC1+, or Arg1+ microglia/macrophages (Iba1+) at days 7, 10, 14, and 21 after intracerebral injection of 5 × 103 4T1-GFP cells. White = colocalized pixels, blue = tumor cells, and red = inflammatory markers. (B) Quantitative analysis of colocalized pixels for pro- and anti-inflammatory markers with Iba1 within the tumor area only, normalized to tumor area (n = 3–6 per time point; *p < 0.05, **p < 0.01; one-way ANOVA with Tukey’s multiple comparison test). Scale bar 50 µm.
Figure 4
Figure 4
Formazan absorbance as a measure of viability of non-polarized (black bars) or polarized (blue and green bars) BV2 (A) and RAW 264.7 (B) cells treated with mannosylated control or clodronate liposomes (1:50) for 24 h. Polarization of cells was achieved by treatment with either 20 ng/ml interleukin 4 (IL-4, anti-inflammatory) or 100 ng/ml LPS (proinflammatory) 24 h prior to the liposome treatment (n = 3, *p < 0.05, **p < 0.01, ***p < 0.001; one-way ANOVA with Dunnett’s multiple comparison test for each polarization group). Absorbances of untreated non-polarized cells are normalized to 1.
Figure 5
Figure 5
(A) Quantitation of Iba1+ cells in the striatum of mice injected intracerebrally with 100 ng of murine recombinant interleukin 4 (IL-4, n = 3 per group; *p < 0.05, **p < 0.01, ***p < 0.001; one-way ANOVA with Newman–Keuls multiple comparison test for IL-4 injected hemispheres). (B) Quantitation of MRC1 expression in hemispheres injected with IL-4 (n = 3 per group). (C) Representative striatal IHC images for MRC1 expression (brown stain) in mice intracerebrally challenged with 100 ng IL-4. (D) Representative IHC images for MRC1 expression (brown stain) from striatal areas of mice injected with 100 ng IL-4 and either control or clodronate liposomes 24 h later. (E) Quantitation of MRC1 expression in hemispheres injected with mannosylated control or clodronate liposomes 24 h after intracerebral injection of 100 ng IL-4 (n = 3 per group; two tailed unpaired t-test, *p < 0.05). Scale bars 50 µm.
Figure 6
Figure 6
(A) Representative IHC images for MRC1 expression (brown stain) from striatal regions of metastatic brains three days after injection with mannosylated control or clodronate liposomes. (B) Quantitation of MRC1 expression normalized to tumor area in brains bearing 4T1-GFP metastases 3 days after intracerebral injection of mannosylated control or clodronate liposomes (n = 4 per group; *p < 0.05, two tailed unpaired t-test). (C) Representative immunofluorescent images of MRC1+ microglia/macrophages in brains of mice injected with mannosylated control or clodronate liposomes. Arrows show colocalization of Iba1 and MRC1 immunostains. (D) Quantitation of colocalization of MRC1 with Iba1 three days after intracerebral injection of mannosylated liposomes (n = 4 per group; *p < 0.05, two tailed unpaired t-test). Scale bar 50 µm.
Figure 7
Figure 7
(A) Quantitation of intracranial tumor burden for mice injected intracerebrally with mannosylated control or clodronate liposomes 12 days after intracerebral 4T1-GFP tumor cell injection (n = 5–8 per group; **p < 0.01, two tailed unpaired t-test). Time points shown are relative to 4T1-GFP cell injections. (B) Representative immunohistochemical images for Iba1 expression (brown stain) for the control and clodronate liposome injected animals at days 21 and 28 after tumor cell injection. (C) Representative striatal immunohistochemical images for cleaved caspase 3 expression (brown stain) at days 15, 21, and 28 after intracerebral 4T1-GFP cell injection, in mice injected with either control or clodronate liposomes at day 12. (D) Quantitation of apoptosis as indicated by CC3 expression at days 15, 21, and 28 in metastatic brains intracerebrally injected with mannosylated control or clodronate liposomes (n = 3–5 per group; *p < 0.05, two tailed unpaired t-test). (E) Immunofluorescent images showing colocalization (arrows) of CC3 (red) with GFP+ tumor cells (green) from representative control and clodronate liposomes injected animals at day 21 of the time-course study. Scale bars 50 µm [(B,C,E) control] or 20 µm [(E) clodronate].

Similar articles

Cited by

References

    1. Eichler AF, Loeffler JS. Multidisciplinary management of brain metastases. Oncologist (2007) 12(7):884–98.10.1634/theoncologist.12-7-884 - DOI - PubMed
    1. Lin X, DeAngelis LM. Treatment of brain metastases. J Clin Oncol (2015) 33(30):3475–84.10.1200/JCO.2015.60.9503 - DOI - PMC - PubMed
    1. Pease NJ, Edwards A, Moss L. Effectiveness of whole brain radiotherapy in the treatment of brain metastases: a systematic review. Palliat Med (2005) 19(4):288–99.10.1191/0269216305pm1017oa - DOI - PubMed
    1. Lorger M, Felding-Habermann B. Capturing changes in the brain microenvironment during initial steps of breast cancer brain metastasis. Am J Pathol (2010) 176(6):2958–71.10.2353/ajpath.2010.090838 - DOI - PMC - PubMed
    1. Berghoff AS, Lassmann H, Preusser M, Höftberger R. Characterization of the inflammatory response to solid cancer metastases in the human brain. Clin Exp Metastasis (2013) 30(1):69–81.10.1007/s10585-012-9510-4 - DOI - PubMed