Feasibility of Classifying Life Stages and Searching for the Determinants: Results from the Medical Expenditure Panel Survey 1996-2011
- PMID: 29164090
- PMCID: PMC5663691
- DOI: 10.3389/fpubh.2017.00247
Feasibility of Classifying Life Stages and Searching for the Determinants: Results from the Medical Expenditure Panel Survey 1996-2011
Abstract
Background: Life stages are not clearly defined and significant determinants for the identification of stages are not discussed. This study aims to test a data-driven approach to define stages and to identify the major determinants.
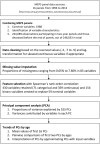
Methods: This study analyzed the data on the Medical Expenditure Panel Survey interviewees from 1996 to 2011 in the United States. This study first selected features with the Spearman's correlation to remove redundant variables and to increase computational feasibility. The retained 430 variables were log transformed, if applicable. Sixty-four nominal variables were replaced with 164 binominal variables. This led to 525 variables that were available for principal component analysis (PCA). Life stages were proposed to be periods of ages with significantly different values of principal components (PCs).
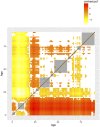
Results: After retaining subjects followed throughout the panels, 244,089 were eligible for PCA, and the number of civilians was estimated to be 4.6 billion. The age ranged from 0 to 90 years old (mean = 35.88, 95% CI = 35.67-36.09). The values of the first PC were not significant from age of 6 to 13, 30 to 41, 46 to 60, and 76 to 90 years (adjusted p > 0.5), and the major determinants were related to functional status, employment, and poverty.
Conclusion: Important stages and their major determinants, including the status of functionality and cognition, income, and marital status, can be identified. Identifying stages of stability or transition will be important for research that relies on a research population with similar characteristics to draw samples for observation or intervention.
Contribution: This study sets an example of defining stages of transition and stability across ages with social and health data. Among all available variables, cognitive limitations, income, and poverty are important determinants of these stages.
Keywords: life stages; medical expenditure panel survey; principal component analysis; principal components; stable stages; stages of transition.
Figures


Similar articles
-
Stages of Biological Development across Age: An Analysis of Canadian Health Measure Survey 2007-2011.Front Public Health. 2018 Jan 11;5:355. doi: 10.3389/fpubh.2017.00355. eCollection 2017. Front Public Health. 2018. PMID: 29376046 Free PMC article.
-
Principal component-based weighted indices and a framework to evaluate indices: Results from the Medical Expenditure Panel Survey 1996 to 2011.PLoS One. 2017 Sep 8;12(9):e0183997. doi: 10.1371/journal.pone.0183997. eCollection 2017. PLoS One. 2017. PMID: 28886057 Free PMC article.
-
Patient phenotypes associated with outcome following surgery for mild degenerative cervical myelopathy: a principal component regression analysis.Spine J. 2018 Dec;18(12):2220-2231. doi: 10.1016/j.spinee.2018.05.009. Epub 2018 May 7. Spine J. 2018. PMID: 29746963
-
Sociodemographic Determinants of Out-of-Pocket Expenditures for Patients Using Prescription Drugs for Rheumatoid Arthritis.Am Health Drug Benefits. 2017 Feb;10(1):7-15. Am Health Drug Benefits. 2017. PMID: 28465764 Free PMC article.
-
The Effect of Pharmaceutical Innovation on Longevity: Patient Level Evidence from the 1996-2002 Medical Expenditure Panel Survey and Linked Mortality Public-use Files.Forum Health Econ Policy. 2013 Jan 1;16(1):1-33. doi: 10.1515/fhep-2012-0032. Forum Health Econ Policy. 2013. PMID: 31419866
Cited by
-
Simulation study to demonstrate biases created by diagnostic criteria of mental illnesses: major depressive episodes, dysthymia, and manic episodes.BMJ Open. 2020 Nov 10;10(11):e037022. doi: 10.1136/bmjopen-2020-037022. BMJ Open. 2020. PMID: 33172939 Free PMC article.
-
Diagnostic accuracy of symptoms for an underlying disease: a simulation study.Sci Rep. 2022 Aug 15;12(1):13810. doi: 10.1038/s41598-022-14826-2. Sci Rep. 2022. PMID: 35970855 Free PMC article.
-
Drug trends among non-institutionalized Canadians and the impact of data collection changes in the Canadian Health Measures Survey 2007 to 2015.PLoS One. 2019 Apr 12;14(4):e0214718. doi: 10.1371/journal.pone.0214718. eCollection 2019. PLoS One. 2019. PMID: 30978234 Free PMC article.
-
Stages of Biological Development across Age: An Analysis of Canadian Health Measure Survey 2007-2011.Front Public Health. 2018 Jan 11;5:355. doi: 10.3389/fpubh.2017.00355. eCollection 2017. Front Public Health. 2018. PMID: 29376046 Free PMC article.
References
-
- Lynn J, Adamson DM. Living well at the end of life. Adapting Health Care to Serious Chronic Illness in Old Age. Santa Monica, CA: RAND Health; (2003).
LinkOut - more resources
Full Text Sources
Other Literature Sources

