. 2017 Nov 1:4:185.
doi: 10.3389/fmed.2017.00185. eCollection 2017.

Expression of Mitochondrial-Encoded Genes in Blood Differentiate Acute Renal Allograft Rejection

Affiliations

Expression of Mitochondrial-Encoded Genes in Blood Differentiate Acute Renal Allograft Rejection

Silke Roedder et al. Front Med (Lausanne). .

Abstract

Despite potent immunosuppression, clinical and biopsy confirmed acute renal allograft rejection (AR) still occurs in 10-15% of recipients, ~30% of patients demonstrate subclinical rejection on biopsy, and ~50% of them can show molecular inflammation, all which increase the risk of chronic dysfunction and worsened allograft outcomes. Mitochondria represent intracellular endogenous triggers of inflammation, which can regulate immune cell differentiation, and expansion and cause antigen-independent graft injury, potentially enhancing the development of acute rejection. In the present study, we investigated the role of mitochondrial DNA encoded gene expression in biopsy matched peripheral blood (PB) samples from kidney transplant recipients. Quantitative PCR was performed in 155 PB samples from 115 unique pediatric (<21 years) and adult (>21 years) renal allograft recipients at the point of AR (n = 61) and absence of rejection (n = 94) for the expression of 11 mitochondrial DNA encoded genes. We observed increased expression of all genes in adult recipients compared to pediatric recipients; separate analyses in both cohorts demonstrated increased expression during rejection, which also differentiated borderline rejection and showed an increasing pattern in serially collected samples (0-3 months prior to and post rejection). Our results provide new insights on the role of mitochondria during rejection and potentially indicate mitochondria as targets for novel immunosuppression.

Keywords: acute rejection; biomarkers; gene expression analysis; kidney transplantation; mitochondria.


Figures

Figure 1
Figure 1
Mitochondrial genome regions studied in AR. Mitochondrial genes studied are numbered G1–G11 and colored by their location on structural genome complexes; numbers indicate the start and end base pairs: mt-7S/mt-D-loop (G1), and mt-12S (G11) represent ribosomal RNAs; mt-CYB (G2) the cytochrome b gene is located in the ubiquinol-cytochrome c reductase complex III; G3 (mt-ND6), G4 (mt-ND5), G9 (mt-ND2), G10 (mt-ND1) are sodium-ubiquinone oxidoredcutase chains (NADH; sodium dehydrogenase) located on Complex I (blue); mt-ATP6 (G5), and mt-ATP8 (G6) are adenosine-tri-phosphatases located on Complex V; cyclooxygenases mt-COII (G7) and mt-COI (G8) are located on Complex IV. G1, G2, G4–G11 are located on the outer, heavy DNA strand (OH), G3 is located on the inner, light DNA strand (OL). Black vertical lines represent transfer RNAs.
Figure 2
Figure 2
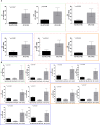
Mitochondrial gene expression during rejection in adult renal transplant recipients. Mitochondrial gene expression levels in peripheral blood samples from the adult cohort with matched biopsies without significant abnormalities (No-AR) were compared to samples with matched biopsies showing any signs of acute rejection (AR ≥ I, BL-AR) in the adult cohort; (A) expression levels of G1, G11, G2, G4, G5, and G8 were significantly increased in rejection (AR ≥ I plus BL-AR) compared to No-AR, (B) separating 5 BL-AR cases from AR ≥ I showed significantly higher expression in AR > I for 10 of the 11 genes studied (G1-G10, p ≤ 0.05). Mean plus SEM are shown for relative quantification of gene expression levels; p-Values were calculated using 2-sided Student’s t-test with Welch’s correction in case of unequal variance and p ≤ 0.05 were considered significant; frame colors indicate the structural complexes on the mitochondrial genome.
Figure 3
Figure 3
Mitochondrial gene expression in pediatric renal transplant recipients with BL-AR and AR ≥ I. Mitochondrial gene expression levels in peripheral blood samples from pediatric patients with matched biopsies without significant abnormalities (No-AR) were compared to samples with matched biopsies showing borderline rejection (BL-AR), and rejection grade I and higher (AR ≥ I); G2, G3, G4, G6, and G7 were significantly increased in AR ≥ I compared to No-AR and BL-AR. Mean plus SEM are shown for relative quantification of gene expression levels; p-values were calculated using 2-sided Student’s t-test with Welchs’s correction in case of unequal variances; p ≤ 0.05 were considered significant; frame colors indicate the structural complexes on the mitochondrial genome.
Figure 4
Figure 4
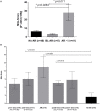
Peripheral mitochondrial gene expression can be summarized into a Mito-Score. (A) When summarized into a Mito-Score, the mitochondrial gene expression differentiated No-AR from BL-AR and AR ≥ I (No-AR vs. AR ≥ I, p = 0.026 and BL-AR vs. AR ≥ I, p = 0.011); (B) analysis of the Mito-Scores in serially collected samples revealed increased expression before and after a rejection. Serially collected samples were available from 17 adult patients. Samples were categorized according to their time of collection before and after an AR biopsyinto pre-1–3 months (n = 4, average time 43.5 ± 6.8 days), pre-0–1 months (n = 11, average time 9.6 ± 6.2 days), and into post-0–1 months (n = 6, average time 22.2 ± 5.6 days) and post 1–3 months (n = 5, average time 39.4 ± 6.2 days). Mito-Scores were compared to scores in matching samples at the point of No-AR (n = 5) by biopsy. Mito-Scores were significantly elevated in samples collected up to 1 month before and after the rejection when compared to the No-AR time-point. Mito-Scores are displayed as mean plus SEM; p-values were calculated using 2-sided Student’s t-test with Welch’s correction in case of unequal variances and p ≤ 0.05 was considered significant.

References

    1. Saat TC, van den Akker EK, IJzermans JNM, Dor FJMF, de Bruin RWF. Improving the outcome of kidney transplantation by ameliorating renal ischemia reperfusion injury: lost in translation? J Transl Med (2016) 14(1):20.10.1186/s12967-016-0767-2 - DOI - PMC - PubMed
    1. Salvadori M, Rosso G, Bertoni E. Update on ischemia-reperfusion injury in kidney transplantation: pathogenesis and treatment. World J Transplant (2015) 5(2):52–67.10.5500/wjt.v5.i2.52 - DOI - PMC - PubMed
    1. Mori DN, Kreisel D, Fullerton JN, Gilroy DW, Goldstein DR. Inflammatory triggers of acute rejection of organ allografts. Immunol Rev (2014) 258:132–44.10.1111/imr.12146 - DOI - PMC - PubMed
    1. Huntoon KM, Wang Y, Eppolito CA, Barbour KW, Berger FG, Shrikant PA, et al. The acute phase protein haptoglobin regulates host immunity. J Leukoc Biol (2008) 84(1):170–81.10.1189/jlb.0208100 - DOI - PMC - PubMed
    1. Shen H, Song Y, Colangelo CM, Wu T, Bruce C, Scabia G, et al. Haptoglobin activates innate immunity to enhance acute transplant rejection in mice. J Clin Invest (2012) 122(1):383–7.10.1172/JCI58344 - DOI - PMC - PubMed