. 2017 Nov 22;22(11):2030.
doi: 10.3390/molecules22112030.

The Rosiglitazone-Like Effects of Vitexilactone, a Constituent from Vitex trifolia L. in 3T3-L1 Preadipocytes

Affiliations

The Rosiglitazone-Like Effects of Vitexilactone, a Constituent from Vitex trifolia L. in 3T3-L1 Preadipocytes

Atsuyoshi Nishina et al. Molecules. .

Abstract

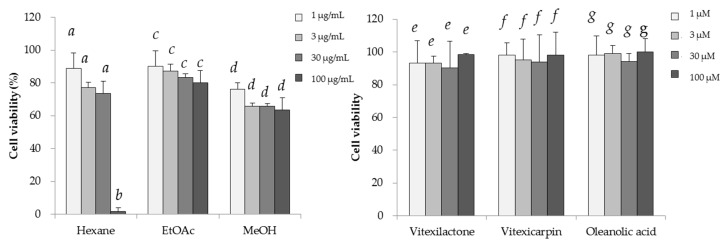
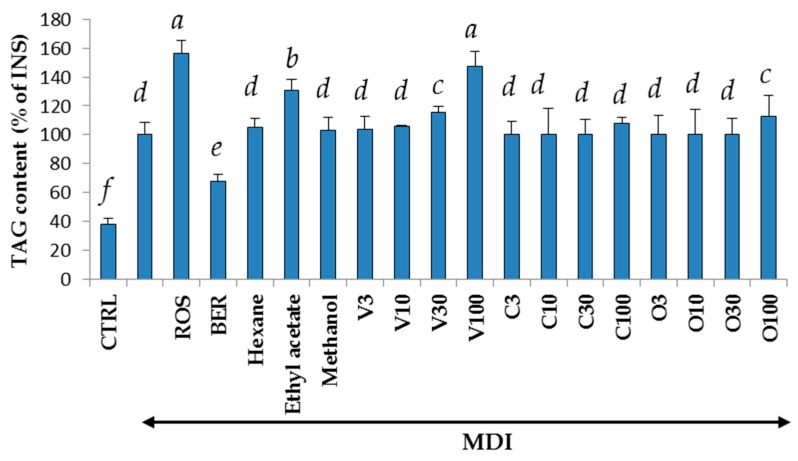
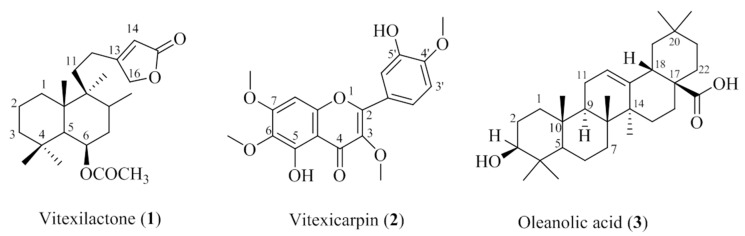
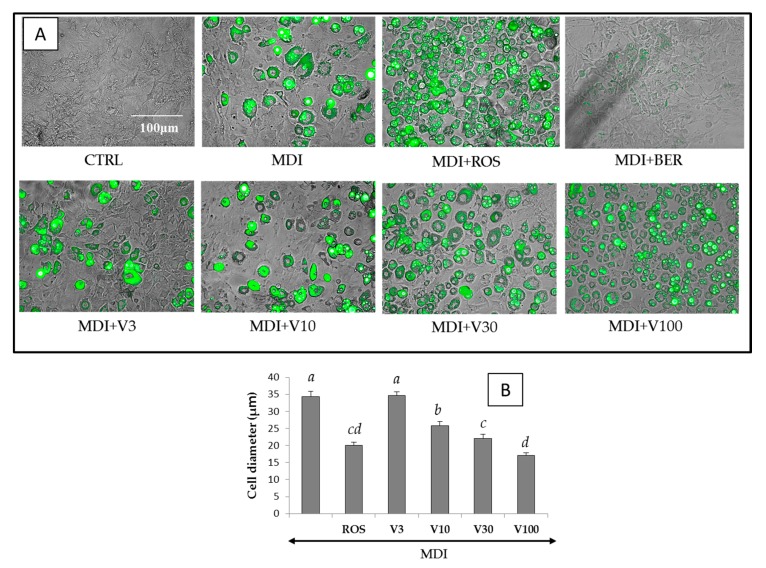
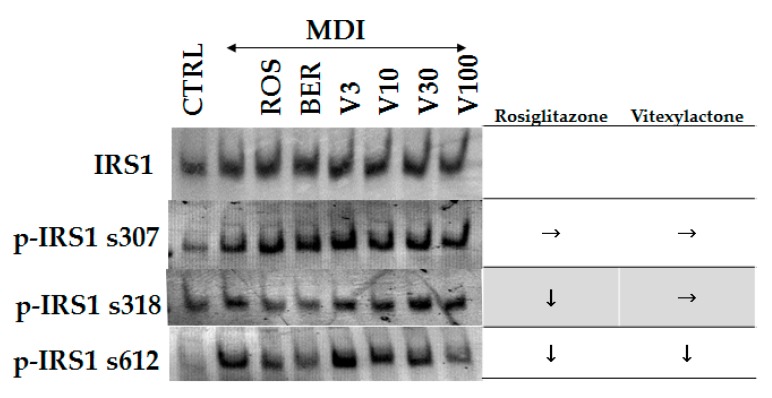
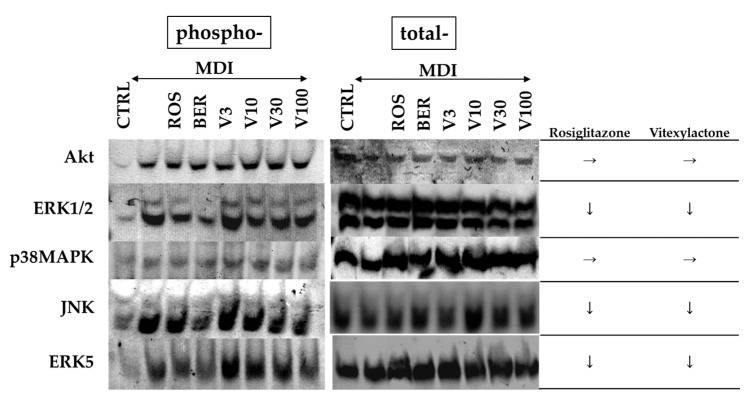
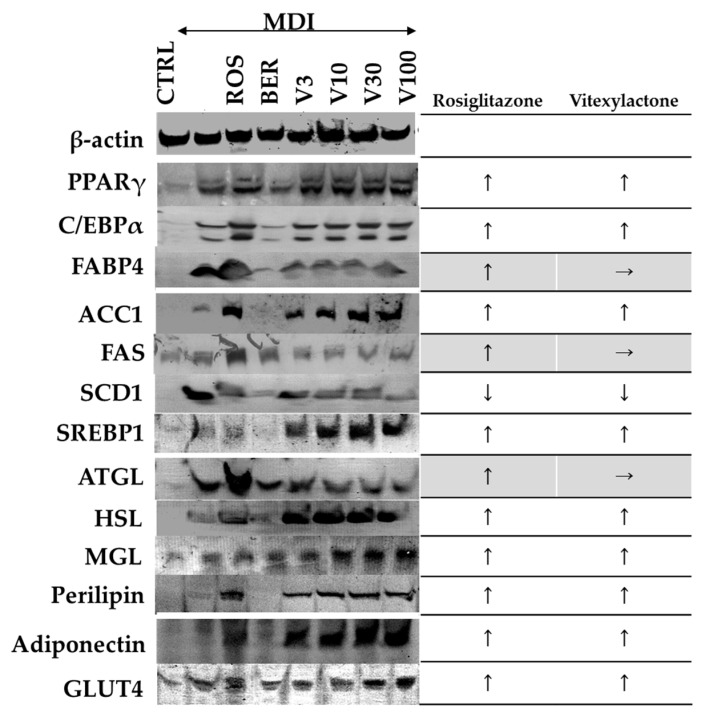
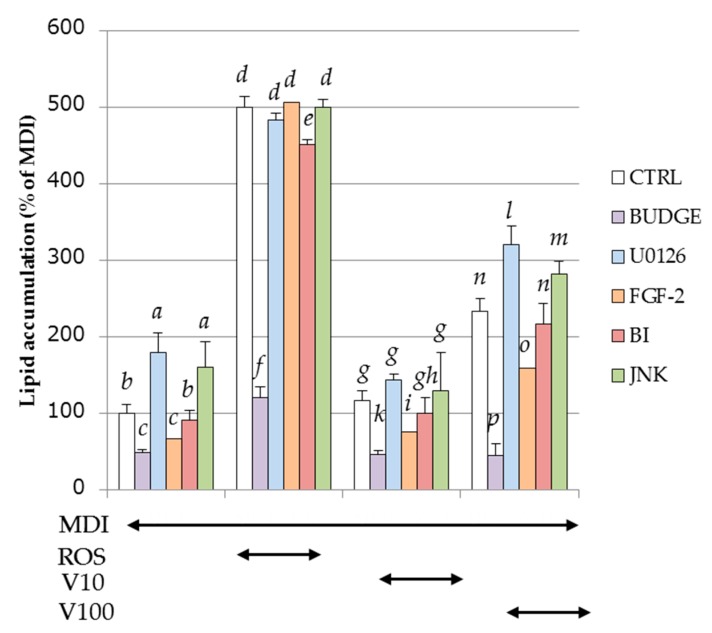
The increased number of patients with type 2 diabetes (T2D) has become a worldwide problem, and insulin sensitizers such as thiazolidinediones (TZDs) are used as therapeutic agents. We found that extracts of Vitex trifolia L. (V. trifolia), a medicinal plant from Myanmar, induced adipogenesis similar to rosiglitazone (ROS), which is a TZD, in 3T3-L1 preadipocytes. In the present study, we attempted to isolate from V. trifolia those compounds that showed ROS-like effects. Among the extracts of hexane, ethyl acetate, and methanol obtained from V. trifolia, the ethyl acetate extract with the strongest ROS-like effects was purified by various chromatographic methods to obtain three known compounds: vitexilactone (1), vitexicarpin (2) and oleanolic acid (3). Among the isolated compounds, the ROS-like action of 1 was the strongest. The effects of 1 on 3T3-L1 cells during adipogenesis were compared with those of ROS. Both 1 and ROS increased lipid accumulation, the expression of adiponectin and GLUT4 in the cell membrane and decreased both the size of adipocytes and the phosphorylation of IRS-1, ERK1/2 and JNK in 3T3-L1 cells. In contrast, unlike ROS, the induction of proteins involved in lipogenesis was partial. ROS-like effects of 1 in 3T3-L1 cells were suppressed by the addition of bisphenol A diglycidyl ether (BADGE), one of a peroxisome proliferator-activated receptor γ (PPARγ) antagonists, suggesting that the action of 1 on adipocytes is mediated by PPARγ. From the results of the present study, it can be concluded that 1 is a novel insulin sensitizer candidate.

Keywords: Vitex trifolia L.; adipogenesis; lipogenesis; lipolysis; rosiglitazone; vitexilactone.


Conflict of interest statement

The authors declare no conflict of interest.

Figures

Figure 1
Figure 1
Cytotoxic effects of the three extracts and three compounds isolated from V. trifolia in 3T3-L1 cells. Data are expressed as the mean ± SD from three independent experiments. The same letters indicate that there are no differences between those groups, and different letters indicate significant differences (p < 0.05).
Figure 2
Figure 2
The effects of the three extracts and three compounds isolated from V. trifolia on triglycerol levels in 3T3-L1 cells. The 3T3-L1 cells were cultured in 24-well plates and differentiated under the conditions described in the materials and methods section for each compound. Undifferentiated cells, cells with the addition of the MDI mixture (a mixture of 0.5 mM 3-isobutyl-1-methylxanthine (M), 0.1 μM dexamethasone (D), and 2 μM insulin (I)), rosiglitazone, berberine, vitexilactone, vitexicarpin, and oleanolic acid are indicated by CTRL, MDI, ROS, BER, V, C, and O, respectively. Numbers with V, C, and O were concentration (μM) of each compound. On day 8 of culturing, the medium was removed, and cells were lysed using Ripa buffer. The triglycerol levels were determined by the Wako Triglycerol E-test (Wako Pure Chemicals, Osaka, Japan). Data are presented as the mean ± SD from three independent experiments. The same letters indicate that there are no differences between those groups, and different letters indicate significant differences (p < 0.05).
Figure 3
Figure 3
Compounds isolated from V. trifolia.
Figure 4
Figure 4
Merged phase differences and fluorescent images and the diameter of differentiated 3T3-L1 cells on day 8 with reference compounds or vitexilactone of various concentrations. The 3T3-L1 cells were cultured in 24-well plates and differentiated with DMI mixture and each compound under the conditions described in the Materials and Methods section. Fluorescent staining of intracellular lipids was accomplished by adding BODIPY 493/503 to the medium. Undifferentiated cells, cells with the addition of MDI (a mixture of 0.5 mM 3-isobutyl-1-methyl xanthine (M), 0.1 μM dexamethasone (D), and 2 μM insulin (I)), rosiglitazone, berberine, and vitexilactone are indicated by CTRL, MDI, ROS, BER, and V, respectively. (A) Cell diameters were determined using ImageJ. Data are presented as the mean ± SD from 100 cells of three independent pictures. The same letters indicate that there are no differences between those groups, and different letters indicate significant differences (p < 0.05) (B).
Figure 5
Figure 5
The effects of each compound on the phosphorylation of IRS1 in 3T3-L1 cells during 30 min after the addition of each compound. Protein levels were measured by electroblotting. Undifferentiated cells, cells with the addition of MDI (a mixture of 0.5 mM 3-isobutyl-1-methyl- xanthine (M), 0.1 μM dexamethasone (D), and 2 μM insulin (I)), rosiglitazone, berberine, and vitexilactone are indicated by CTRL, MDI, ROS, BER, and V, respectively. → and ↓ represent no change or down-regulation, respectively.
Figure 6
Figure 6
The effects of each compound on the phosphorylation of signal transduction-related kinases in 3T3-L1 cells 30 min after the addition of each compound. Protein levels were measured by electroblotting. Undifferentiated cells, cells with the addition of MDI (a mixture of 0.5 mM 3-isobutyl-1-methylxanthine (M), 0.1 μM dexamethasone (D), and 2 μM insulin (I)), rosiglitazone, berberine, and vitexilactone are indicated by CTRL, MDI, ROS, BER, and V, respectively. → and ↓ represent no change or down-regulation, respectively.
Figure 7
Figure 7
The effects of each compound on adipogenesis-related proteins, adiponectin, and, GLUT4 levels in 3T3-L1 cells on day 8. The 3T3-L1 cells were cultured in 6-well plates and differentiated with DMI mixture with or without each compound under the conditions described in the Materials and Methods section and subsequently lysed with lysis buffer. Cell lysates were collected using a cell scraper and centrifuged at 15,000× g for 30 min at 4 °C. The supernatant was collected and the overall protein concentration was determined by a Protein Assay Reagent Kit (Cytoskeleton, Denver, CO, USA) with BSA as the standard. To detect GLUT4, membrane protein was extracted using Plasma Membrane Protein Extraction Kit according to the instructions of the manufacturer. Protein levels were measured by electroblotting. →, ↑ and ↓ represent no change, up- or down-regulation, respectively.
Figure 8
Figure 8
The effects of each inhibitor on triglycerol levels in 3T3-L1 cells during adipogenesis. Cells were treated with the condition described in the text. On day 8 of culturing, the triglycerol levels were determined by the Wako Triglycerol E-test (Wako). Data are presented as the mean ± SD from three independent experiments. The same letters indicate that there are no differences between those groups, and different letters indicate significant differences (p < 0.05). Undifferentiated cells, cells with the addition of MDI (a mixture of 0.5 mM 3-isobutyl-1-methylxanthine (M), 0.1 μM dexamethasone (D), and 2 μM insulin (I)), rosiglitazone, vitexilactone, BIX02188, and JNK inhibitor are indicated by CTRL, MDI, ROS, V, BI and, JNK, respectively.

Similar articles

Cited by

References

    1. Jacobson A.M., de Groot M., Samson J.A. The evaluation of two measures of quality of life in patients with type I and type II diabetes. Diabetes Care. 1994;17:267–274. doi: 10.2337/diacare.17.4.267. - DOI - PubMed
    1. Xu H., Barnes G.T., Yang Q., Tan G., Yang D., Chou C.J., Sole J., Nichols A., Ross J.S., Tartaglia L.A., et al. Chronic inflammation in fat plays a crucial role in the development of obesity-related insulin resistance. J. Clin. Investig. 2003;112:1821–1830. doi: 10.1172/JCI200319451. - DOI - PMC - PubMed
    1. Kahn S.E., Hull R.L., Utzschneider K.M. Mechanisms linking obesity to insulin resistance and type 2 diabetes. Nature. 2006;444:840–846. doi: 10.1038/nature05482. - DOI - PubMed
    1. Lehmann J.M., Moore L.B., Smith-Oliver T.A., Wilkison W.O., Willson T.M., Kliewer S.A. An antidiabetic thiazolidinedione is a high affinity ligand for peroxisome proliferator-activated receptor gamma (PPAR gamma) J. Biol. Chem. 1995;270:12953–12956. doi: 10.1074/jbc.270.22.12953. - DOI - PubMed
    1. Lo Furno D., Graziano A.C., Avola R., Giuffrida R., Perciavalle V., Bonina F., Mannino G., Cardile V. A Citrus Bergamia Extract Decreases Adipogenesis and Increases Lipolysis by Modulating PPAR Levels in Mesenchymal Stem Cells from Human Adipose Tissue. PPAR Res. 2016;2016:4563815. doi: 10.1155/2016/4563815. - DOI - PMC - PubMed

MeSH terms