. 2018 Jan 9;46(1):362-386.
doi: 10.1093/nar/gkx1120.

Identification of diverse target RNAs that are functionally regulated by human Pumilio proteins

Affiliations

Identification of diverse target RNAs that are functionally regulated by human Pumilio proteins

Jennifer A Bohn et al. Nucleic Acids Res. .

Abstract

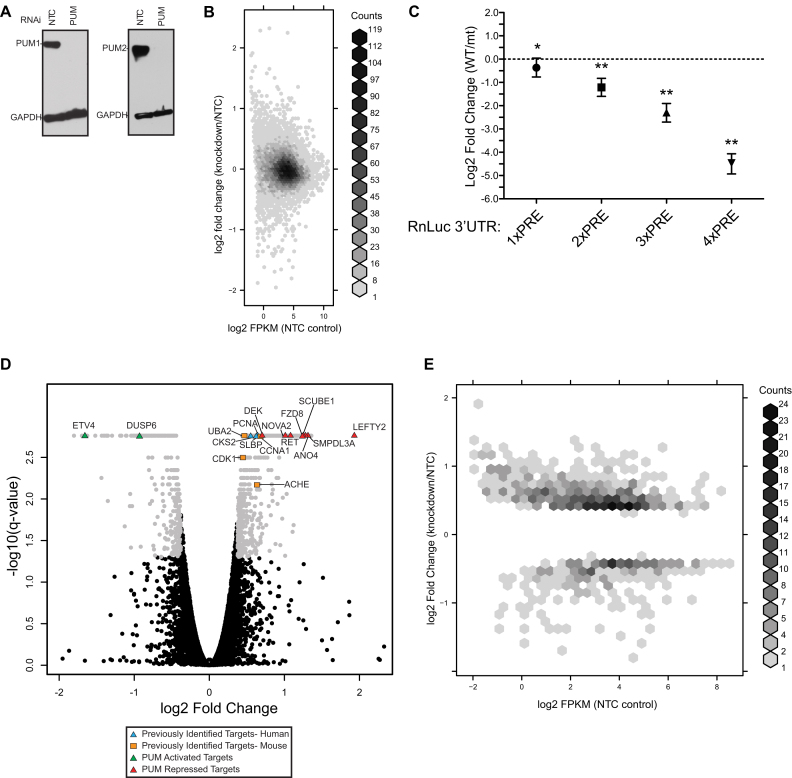
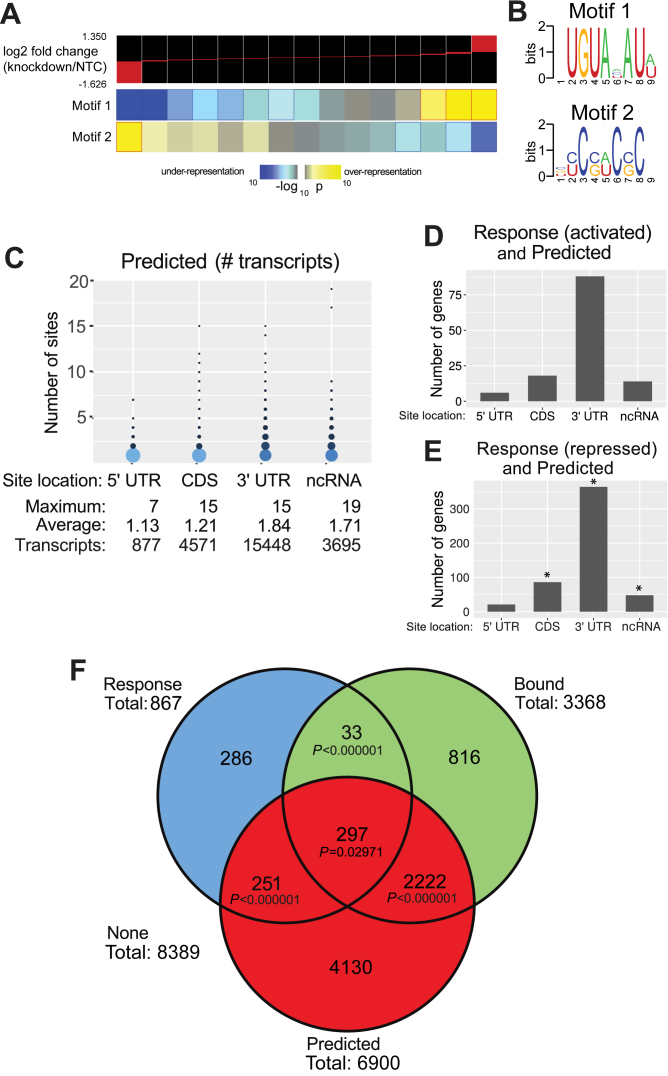
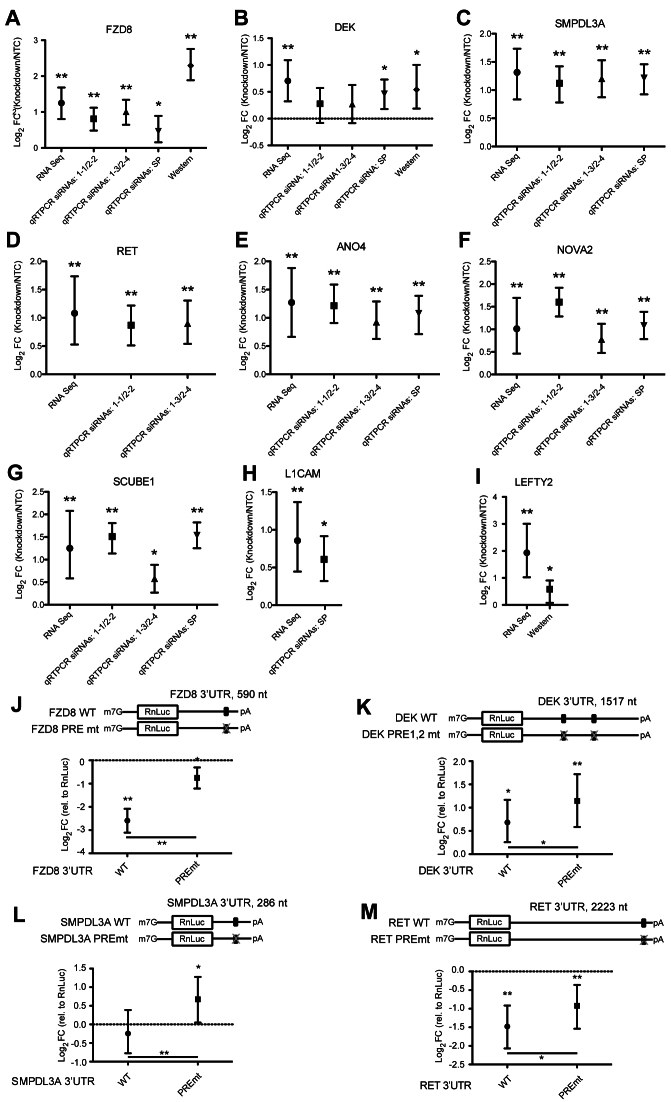
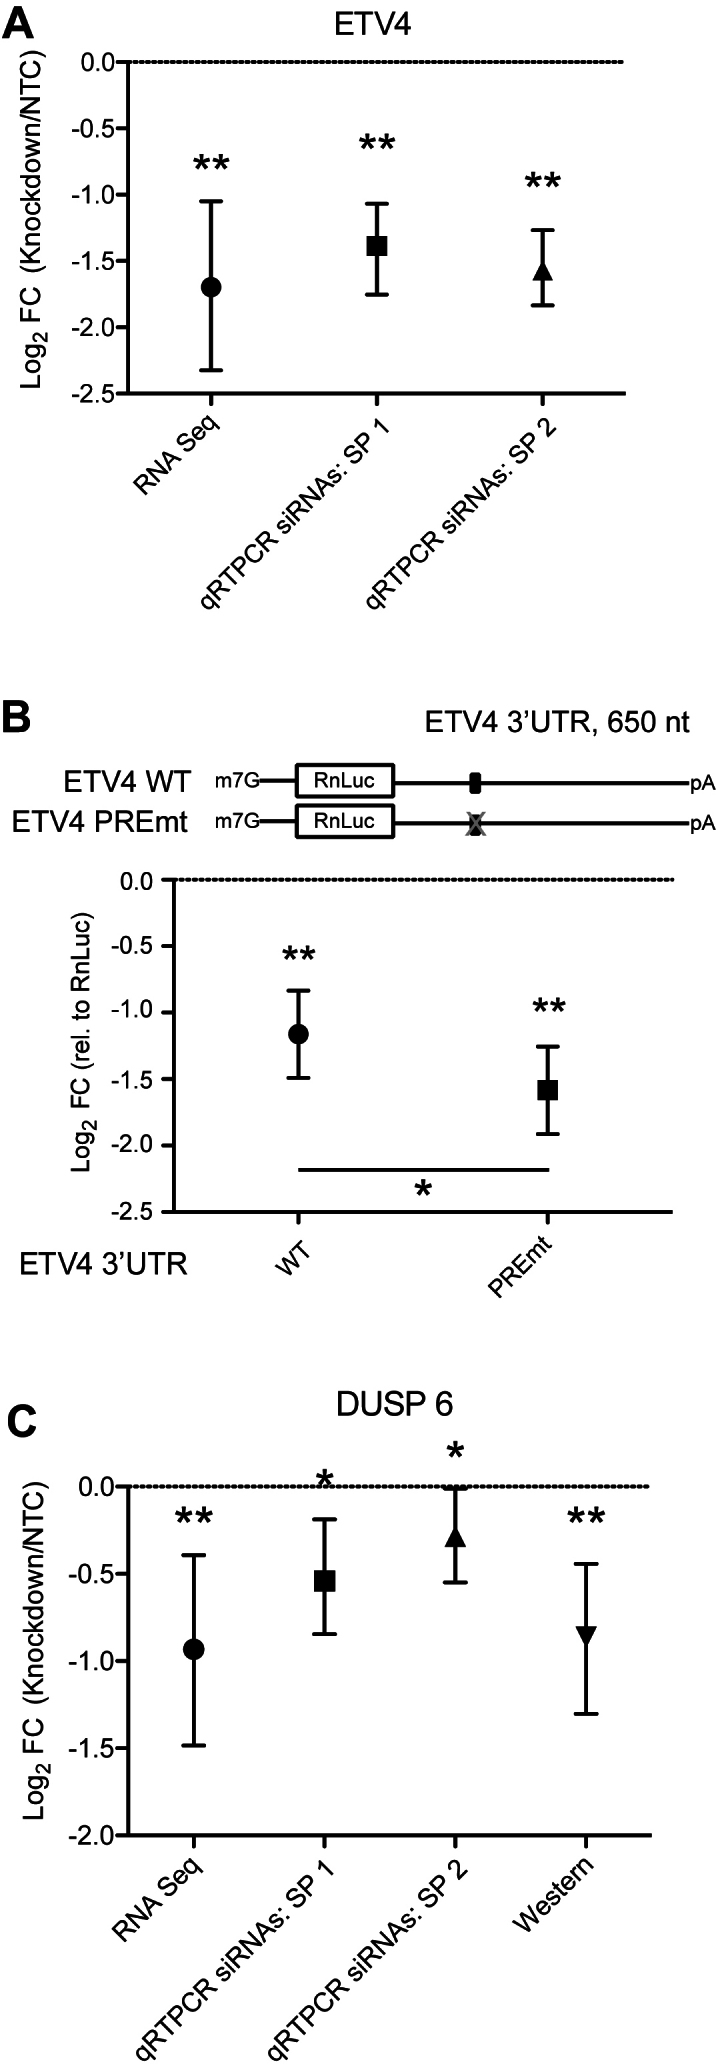
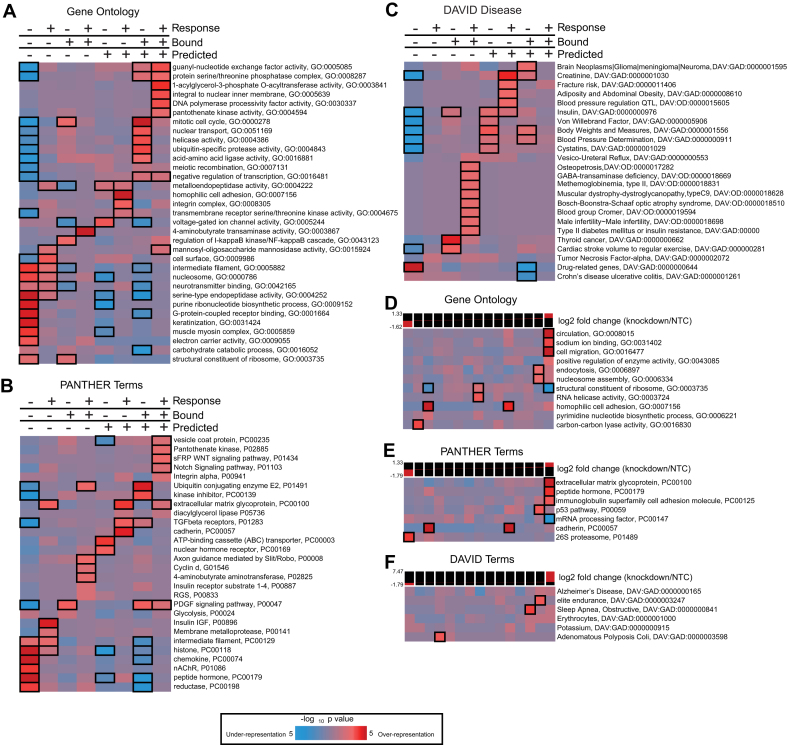
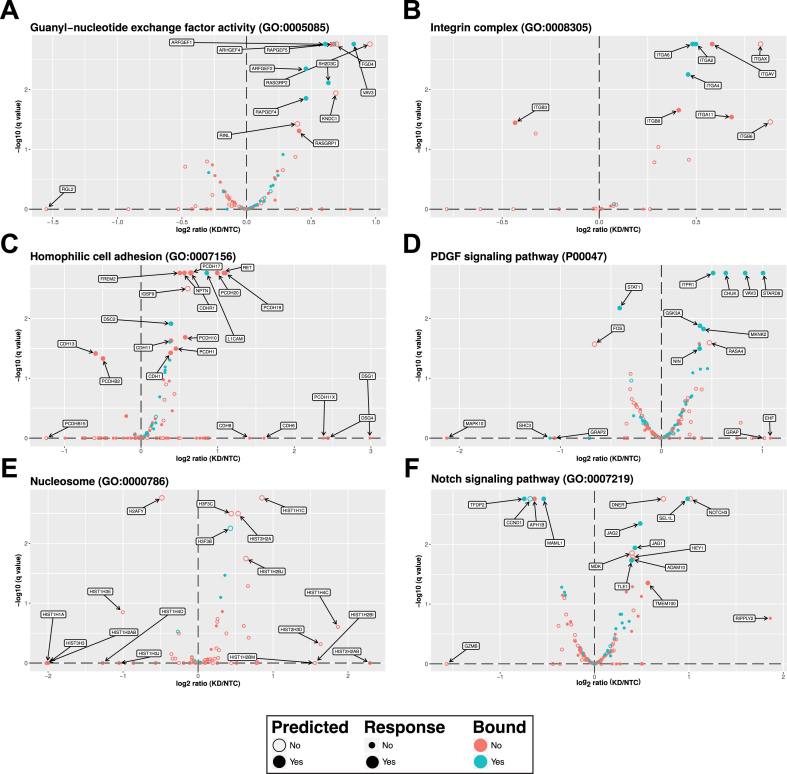
Human Pumilio proteins, PUM1 and PUM2, are sequence specific RNA-binding proteins that regulate protein expression. We used RNA-seq, rigorous statistical testing and an experimentally derived fold change cut-off to identify nearly 1000 target RNAs-including mRNAs and non-coding RNAs-that are functionally regulated by PUMs. Bioinformatic analysis defined a PUM Response Element (PRE) that was significantly enriched in transcripts that increased in abundance and matches the PUM RNA-binding consensus. We created a computational model that incorporates PRE position and frequency within an RNA relative to the magnitude of regulation. The model reveals significant correlation of PUM regulation with PREs in 3' untranslated regions (UTRs), coding sequences and non-coding RNAs, but not 5' UTRs. To define direct, high confidence PUM targets, we cross-referenced PUM-regulated RNAs with all PRE-containing RNAs and experimentally defined PUM-bound RNAs. The results define nearly 300 direct targets that include both PUM-repressed and, surprisingly, PUM-activated target RNAs. Annotation enrichment analysis reveal that PUMs regulate genes from multiple signaling pathways and developmental and neurological processes. Moreover, PUM target mRNAs impinge on human disease genes linked to cancer, neurological disorders and cardiovascular disease. These discoveries pave the way for determining how the PUM-dependent regulatory network impacts biological functions and disease states.


Figures

Figure 1.
Figure 1.
Transcriptome-wide analysis identifies PUM-regulated transcripts in HEK293 cells. (A) Western blot detection of PUM1 and PUM2 in HEK293 cells treated with PUM1 and PUM2 (PUM) or non-target control (NTC) siRNAs. Western blot detection of GAPDH served as a control for equivalent loading of the sodium dodecyl sulphate-polyacrylamide gel electrophoresis (SDS-PAGE) gel. (B) Density plot comparing the observed log2 fold change values from RNA-seq experiments to the overall abundance of transcripts for each corresponding gene in the NTC control case. (C) Effects of increasing numbers of wild-type (WT) PRE sites relative to mutated PRE (PREmt) sites in a minimal luciferase reporter construct. For this and subsequent figures showing luciferase or qRT-PCR-based assays, we analyzed the data using a hierarchical Bayesian model (see ‘Materials and Methods’ section for details) to make optimal use of the experimental information available; observed data are shown as points and the error bars define a 95% credible interval. We mark as significant (*) any case with a 95% posterior probability of having the observed sign, and as highly significant (**) any case with a 95% chance of showing at least a 1.3-fold change (that is, exceeding the magnitude of the significance threshold used in analyzing our RNA-seq data). N.b. the 1× PRE case shown in this panel does not reach the threshold for being highly significant, since its observed value was used to define that very threshold. (D) Volcano plot of log2 fold change (PUM knockdown relative to NTC) versus adjusted P-values for all gene expression levels. Several specific classes of genes are highlighted as described in the legend, including previously reported PUM targets from mouse and human and PUM repressed and activated targets that are validated in this study. (E) Density plot comparing log2 fold change values to expression levels (plotted as log2 FPKM in the NTC control samples) for only the genes that showed significant changes >1.3-fold in magnitude in response PUM1/2 knockdown.
Figure 2.
Figure 2.
The PRE is enriched in PUM-regulated transcripts. (A) Identification of RNA-sequence motifs significantly correlated with changes in transcript abundance using FIRE. The top of the panel shows the distribution of transcript log2 fold changes in each of a set of discretized bins, and below the enrichment or depletion of the four identified motifs in each bin is shown. Significant enrichment is observed for Motif 1 (which is highly identical to documented PUM1 and PUM2 binding sites, the PRE) in strongly PUM-repressed transcripts, and for Motif 2 in transcripts that decrease in abundance upon PUM knockdown. (B) Sequence logos for Motifs 1 and 2 identified by the analysis in panel A. (C) Predictions of putative PUM target transcripts. The distribution of the number and location of predicted PREs at various locations within all annotated transcripts in UCSC genome version hg19. Indicated locations are 5′ and 3′ UTRs and coding sequence (CDS) and non-protein coding RNAs (ncRNAs). Transcript numbers include all annotated transcript isoforms. Circles in the plot have areas proportional to the weight of that point in the distribution of all transcripts with at least one PRE in the corresponding location. (D) Number of genes that we observed to be activated by PUM1 and PUM2 that have at least one PRE in each indicated location. (E) Number of genes in the set that we observed to be repressed by PUM1 and PUM2 that have at least one PRE in each location. Stars here indicate cases with significantly enriched overlap between the presence of a PRE and membership in the Response dataset (P < 0.05, χ2 test). (F) Overlaps between our ‘Response’, ‘Predicted’ and ‘Bound’ datasets. Pairwise overlap comparisons show P-values based on χ2 tests; the three way overlap shows the Woolf test for the null hypothesis of homogeneous conditional probabilities (note that for the purposes of the analysis in this panel, we only considered genes that were part of the set with overlapping names between the genomic annotations used for analysis of the RNA-seq data and transcript boundaries, which is why only 867 Response genes are shown). ′None′ indicates the number of genes that were not included in any of the three categories.
Figure 3.
Figure 3.
Validation of PUM-mediated repression of direct target mRNAs. (A) Change in levels of FZD8 mRNA or protein upon PUM1 and PUM2 knockdown, assessed using the indicated methods including RNA seq or qRT-PCR using three RNAi conditions, or by quantitative western blotting. PUM knockdown was achieved using individual siRNAs (PUM1-1 or PUM1-3; PUM2-2 or PUM2-4) or Smart Pools (SP) of four specific siRNAs to each target. Error bars indicate 95% confidence intervals (RNA-seq) or credible intervals (other assays) obtained as described in ‘Materials and Methods’ section. We mark values with a posterior probability of change in the indicated direction >95% with one asterisk (*), and those with a posterior probability >95% of passing the 1.3-fold change cut-off applied to our RNA-seq data with two asterisks (**). (B) Analysis of DEK mRNA and protein levels in response to PUM1 and PUM2 knockdown using RNA-seq, qRT-PCR and quantitative western blot assays. (C) Analysis of SMPDL3A mRNA levels in response to PUM1 and PUM2 knockdown using RNA-seq or qRT-PCR assays. (D) Analysis of RET mRNA levels in response to PUM1 and PUM2 knockdown using RNA-seq or qRT-PCR assays. (E) Analysis of ANO4 mRNA levels in response to PUM1 and PUM2 knockdown using RNA-seq or qRT-PCR assays. (F) Analysis of NOVA2 mRNA levels in response to PUM1 and PUM2 knockdown using RNA-seq or qRT-PCR assays. (G) Analysis of SCUBE1 mRNA levels in response to PUM1 and PUM2 knockdown using RNA-seq or qRT-PCR assays. (H) Analysis of L1CAM transcript levels in response to PUM1 and PUM2 knockdown using RNA-seq and qRT-PCR. (I) Analysis of LEFTY2 transcript and protein levels in response to PUM1 and PUM2 knockdown, assessed by RNA-seq and quantitative western blotting. (J) In vivo reporter assay testing the effects of a PRE mutation in the 3′ UTR of FZD8. Shown are log2 fold change values in RnLuc activity relative to an RnLuc control for cells transfected with RnLuc bearing the FZD8 3′ UTR WT or the same sequence with a PREmt. Significance stars follow the convention in panel A, and are shown relative to RnLuc itself (above each symbol) or between the WT and PREmt cases (crossbar). (K) Reporter gene analysis of PRE-mediated regulation by the DEK 3′ UTR, comparing the regulatory activities of the two WT and mutant PREs in the DEK 3′ UTR. (L) Reporter gene analysis of PRE-mediated regulation by the SMPDL3A 3′ UTR, comparing the regulatory activities of WT and mutant PRE SMPLDL3A 3′ UTRs. (M) Reporter gene analysis of PRE-mediated regulation by the RET 3′ UTR, comparing the regulatory activities of WT and mutant PRE RET 3′ UTRs.
Figure 4.
Figure 4.
Validation of PUM-mediated activation of direct target mRNAs. (A) Comparison of ETV4 transcript levels in response to PUM knockdown assessed via RNA-seq or qRT-PCR assays with two independent experiments. Error bars indicate 95% confidence intervals (RNA-seq) or credible intervals (other assays) obtained as described in ‘Materials and Methods’ section. We mark values with a posterior probability of change in the indicated direction >95% with one asterisk (*), and those with a posterior probability >95% of passing the 1.3-fold change cut-off applied to our RNA-seq data with two asterisks (**). (B) Reporter gene analysis comparing the effect of WT or mutant PRE in the ETV4 3′ UTR on expression of the RnLuc reporter. Significance stars follow the convention in panel A, and are shown relative to RnLuc itself (above each symbol) or between the WT and PREmt cases (crossbar). (C) Comparison of the effects of PUM knockdown on DUSP6 transcript and protein levels assessed by RNA-seq, qRT-PCR and quantitative western blot.
Figure 5.
Figure 5.
Enrichment of ontology terms among subsets of PUM targets. (A) List of GO terms showing significant mutual information with membership in the Regulated, Bound and Predicted gene sets discussed in the text, calculated using iPAGE. The color of each cell shows the P-value for significance of the enrichment (red) or depletion (blue) at that cell, scale is shown at the bottom of the figure; black bordered cells individually show P-values < 0.05 after Bonferroni correction across their row. The plotting and highlighting conventions described here apply to all panels of the Figure. (B) As in panel A, for PANTHER terms. (C) DAVID disease annotations showing significant mutual information with membership in the Regulated, Bound and Predicted sets. (D) GO terms showing significant mutual information with the observed log2 fold changes upon PUM knockdown, measured in our RNA-seq dataset. The log2 fold changes were discretized into 15 equally populated bins, with expression levels shown above the plot. (E) As in panel D, for PANTHER terms. (F) As in panel D, for DAVID Disease terms.
Figure 6.
Figure 6.
Overview of transcript level behavior for enriched PUM-regulated gene term members. In each panel, we show volcano plots for all members of select enriched Gene Ontology terms identified in our iPAGE analysis; membership in the Predicted, Response and Bound sets discussed in the text are indicated by fill state, point size and color, respectively, as shown in the legend at the bottom. We individually label each gene that either passes our RNA-seq significance thresholds, or which showed >2-fold change in transcript level or q-value < 0.01 regardless of the dual significance criteria. Panels A–F, in order, show results for: (A) guanyl-nucleotide exchange factor activity (GO:0005085), (B) integrin complex (GO:0008305), (C) homophilic cell adhesion (GO:0007156), (D) PDGF signaling pathway (PANTHER P00047), (E) nucleosome (GO:0000786) or (F) Notch signaling pathway (GO:0007219).

Similar articles

Cited by

References

    1. Gerstberger S., Hafner M., Tuschl T. A census of human RNA-binding proteins. Nat. Rev. Genet. 2014; 15:829–845. - PMC - PubMed
    1. Rajewsky N. microRNA target predictions in animals. Nat. Genet. 2006; 38(Suppl):S8–S13. - PubMed
    1. Marguerat S., Bahler J. RNA-seq: from technology to biology. Cell Mol. Life Sci. 2010; 67:569–579. - PMC - PubMed
    1. Wickens M., Bernstein D.S., Kimble J., Parker R. A PUF family portrait: 3΄UTR regulation as a way of life. Trends Genet. 2002; 18:150–157. - PubMed
    1. Zhang B., Gallegos M., Puoti A., Durkin E., Fields S., Kimble J., Wickens M.P. A conserved RNA-binding protein that regulates sexual fates in the C. elegans hermaphrodite germ line. Nature. 1997; 390:477–484. - PubMed

Publication types