. 2018 Feb 1;159(2):647-664.
doi: 10.1210/en.2017-00793.

Estradiol Protects Proopiomelanocortin Neurons Against Insulin Resistance

Affiliations

Estradiol Protects Proopiomelanocortin Neurons Against Insulin Resistance

Jian Qiu et al. Endocrinology. .

Abstract

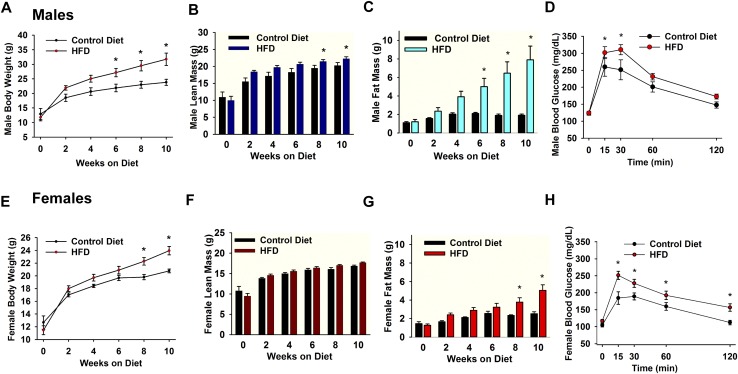
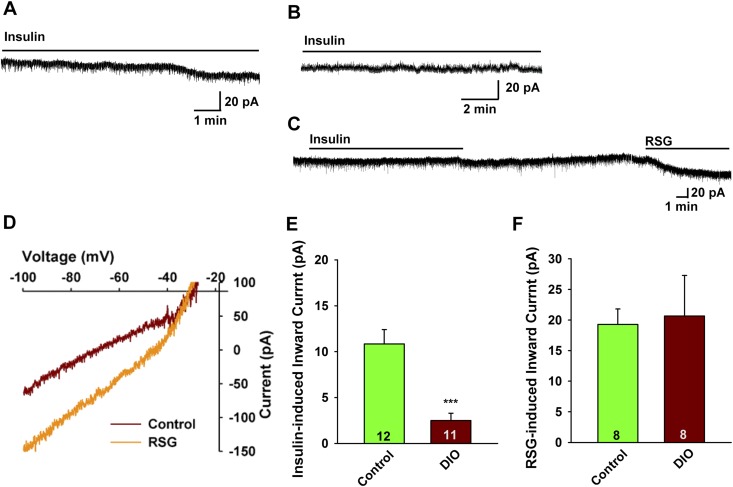
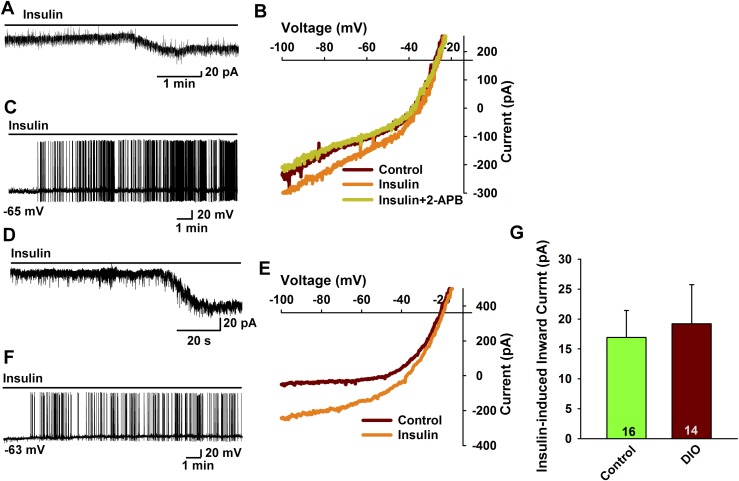
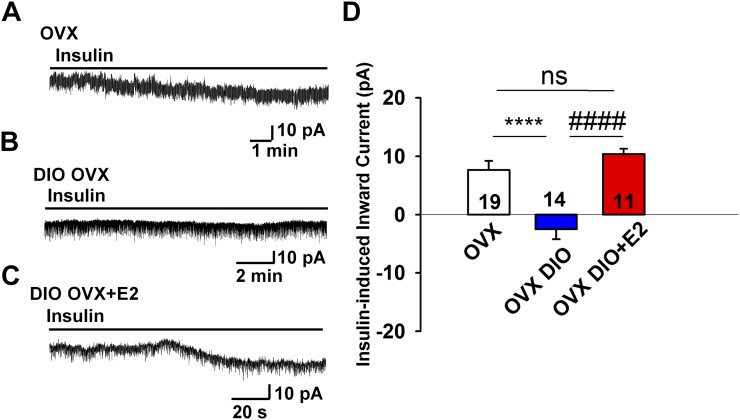
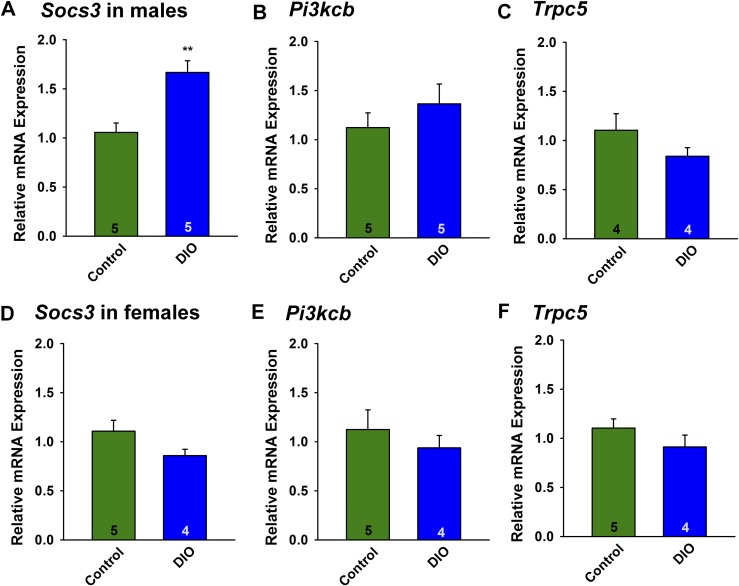
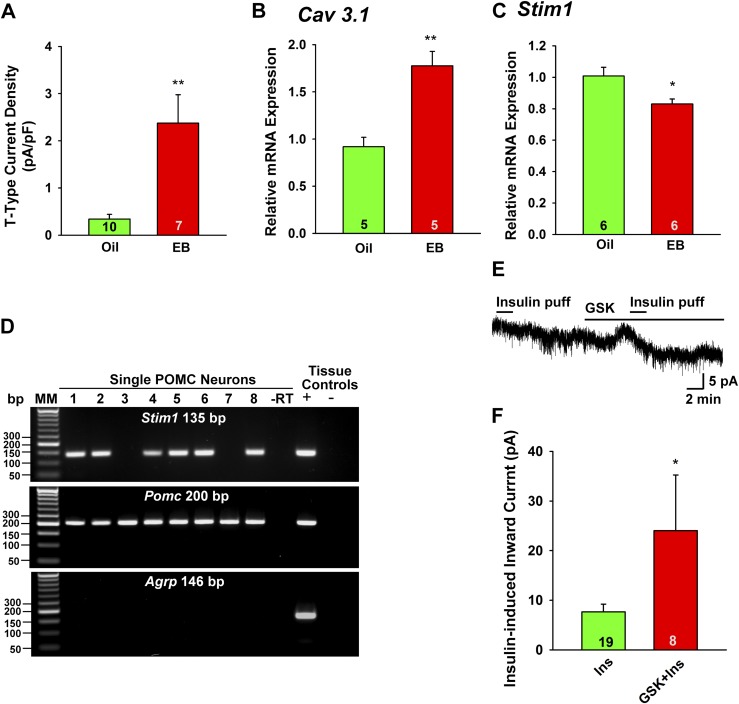
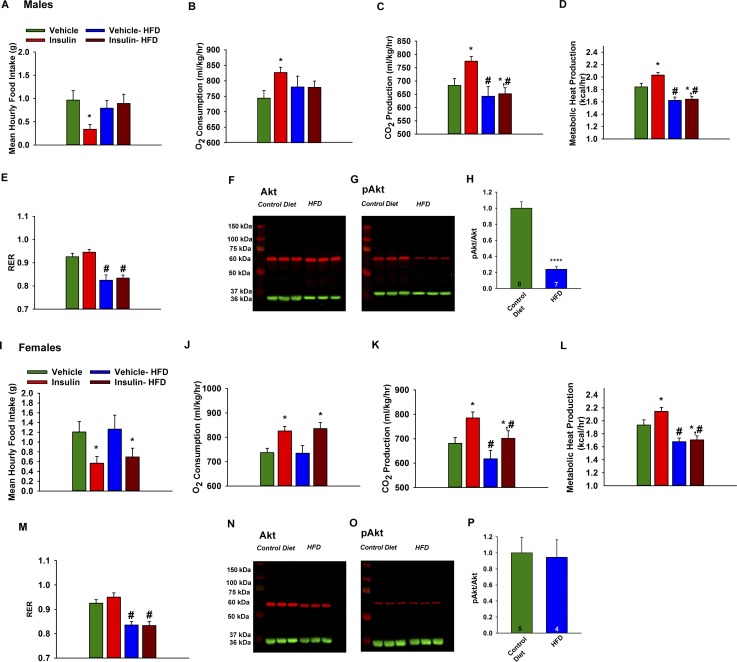
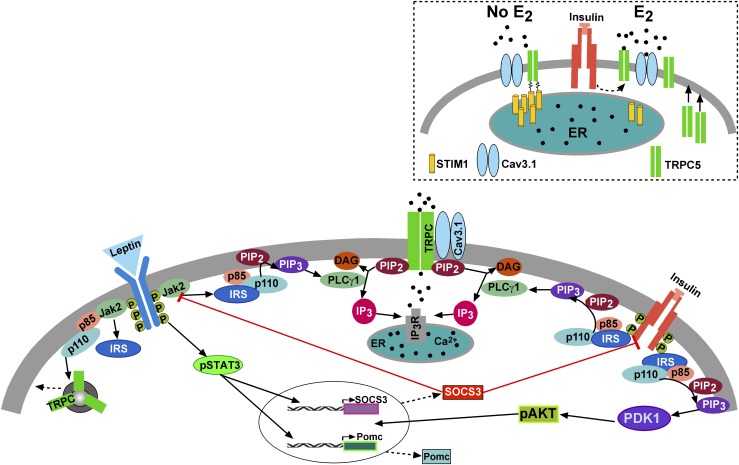
Insulin resistance is at the core of the metabolic syndrome, and men exhibit a higher incidence of metabolic syndrome than women in early adult life, but this sex advantage diminishes sharply when women reach the postmenopausal state. Because 17β-estradiol (E2) augments the excitability of the anorexigenic proopiomelanocortin (POMC) neurons, we investigated the neuroprotective effects of E2 against insulin resistance in POMC neurons from diet-induced obese (DIO) female and male mice. The efficacy of insulin to activate canonical transient receptor potential 5 (TRPC5) channels and depolarize POMC neurons was significantly reduced in DIO male mice but not in DIO female mice. However, the insulin response in POMC neurons was abrogated in ovariectomized DIO females but restored with E2 replacement. E2 increased T-type calcium channel Cav3.1 messenger RNA (mRNA) expression and whole-cell currents but downregulated stromal-interaction molecule 1 mRNA, which rendered POMC neurons more excitable and responsive to insulin-mediated TRPC5 channel activation. Moreover, E2 prevented the increase in suppressor of cytokine signaling-3 mRNA expression with DIO as seen in DIO males. As proof of principle, insulin [intracerebroventricular injection into the third ventricle (ICV)] decreased food intake and increased metabolism in female but not male guinea pigs fed a high-fat diet. The uncoupling of the insulin receptor from its downstream effector system was corroborated by the reduced expression of phosphorylated protein kinase B in the arcuate nucleus of male but not female guinea pigs following insulin. Therefore, E2 protects female POMC neurons from insulin resistance by enhancing POMC neuronal excitability and the coupling of insulin receptor to TRPC5 channel activation.


Figures

Figure 1.
Figure 1.
Male and female mice on HFD become obese and glucose intolerant. (A–C) Male PomcEGFP mice were maintained on a HFD (45% fat) or a control grain-based diet for 10 weeks. (A) The HFD caused a significant weight gain and DIO over the 10-week period, which was significantly different from controls by week 6 [two-way ANOVA: main effect of treatment (F(1,54) = 23.743, P < 0.001), main effect of time (F(5,54) = 25.419, P < 0.001) and interaction (F(5,54) = 2.031, P = 0.089); control, n = 4, DIO mice, n = 7; post hoc Bonferroni test, *P < 0.05]. (B and C) Lean mass does not include bone and fluids within organs. Data are expressed in total grams. Total body fat was measured by nuclear magnetic resonance. The (B) lean and (C) fat content between groups became significant different at 8 and 6 weeks, respectively [two-way ANOVA for B: main effect of treatment (F(1,52) = 13.496, P < 0.001), main effect of time (F(5,52) = 39.497, P < 0.001) and interaction (F(5,52) = 1.252, P = 0.299); control, n = 4, DIO mice, n = 7; post hoc Bonferroni test, *P < 0.05; two-way ANOVA for C: treatment (F(1,52) = 26.962, P < 0.001), time (F(5,52) = 4.617, P = 0.001) and interaction (F(5,52) = 3.081, P = 0.016); control, n = 4, DIO mice, n = 7; post hoc Bonferroni test, *P < 0.05]. Consistent with the EchoMRI data, the perigonadal fat pad in DIO males was significantly heavier as compared with the control diet males (1982 ± 120 mg, n = 9 vs 405 ± 65 mg, n = 13, unpaired two-tailed t test, t(20) = 12.42, P < 0.0001; data not shown). (E–G) Female PomcEGFP mice were maintained on an HFD (45% fat) or a control grain-based diet. (E) The HFD caused a significant weight gain and DIO over the 10-week period, which was significantly different than controls by week 8 [two-way ANOVA: main effect of treatment (F(1,101) = 14.849, P < 0.001), main effect of time (F(5,101) = 76.846, P < 0.001) and interaction (F(5,101) = 3.091, P = 0.012); control, n = 9, DIO mice, n = 11; post hoc Bonferroni test, *P < 0.05]. (F and G) The body fat content between groups became significant different at 8 weeks. Two-way ANOVA for the (F) lean measurements: main effect of treatment (F(1,96) = 2.322, P = 0.131), main effect of time (F(5,96) = 65.715, P < 0.001) and interaction (F(5,96) = 1.814, P = 0.117); control, n = 9, HFD, n = 11. Two-way ANOVA for G: main effect of treatment (F(1,96) = 30.513, P < 0.001), main effect of time (F(5,96) = 12.571, P < 0.001) and interaction (F(5,96) = 3.327, P = 0.008); control, n = 9, HFD, n = 11; post hoc Bonferroni test, *P < 0.05. Consistent with the EchoMRI data, the perigonadal fat pad was significantly heavier in the DIO females compared with controls (1087 ± 133 mg, n = 9 vs 254 ± 20 mg, n = 11, unpaired two-tailed t test, t(18) = 6.829, P < 0.0001; data not shown). Both (D) DIO male and (H) female PomcEGFP mice at 10 weeks exhibited glucose intolerance vs their age-matched controls (fed grain-based diet). The GTTs showed significantly higher peak blood glucose levels 15 minutes after i.p. glucose (see “Materials and Methods”) and a delayed clearance. Two-way ANOVA for D: main effect of treatment (F(1,90) = 8.024, P = 0.006), main effect of time (F(4,90) = 35.919, P < 0.001) and interaction (F(4,90) = 1.316, P = 0.270); control, n = 8, HFD, n = 12; post hoc Bonferroni test, *P < 0.05. Two-way ANOVA for H: main effect of treatment (F(1,50) = 29.791, P < 0.001), main effect of time (F(4,50) = 33.646, P < 0.001) and interaction (F(4,50) = 1.537, P = 0.206); control, n = 5, HFD, n = 7; post hoc Bonferroni test, *P < 0.05.
Figure 2.
Figure 2.
POMC neurons from DIO males are insulin resistant. In voltage clamp, insulin (20 nM) induced an inward current in POMC neurons from (A) male mice on a control diet but could not induce an inward current in POMC neurons from (B) DIO male mice. In this figure and Figs. 3 and 4, the line above the current trace designates the perfusion of insulin into the bath (at 1.25 mL/min), which took several minutes to reach a steady-state concentration. Vhold = –60 mV. (C) The TRPC5 channel opener rosiglitazone (RSG; 100 μM) induced an inward current in POMC neurons from DIO males similar to the effects of insulin in the control diet-fed males. Note: Rosiglitazone acts directly on the channel and therefore rapidly induces an inward current. Vhold = –60 mV. (D) The I-V relationship for the rosiglitazone-induced current from DIO male mice was obtained from C showing an inward current that reversed at –32 mV. (E and F) Bar graphs summarizing the responses to (E) insulin- and (F) rosiglitazone-induced inward currents in control diet and DIO male POMC mice. Data points represent the mean ± SEM. Unpaired two-tailed t test for E: t(21) = 4.646, ***P = 0.0001 vs control; unpaired two-tailed t test for F: t(14) = 0.1790, P = 0.8466. Cell numbers are indicated.
Figure 3.
Figure 3.
POMC neurons from DIO, proestrous females are protected against insulin resistance. (A–F) In voltage clamp, (A) insulin (20 nM) induced an inward current in POMC neurons from proestrous female mice on a control diet. Vhold = –60 mV. (B) The I-V relationship for the insulin-induced current was obtained from A, which showed an inward current that reversed at –25 mV. The inward current was blocked by TRPC channel antagonist 2-aminoethyl diphenylborinate (2-APB; 100 μM). (C) Insulin depolarized POMC neurons and induced firing from control proestrous females. Note: Due to the high-input resistance of POMC neurons (>1 GΩ), a small inward current is able to depolarize the cell and cause excitation (action potential firing) within a short time period. (D) In voltage clamp, insulin induced an inward current in POMC neurons from DIO proestrous females. Vhold = –60 mV. (E) The I-V relationship for the insulin-induced current was obtained from D, which showed the reversal potential of –20 mV. (F) Insulin depolarized POMC neurons and induced firing in DIO proestrous females. (G) Bar graph summarizing the responses of insulin-induced inward currents in control diet and DIO proestrous female PomcEGFP mice. Data points represent the mean ± SEM. Unpaired two-tailed t test, t(28) = 0.2924, P = 0.7722. Cell numbers are indicated.
Figure 4.
Figure 4.
E2 replacement rescues insulin response in POMC neurons from OVX females. (A) In voltage clamp, insulin (20 nM) induced an inward current in POMC neurons from control diet-fed OVX female mice. Vhold = –60 mV. (B) In DIO OVX females, the insulin response was abrogated in POMC neurons. (C) However, the insulin response was rescued in DIO OVX females with E2 treatment (see “Materials and Methods”). (D) Bar graph summarizing the responses of insulin-induced currents in normal diet and OVX DIO and E2-treated female Pomc-EGFP mice. Data points represent the mean ± SEM. One-way ANOVA: effect of treatment, F(2, 41) = 17.74, P < 0.0001; Newman-Keuls multiple-comparison post hoc test. **** and #### indicate P < 0.001. Cell numbers are indicated. ns, no significant difference.
Figure 5.
Figure 5.
Socs3 mRNA expression is upregulated in POMC neurons from male but not female DIO mice. (A and D) HFD upregulated the Socs3 mRNA expression in ARH POMC neurons in males but not in females. Composite bar graphs illustrating the Socs3 mRNA levels determined in POMC neurons from (A) males or (D) females fed either an HFD or control diet. Data points represent the mean ± SEM. Unpaired two-tailed t test for A: t(8) = 4.006, P = 0.0039; unpaired two-tailed t test for D: t(7) = 1.826, P = 0.1122. Number of animals are indicated. **P < 0.005, values from DIO males that are significantly different from chow-fed controls. There were no differences in (B, E) Pik3cb mRNA or (C and F) Trpc5 mRNA expression in males or females fed either a control diet or HFD. Composite bar graphs illustrating the Pik3cb mRNA (p110 β) and Tripc5 mRNA determined in ARH POMC neurons from (B and C) males or (E and F) females fed either an HFD or control diet. Data points represent the mean ± SEM. Unpaired two-tailed t test for B: t(8) = 0.9674, P = 0.3617; unpaired two-tailed t test for E: t(7) = 0.7401, P = 0.4832; unpaired two-tailed t test for C: t(6) = 1.171, P = 0.2859; unpaired two-tailed t test for F: t(6) = 0.9513, P = 0.3782. Animal numbers are indicated with three pools of 10 cells from each animal.
Figure 6.
Figure 6.
E2 increases the whole-cell T-type calcium current and the mRNA expression of Cav3.1, but decreases the function of Stim1 in POMC neurons. (A) The current amplitude was normalized to the cell capacitance to calculate current density. Bar graphs summarize the density of T-type calcium current in POMC neurons from oil- and E2-treated animals. (B) Cav 3.1 mRNA expression was determined using the Taqman real-time PCR method in POMC neuronal pools (five cells in each pool). (C) Stim1 was measured in the arcuate nucleus in oil- and E2-treated females using SYBR Green real-time PCR (see “Materials and Methods”). (D) Based on single-cell RT-PCR analysis (65 cells from three female mice) >75% of POMC neurons express Stim1 mRNA. A representative gel illustrating that single POMC-EGFP neurons express mRNA for Pomc and Stim1, but not AgRP. –RT indicates that single cell reacted without RT; + indicates positive tissue control (with RT); – indicates negative tissue control (without RT). (E) In OVX females, insulin (Ins; 20 µM/4 µL “puff” application into bath) generated an inward current (4 pA) that washed out after several minutes, during which time the store-operated Ca2+ channel inhibitor GSK 7975A (10 µM) was applied. A second application of insulin (puff application) generated 8 pA current. Vhold = –60 mV. (F) GSK augmented the insulin-induced inward current by 2.9 ± 0.9-fold (n = 8). Data points represent the mean ± SEM. Unpaired two-tailed Student t test: t(15) = 3.986, P = 0.0012 (for T-type current); t(8) = 4.818, P = 0.0013 (for Cav3.1 mRNA); t(10) = 2.764, P = 0.020 (for Stim1 mRNA); t(25) = 2.184, P = 0.0386 (for GSK augmentation of insulin-induced inward current). *P < 0.05; **P < 0.01. EB, estradiol benzoate; MM, molecular marker.
Figure 7.
Figure 7.
DIO male guinea pigs are insulin resistant whereas DIO females are protected against insulin resistance, and pAkt is reduced in ARH of DIO male but not in DIO female guinea pigs. In males, purified guinea pig insulin decreases (A) energy intake concomitant with increases in (B) O2 consumption, (C) CO2 production, and (D) metabolic heat production. The effects of insulin were markedly diminished by DIO. Data points represent the mean ± SEM of the mean hourly food intake, O2 consumption, CO2 production, metabolic heat production, and (E) RER seen in guinea pigs treated with either insulin (4 mU; ICV) or its filtered 0.9% saline vehicle (2 μL; ICV). Two-way ANOVA for A: main effect of diet (F(1,75) = 0.01, P = 0.9036), main effect of insulin (F(1,75) = 4.63, P = 0.0346) and interaction (F(1,75) = 4.54, P = 0.0364); two-way ANOVA for B: main effect of diet (F(1,74) = 1.66, P = 0.2019), main effect of insulin (F(1,74) = 1.14, P = 0.2888) and interaction (F(1,74) = 9.59, P = 0.0028); two-way ANOVA for C: main effect of diet (F(1,74) = 11.78, P = 0.0010), main effect of insulin (F(1,74) = 3.67, P = 0.0591) and interaction (F(1,74) = 6.83, P = 0.0109); two-way ANOVA for D: main effect of diet (F(1,74) = 17.11, P = 0.0001), main effect of insulin (F(1,74) = 21.06, P = 0.0000) and interaction (F(1,74) = 0.26, P = 0.6146); two-way ANOVA for E: main effect of diet (F(1,74) = 32.04, P = 0.0000), main effect of insulin (F(1,74) = 3.42, P = 0.068) and interaction (F(1,74) = 0.08, P = 0.7753); post hoc least-significant difference test, *P < 0.05, values from insulin-treated animals that are significantly different than those from vehicle-treated controls (n = 4). #P < 0.05, values from DIO animals that are significantly different than those fed standard chow (n = 4). Representative western blots illustrating the levels of (F) Akt, (G) pAkt, and their corresponding loading control GAPDH in the ARH microdissected from HFD and control diet-fed male guinea pigs. (H) Composite bar graphs illustrating the pAkt/Akt ratio, after normalizing to their respective loading control, determined in ARH microdissections from animals fed either HFD or control diet. Data points represent the mean ± SEM, respectively. Mann-Whitney U test: U = 1.0, P = 1.2081E-8. Animal numbers are indicated. **** indicates values from DIO animals that are significantly different from control diet-fed controls. In females, the insulin-induced decrease in (I) food intake and the increases in (J) O2 consumption and (K) CO2 production are preserved in DIO periovulatory females. Data points represent the mean ± SEM of the mean hourly food intake, O2 consumption, CO2 production, (L) metabolic heat production, and (M) the RER seen in guinea pigs treated with either insulin (4 mU; ICV) or its filtered 0.9% saline vehicle (2 μL; ICV). Two-way ANOVA for I: main effect of diet (F(1,75) = 0.18, P = 0.6688), main effect of insulin (F(1,75) = 8.08, P = 0.0058) and interaction (F(1,75) = 0.03, P = 0.8704); two-way ANOVA for J: main effect of diet (F(1,75) = 0.02, P = 0.8889), main effect of insulin (F(1,75) = 15.58, P = 0.0002) and interaction (F(1,75) = 0.06, P = 0.8028); two-way ANOVA for K: main effect of diet (F(1,75) = 6.40, P = 0.013), main effect of insulin (F(1,75) = 10.43, P = 0.0018) and interaction (F(1,75) = 0.12, P = 0.7321); two-way ANOVA for L: main effect of diet (F(1,75) = 26.23, P = 0.0000), main effect of insulin (F(1,75) = 4.74, P = 0.0325) and interaction (F(1,75) = 1.24, P = 0.2689); two-way ANOVA for M: main effect of diet (F(1,75) = 39.78, P = 0.0000), main effect of insulin (F(1,75) = 0.72, P = 0.3978) and interaction (F(1,75) = 0.50, P = 0.4821); post hoc least-significant difference test, *P < 0.05, values from insulin-treated animals that are significantly different than those from vehicle-treated controls (n = 4). #P < 0.05, values from DIO animals that are significantly different than those fed standard chow (n = 4). Representative western blots depicting the levels of (N) Akt, (O) pAkt, and their corresponding loading control GAPDH in the ARH microdissected from HFD or control diet-fed female guinea pigs. (P) Composite bar graphs showing the pAkt/Akt ratio determined in ARH microdissections from animals fed either HFD or control diet. Data points represent the mean ± SEM, respectively. Mann-Whitney U test: U = 101.0, P = 0.6084. Animal numbers are indicated. All of the triplicate bands for Akt and pAkt from control diet- and HFD-fed male and female guinea pig ARH seen in F to G, N, and O were obtained from the same gel. There was no difference in total Akt expression between the control and HFD female guinea pigs (Mann-Whitney U test: U = 73.0, P = 0.42), nor was there any difference between male and female control animals (Mann-Whitney U test: U = 233.0, P = 0.13).
Figure 8.
Figure 8.
A cellular model of insulin (and leptin) signaling via TRPC5 channel activation in POMC neurons. Based on the current findings and other published data, we propose that insulin signals via IRS-PI3K to activate TRPC5 channels in POMC neurons, which generates a robust inward cationic current to depolarize POMC neurons and increase their excitability. Similarly, leptin binding to its receptor (LRb) triggers the recruitment of the tyrosine kinase Janus kinase (JAK) 2, leading to the activation of the JAK/signal transducer and activator of transcription (STAT) signaling pathway and simultaneously activation of PI3K, which also activates TRPC5 channels (9, 17). PI3K (p85/p110) will also accelerate the rapid insertion of TPRC5 channels into the plasma membrane (23). With DIO (hyperleptinemia), there is an increase in Socs3 mRNA expression in POMC neurons in males but not in females, which induces insulin resistance by inhibiting the tyrosine kinase activity of InsR and the interaction of IRS proteins with InsR. However, under physiological stress and in the absence of E2, STIM1 interacts with TPRC5/Cav3.1 channels, thereby engaging these Ca2+ channels as store-operated channels (inset), which are activated with ER depletion of Ca2+ (52). However, under physiological conditions in cycling females, E2 downregulates the expression of STIM1 (see Fig. 6) and prevents the phosphorylation of STIM1, thereby converting the TRPC5/Cav3.1 signaling complex to receptor-operated (i.e., InsR) channels in POMC neurons (inset). PDK1, 3-phosphoinositide–dependent protein kinase-1.

Comment in

References

    1. Kim B, Feldman EL. Insulin resistance in the nervous system. Trends Endocrinol Metab. 2012;23(3):133–141. - PMC - PubMed
    1. Janssen I, Powell LH, Crawford S, Lasley B, Sutton-Tyrrell K. Menopause and the metabolic syndrome: The study of women’s health across the nation. Arch Intern Med. 2008;168(14):1568–1575. - PMC - PubMed
    1. Gustafsson PE, Persson M, Hammarström A. Life course origins of the metabolic syndrome in middle-aged women and men: the role of socioeconomic status and metabolic risk factors in adolescence and early adulthood. Ann Epidemiol. 2011;21(2):103–110. - PubMed
    1. Aponte Y, Atasoy D, Sternson SM. AGRP neurons are sufficient to orchestrate feeding behavior rapidly and without training. Nat Neurosci. 2011;14(3):351–355. - PMC - PubMed
    1. Krashes MJ, Koda S, Ye C, Rogan SC, Adams AC, Cusher DS, Maratos-Flier E, Roth BL, Lowell BB. Rapid, reversible activation of AgRP neurons drives feeding behavior in mice. J Clin Invest. 2011;121(4):1424–1428. - PMC - PubMed

Publication types

MeSH terms