. 2018 May 1;110(5):467-478.
doi: 10.1093/jnci/djx236.

Targeting BCR-ABL-Independent TKI Resistance in Chronic Myeloid Leukemia by mTOR and Autophagy Inhibition

Affiliations

Targeting BCR-ABL-Independent TKI Resistance in Chronic Myeloid Leukemia by mTOR and Autophagy Inhibition

Rebecca Mitchell et al. J Natl Cancer Inst. .

Abstract

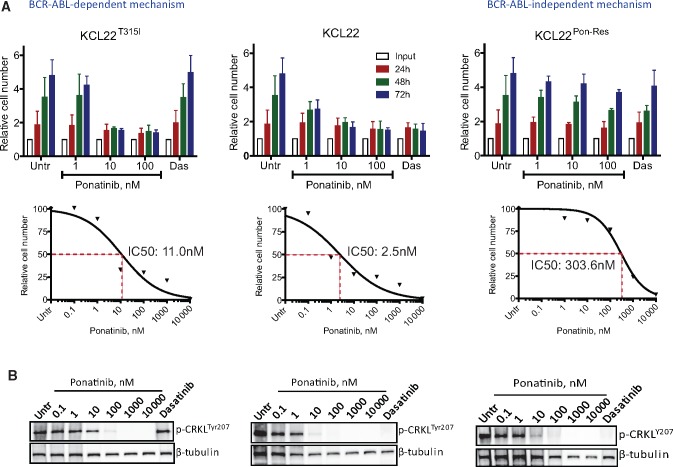
Background: Imatinib and second-generation tyrosine kinase inhibitors (TKIs) nilotinib and dasatinib have statistically significantly improved the life expectancy of chronic myeloid leukemia (CML) patients; however, resistance to TKIs remains a major clinical challenge. Although ponatinib, a third-generation TKI, improves outcomes for patients with BCR-ABL-dependent mechanisms of resistance, including the T315I mutation, a proportion of patients may have or develop BCR-ABL-independent resistance and fail ponatinib treatment. By modeling ponatinib resistance and testing samples from these CML patients, it is hoped that an alternative drug target can be identified and inhibited with a novel compound.

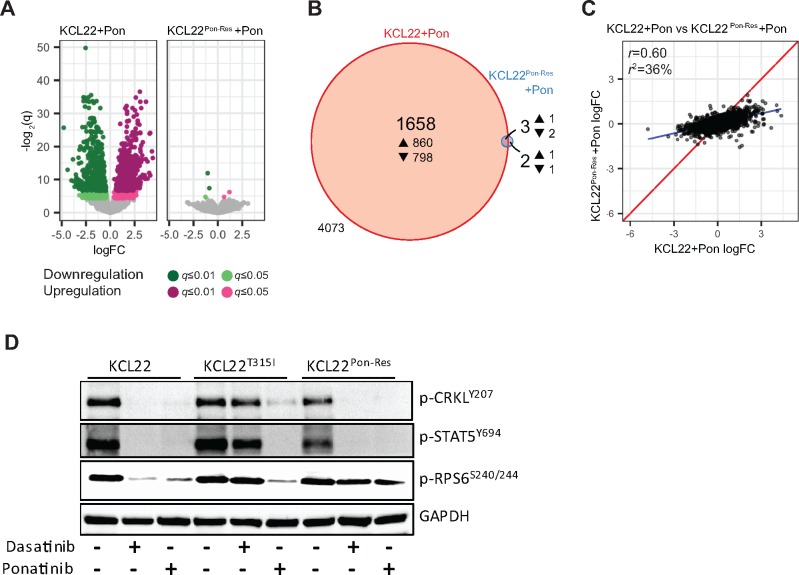
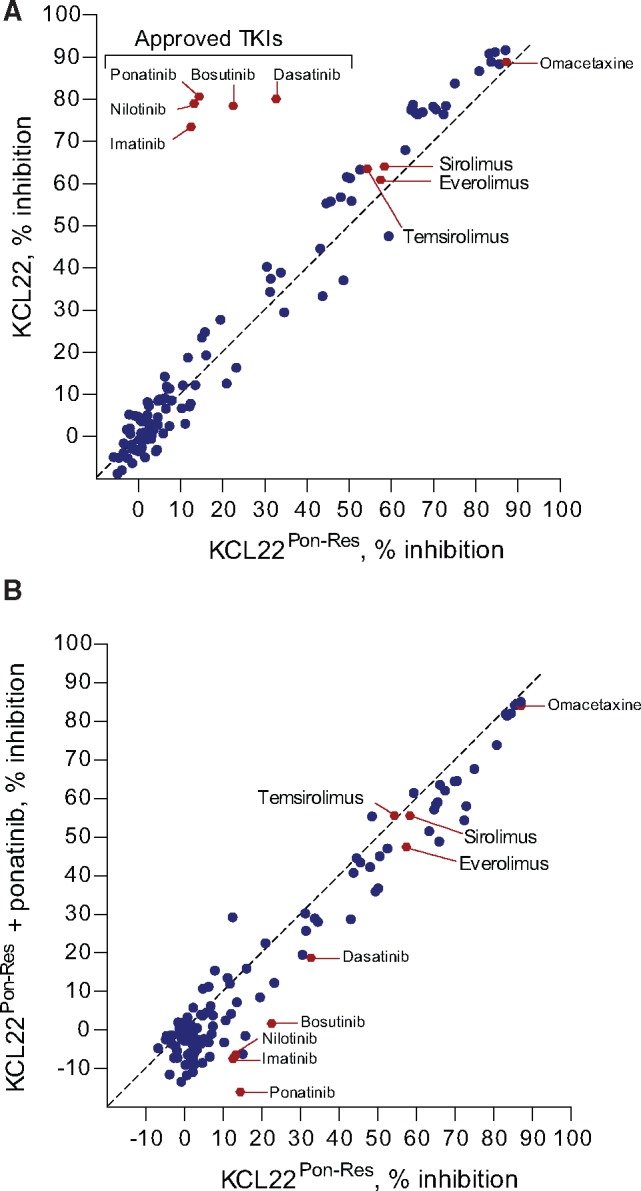
Methods: Two CML cell lines with acquired BCR-ABL-independent resistance were generated following culture in ponatinib. RNA sequencing and gene ontology (GO) enrichment were used to detect aberrant transcriptional response in ponatinib-resistant cells. A validated oncogene drug library was used to identify US Food and Drug Administration-approved drugs with activity against TKI-resistant cells. Validation was performed using bone marrow (BM)-derived cells from TKI-resistant patients (n = 4) and a human xenograft mouse model (n = 4-6 mice per group). All statistical tests were two-sided.

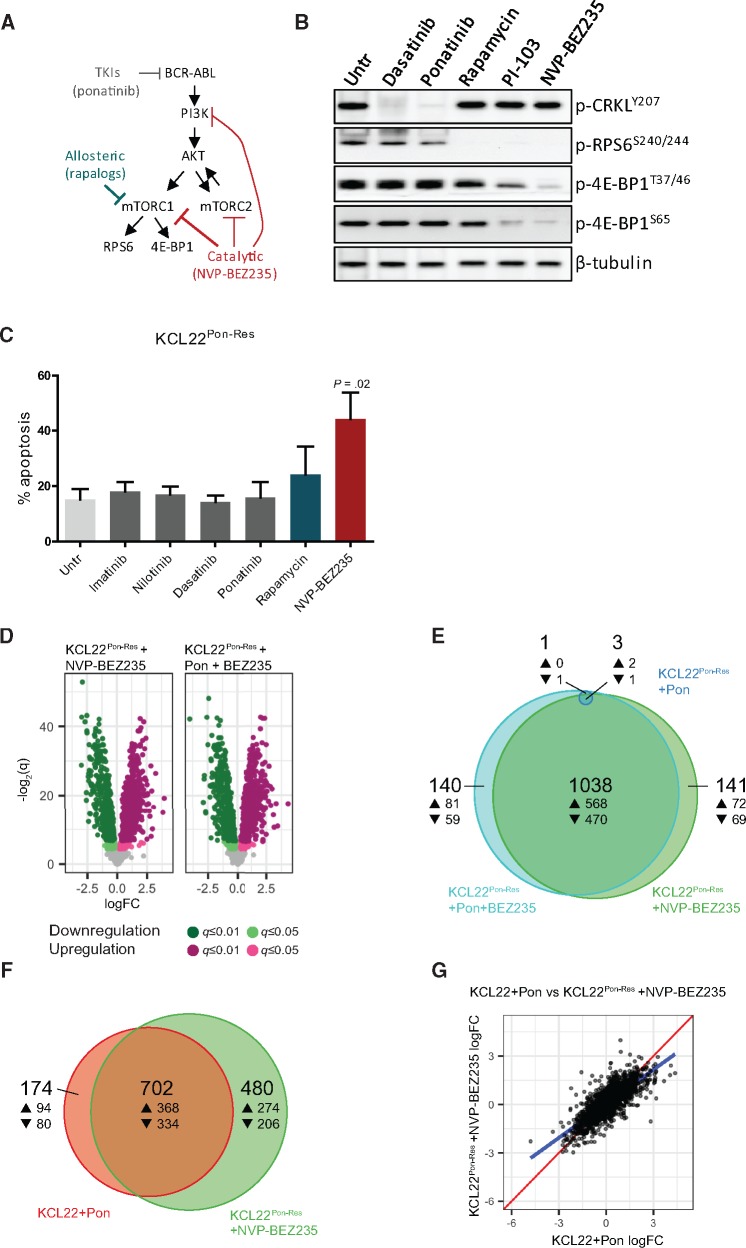
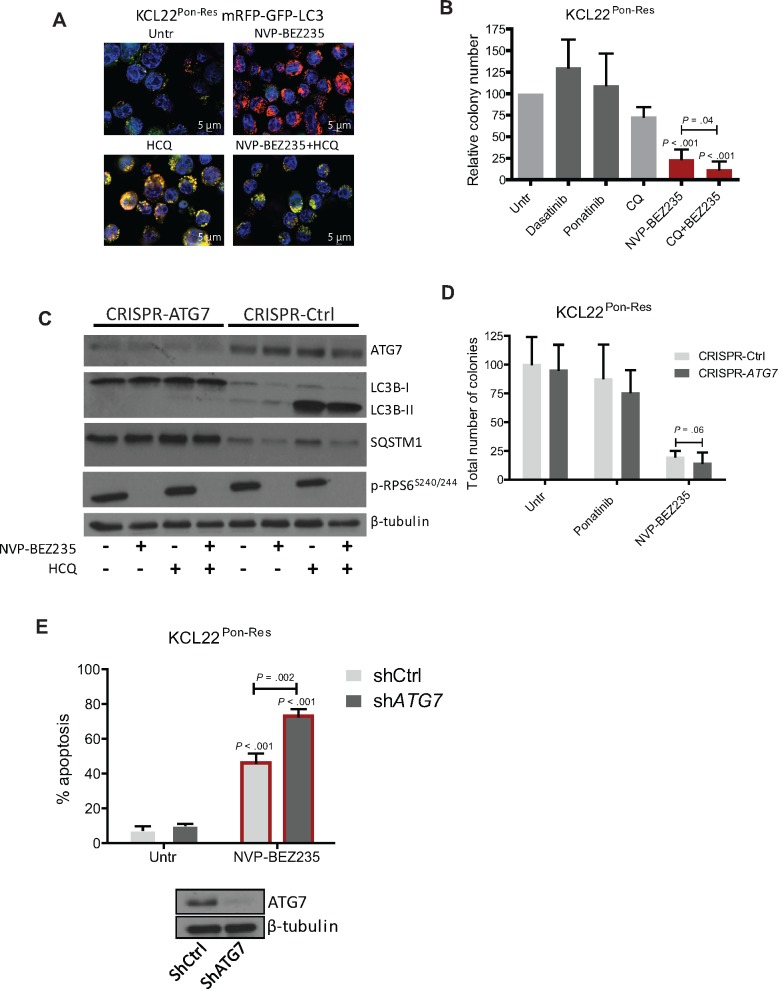
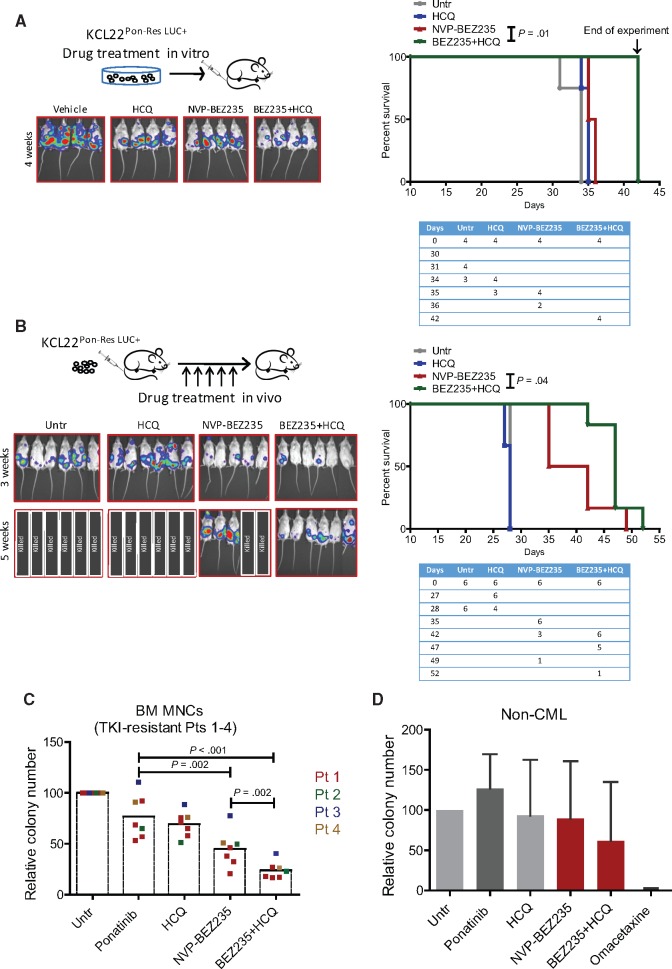
Results: We show that ponatinib-resistant CML cells can acquire BCR-ABL-independent resistance mediated through alternative activation of mTOR. Following transcriptomic analysis and drug screening, we highlight mTOR inhibition as an alternative therapeutic approach in TKI-resistant CML cells. Additionally, we show that catalytic mTOR inhibitors induce autophagy and demonstrate that genetic or pharmacological inhibition of autophagy sensitizes ponatinib-resistant CML cells to death induced by mTOR inhibition in vitro (% number of colonies of control[SD], NVP-BEZ235 vs NVP-BEZ235+HCQ: 45.0[17.9]% vs 24.0[8.4]%, P = .002) and in vivo (median survival of NVP-BEZ235- vs NVP-BEZ235+HCQ-treated mice: 38.5 days vs 47.0 days, P = .04).

Conclusion: Combined mTOR and autophagy inhibition may provide an attractive approach to target BCR-ABL-independent mechanism of resistance.


Figures

Figure 1.
Figure 1.
Proliferation of ponatinib-resistant chronic myeloid leukemia cells in the absence of BCR-ABL kinase activity. KCL22 (wild-type BCR-ABL), KCL22T315I, and KCL22Pon-Res cells were cultured with or without (Untr) increasing concentrations of ponatinib and 150 nM dasatinib. Proliferation was measured by cell counting using a glass hemocytometer following 24, 48, and 72 hours of drug treatment, and IC50 values were calculated using GraphPad Prism software (A). To assess for BCR-ABL activity, the levels of phosphorylation of CRKL were measured by immunoblot following four hours of drug treatment at varying concentrations of ponatinib and 150 nM dasatinib (B). Error bars = SD. Two independent experiments were performed in triplicate. Untr = untreated.
Figure 2.
Figure 2.
Transcriptional response and mTORC1 activity in ponatinib-resistant cells following BCR-ABL inhibition. KCL22 and KCL22Pon-Res cells were cultured with or without 100 nM ponatinib for 24 hours and RNA harvested for RNA-seq. A) The transcriptional response of KCL22 and KCL22Pon-Res cells is represented by Volcano plots (up- and downregulation are indicated by magenta and green, respectively; light and dark colors correspond to q-value thresholds of 0.05 and 0.01, respectively; statistically nonsignificant changes are colored gray). B) A proportional Venn diagram represents the overlap in statistically significant response to ponatinib (q ≤ 0.05) in both cell lines (4073 refers to the number of genes not changed). C) A direct comparison of the transcriptional response of all genes in both cell lines; identical expression is shown by the red line; the true linear relationship is indicated by the blue line. D) KCL22, KCL22T315I, and KCL22Pon-Res cells were cultured ± 150 nM dasatinib or 100 nM ponatinib. Phosphorylation of CRKL, STAT5, and RPS6 was measured after 24 hours of drug treatment.
Figure 3.
Figure 3.
Sensitivity of ponatinib-resistant cells to allosteric mTORC1 inhibition. An approved oncology drug library was screened against KCL22 and KCL22Pon-Res cells. Following 72 hours of 1 µM drug treatment, metabolic activity/proliferation was assessed using resazurin assay. Relative IC50 was calculated for each drug used, and a comparison was made between KCL22 and KCL22Pon-Res cells (A) and between KCL22Pon-Res cells cultured in the absence or presence of 100 nM ponatinib (B).
Figure 4.
Figure 4.
Transcriptional changes and levels of apoptosis in ponatinib-resistant cells following treatment with catalytic mTOR inhibitors. A) Schematic diagram demonstrating the activity of allosteric (blue-green) and catalytic (red) mTOR inhibitors. B) KCL22Pon-Res cells were cultured with 150 nM dasatinib, 100 nM ponatinib, 10 nM rapamycin, 500 nM PI-103, or 100 nM NVP-BEZ235 or untreated (Untr). Phosphorylation of CRKL, RPS6, and 4E-BP1 was measured four hours following drug treatment. C) KCL22Pon-Res cells were cultured ± 2 µM imatinib, 2 µM nilotinib, 150 nM dasatinib, 100 nM ponatinib, 10 nM rapamycin, or 100 nM NVP-BEZ235, and apoptosis was measured following 72 hours of drug treatment. Error bars = SD. Three independent experiments were performed. D–G) KCL22Pon-Res cells were cultured ± 100 nM NVP-BEZ235, alone and in combination with 100 nM ponatinib for 24 hours, and RNA was harvested for RNA-seq. D) The transcriptional response of KCL22Pon-Res cells to NVP-BEZ235 alone (left) and in combination with ponatinib (right) is represented by Volcano plots (up- and downregulation are indicated by magenta and green, respectively; light and dark colors correspond to q-value thresholds of 0.05 and 0.01, respectively; statistically nonsignificant changes are colored gray). E) A proportional Venn diagram represents the overlap in statistically significant response (q ≤ 0.05) to ponatinib alone (dark blue), NVP-BEZ235 alone (green), and the combination (light blue) in the KCL22Pon-Res cells. F) A proportional Venn diagram represents the overlap in statistically significant response (q ≤ 0.05) to ponatinib in KCL22 cells (red) and NVP-BEZ235 in KCL22Pon-Res cells (green). G) A direct comparison of the transcriptional responses of all 1718 genes to treatment common to both experiments; identical expression is shown by the red line, and the true linear relationship is indicated by the blue line. One independent experiment was performed in quadruplicate. Untr = untreated.
Figure 5.
Figure 5.
Autophagic response following mTOR inhibition in ponatinib-resistant cells. A) KCL22Pon-Res cells expressing mRFP-GFP-LC3 were cultured ± 100 nM NVP-BEZ235 alone (top panel) or in combination with 10 µM hydroxychloroquine (HCQ; bottom panel). Scale bars = 5 µm. Autophagy flow (top panel) and inhibition of autophagy flow (bottom panel) was visualized following 24 hours of drug treatment. B) KCL22Pon-Res cells were cultured ± 150 nM dasatinib, 100 nM ponatinib, and 100 nM NVP-BEZ235 with and without chloroquine-mediated autophagy inhibition. Colony forming potential was measured following 72 hours of drug treatment. C–E) KCL22Pon-Res cells were infected with lentivirus-expressing sgRNA (C and D) or shRNA-targeting (E)ATG7 or empty vector/scrambled (Scr) shRNA as control. Following knockdown, cells were treated with 100 nM ponatinib (D), 100 nM NVP-BEZ235 (C–E) alone, or in combination with 10 µM HCQ (C). C and E) Stable ATG7 knockdown, inhibition of autophagy (LC3-II and SQSTM1 levels), and mTORC1 activity were measured in puromycin-selected cells by immunoblot. Colony forming potential (D) or apoptosis (E) was measured following 72 hours of drug treatment. Error bars = SD. Statistical analysis was performed using the two-tailed Student’s t test. CQ = chloroquine; Untr = untreated.
Figure 6.
Figure 6.
Sensitivity of xenografted ponatinib-resistant cells and primary chronic phase TKI-resistant chronic myeloid leukemia cells to NVP-BEZ235 and hydroxychloroquine (HCQ)-mediated autophagy inhibition. A) KCL22Pon-Res cells were labeled with firefly luciferase and treated ex vivo with 100 nM NVP-BEZ235, alone and in combination with 10 µM HCQ. Seventy-two hours following drug treatment, cells were transplanted intravenously into sublethally irradiated NSG mice (four mice per group, two independent experiments). Thirty minutes after the transplant, the mice were injected with D-luciferin substrate to ensure the success of the transplantation and the cell viability. Leukemic progression was measured weekly by luciferase bio-imaging (left). Overall survival was monitored by Kaplan-Meier analysis (right). A table showing the number of mice at risk is shown below the graph. B) Firefly luciferase labeled KCL22Pon-Res cells were transplanted intravenously into NSG mice (five to six mice per group, two independent experiments). Mice were then treated with NVP-BEZ235 (45 mg/kg, oral gavage), HCQ (60 mg/kg, intraperitoneal injection), and the combination for up to five weeks. Leukemia progression and overall survival were measured by luciferase bio-imaging (left) and Kaplan-Meier analysis (right), respectively. A table showing the number of mice at risk is shown below the graph. Untr = untreated. C) Bone marrow (BM)–derived mononuclear cells (MNCs) from four TKI-resistant patients (Pts 1–4) were cultured in SFM supplemented with PGF and treated with 100 nM ponatinib, 100 nM NVP-BEZ-235 alone, or in combination with HCQ-mediated autophagy inhibition for 72 hours. Survival of progenitor cells was measured by colony forming cell (CFC) assay. Each dot represents average of two to three technical replicates. D) BM cells were collected on four occasions from patient No. 1 (Pt 1) during the period of 2013–2016. Ph-negative CD34+ cells (n = 4) were cultured in SFM supplemented with PGF and treated with 100 nM ponatinib, 100 nM NVP-BEZ-235, 10 µM HCQ, 10 nM omacetaxine, and the combination of NVP-BEZ-235 and HCQ. Survival of progenitor cells was measured by CFC assay following 72 hours of drug treatment. Error bars = SD. Statistical analyses were performed using the Gehan-Breslow Wilcoxon test (A and B) or the two-tailed Student’s t test (C and D). CML = chronic myeloid leukemia; HCQ = hydroxychloroquine; Untr = untreated.

References

    1. Rowley JD. Letter: A new consistent chromosomal abnormality in chronic myelogenous leukaemia identified by quinacrine fluorescence and Giemsa staining. Nature. 1973;243(5405):290–293.http://dx.doi.org/10.1038/243290a0 - DOI - PubMed
    1. Daley GQ, Van Etten RA, Baltimore D.. Induction of chronic myelogenous leukemia in mice by the P210bcr/abl gene of the Philadelphia chromosome. Science. 1990;247(4944):824–830.http://dx.doi.org/10.1126/science.2406902 - DOI - PubMed
    1. Druker BJ, Guilhot F, O'Brien SG et al. , Five-year follow-up of patients receiving imatinib for chronic myeloid leukemia. N Engl J Med. 2006;355(23):2408–2417.http://dx.doi.org/10.1056/NEJMoa062867 - DOI - PubMed
    1. Graham SM, Jorgensen HG, Allan E et al. , Primitive, quiescent, Philadelphia-positive stem cells from patients with chronic myeloid leukemia are insensitive to STI571 in vitro. Blood. 2002;99(1):319–325.http://dx.doi.org/10.1182/blood.V99.1.319 - DOI - PubMed
    1. Corbin AS, Agarwal A, Loriaux M et al. , Human chronic myeloid leukemia stem cells are insensitive to imatinib despite inhibition of BCR-ABL activity. J Clin Invest. 2011;121(1):396–409.http://dx.doi.org/10.1172/JCI35721 - DOI - PMC - PubMed

Publication types

MeSH terms