. 2017 Nov 21;47(5):890-902.e4.
doi: 10.1016/j.immuni.2017.10.021.

Granulocyte-Monocyte Progenitors and Monocyte-Dendritic Cell Progenitors Independently Produce Functionally Distinct Monocytes

Affiliations

Granulocyte-Monocyte Progenitors and Monocyte-Dendritic Cell Progenitors Independently Produce Functionally Distinct Monocytes

Alberto Yáñez et al. Immunity. .

Abstract

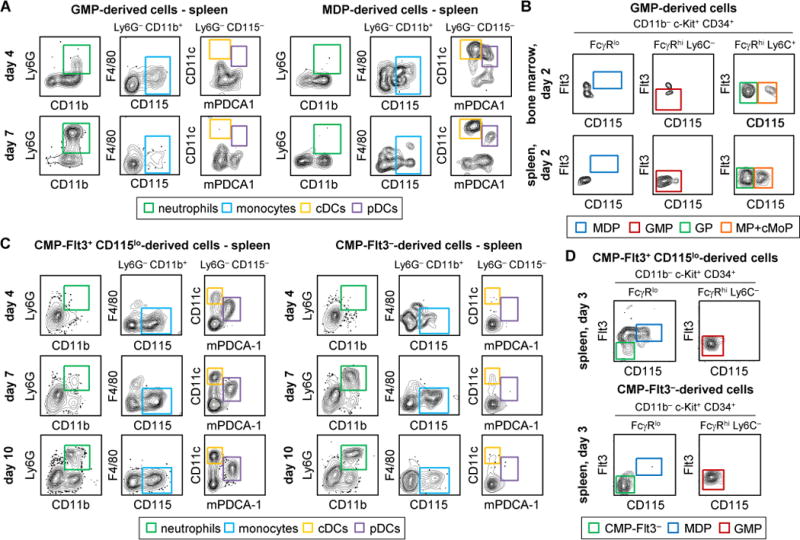
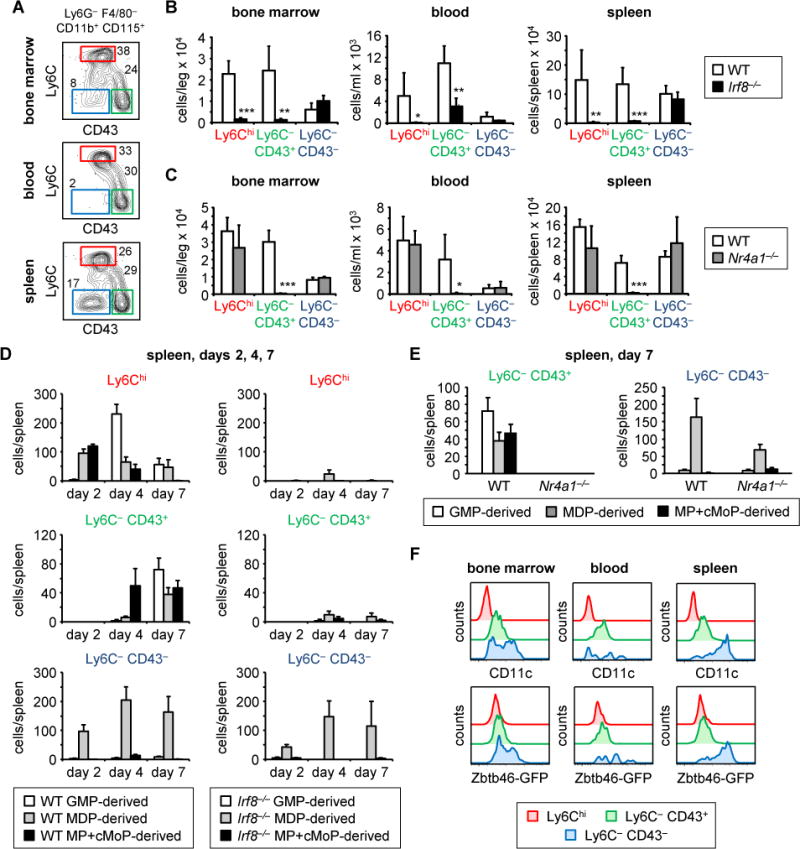
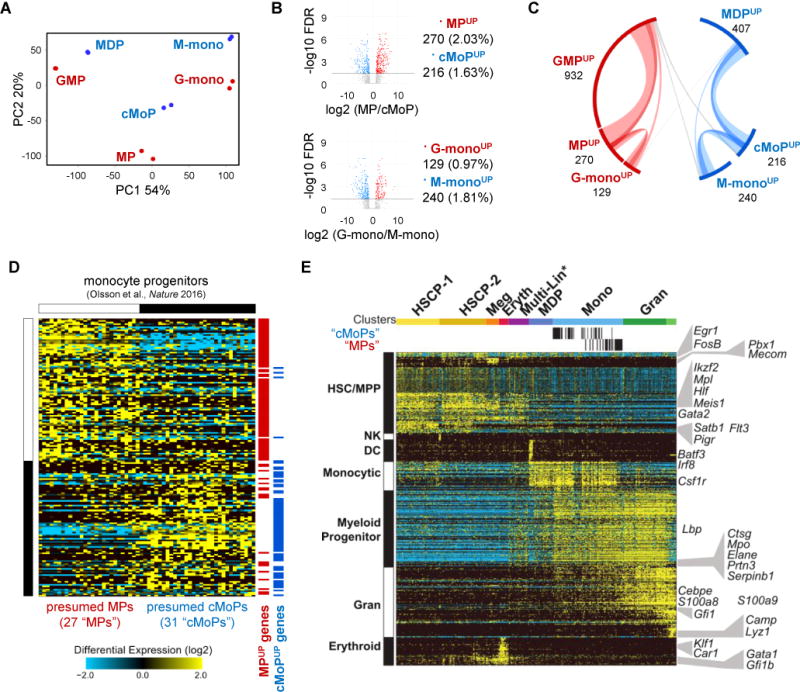
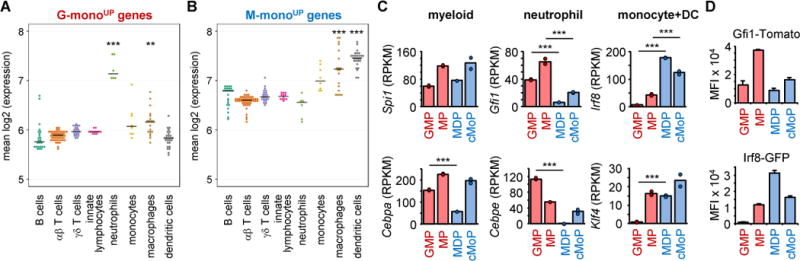
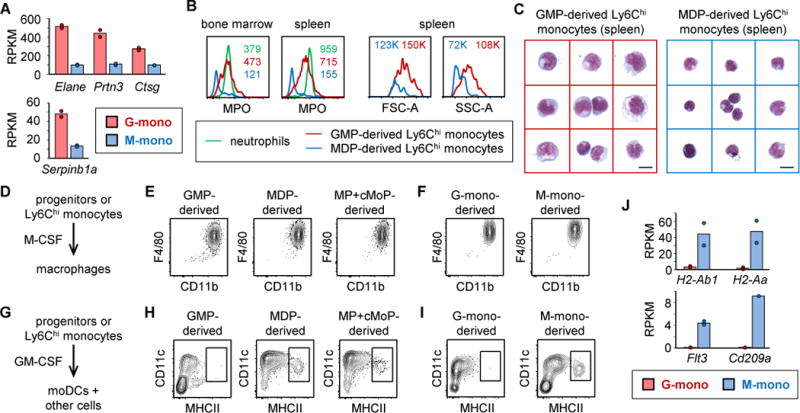
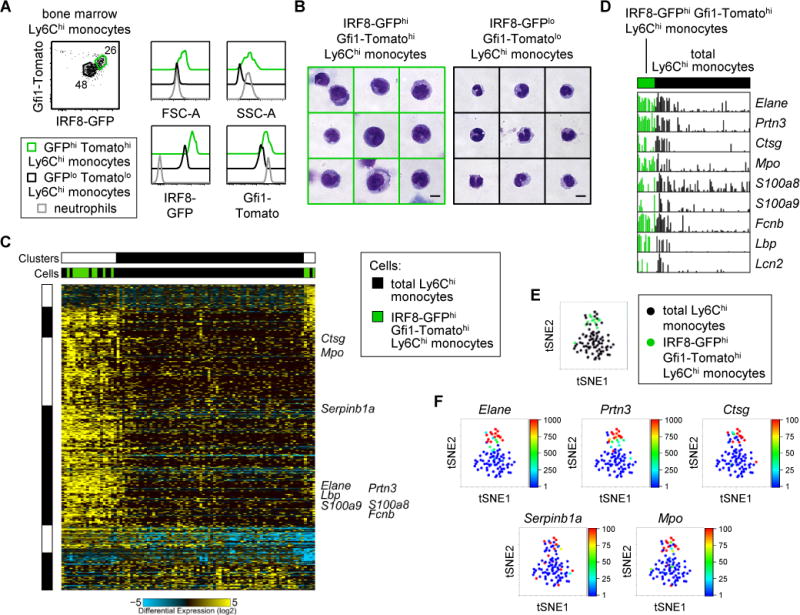
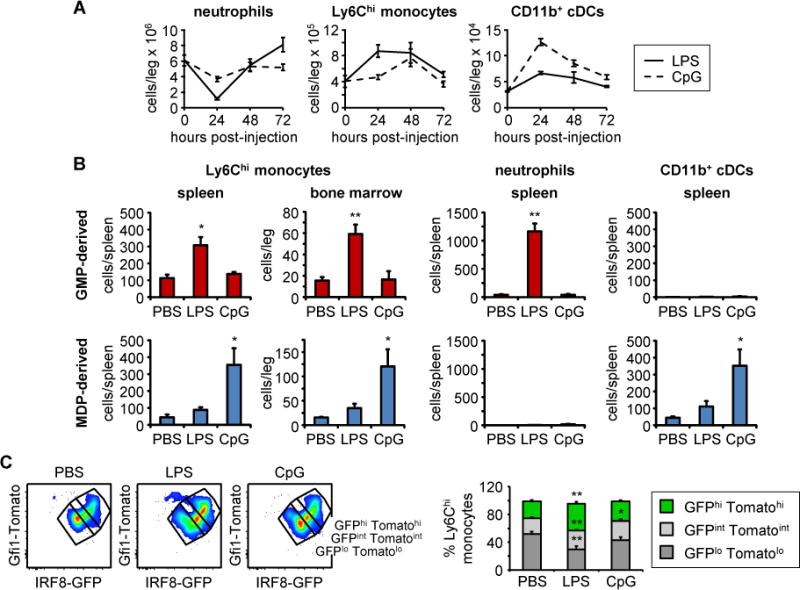
Granulocyte-monocyte progenitors (GMPs) and monocyte-dendritic cell progenitors (MDPs) produce monocytes during homeostasis and in response to increased demand during infection. Both progenitor populations are thought to derive from common myeloid progenitors (CMPs), and a hierarchical relationship (CMP-GMP-MDP-monocyte) is presumed to underlie monocyte differentiation. Here, however, we demonstrate that mouse MDPs arose from CMPs independently of GMPs, and that GMPs and MDPs produced monocytes via similar but distinct monocyte-committed progenitors. GMPs and MDPs yielded classical (Ly6Chi) monocytes with gene expression signatures that were defined by their origins and impacted their function. GMPs produced a subset of "neutrophil-like" monocytes, whereas MDPs gave rise to a subset of monocytes that yielded monocyte-derived dendritic cells. GMPs and MDPs were also independently mobilized to produce specific combinations of myeloid cell types following the injection of microbial components. Thus, the balance of GMP and MDP differentiation shapes the myeloid cell repertoire during homeostasis and following infection.

Keywords: GMP; MDP; MP; cMoP; dendritic cell; granulocyte-monocyte progenitor; monocyte; monocyte progenitor; monocyte-dendritic cell progenitor; myeloid cell; myeloid progenitor; myelopoiesis; neutrophil.


Figures

Figure 1
Figure 1. Independent production of monocytes by GMPs and MDPs
25,000–50,000 GMPs, MDPs, CMP-Flt3+ CD115lo or CMP-Flt3 progenitors isolated from CD45.2 donor mice (see Figure S1B) were injected i.v. into congenic CD45.1 recipient mice (non-irradiated) on day 0. Bone marrow and spleens were harvested from recipient mice at the indicated timepoints after progenitor injection, and single cell suspensions were enriched for CD45.2+ (donor-derived) cells by MACS depletion of CD45.1+ cells prior to staining to detect donor-derived progeny (CD45.2+) by flow cytometry. Data presented in each panel are from one experiment that is representative of at least 3 independent experiments.
Figure 2
Figure 2. GMPs and MDPs produce both Ly6Chi and Ly6C CD43+ monocytes
(A) To identify monocyte subsets in the bone marrow, blood and spleen of wild-type mice, Ly6C and CD43 expression by CD11b+ CD115+ Ly6G F4/80 cells was assessed by flow cytometry (see Figure S4A for gating strategy). (B–C) Ly6Chi, Ly6C CD43+ and Ly6C CD43 subsets were assessed in the bone marrow, blood and spleen of wild-type (B–C), Irf8-deficient (B) and Nur77 (Nr4a1)-deficient (C) mice with additional gating of CCR2+ cells to identify Ly6Chi monocytes due to the presence of incompletely differentiated Ly6Cint monoblasts in Irf8-deficient mice (Figure S4C and (Yanez et al., 2015)). Data are presented as mean plus standard deviation of 5 mice, and statistical significance was assessed by Student’s t-test (*p<0.05, **p<0.01, ***p<0.001). (D–E) 25,000 GMPs, MDPs or MPs+cMoPs isolated from wild-type (D–E), Irf8-deficient (D) or Nur77 (Nr4a1)-deficient (E) donor mice (all CD45.2) were injected i.v. into congenic CD45.1 recipient mice (non-irradiated) on day 0. Spleens were harvested from recipient mice at the indicated timepoints after progenitor injection, and splenocytes were enriched for CD45.2+ (donor-derived) cells prior to assessment of donor-derived Ly6Chi (and CCR2+), Ly6C CD43+ and Ly6C CD43 cells by flow cytometry (see Figure S4D for gating strategy). Data are presented as mean plus standard error of 3–4 mice that received progenitors in independent experiments. (F) CD11c and Zbtb46 expression by Ly6Chi, Ly6C CD43+ and Ly6C CD43 cells in the bone marrow, blood and spleen of Zbtb46-GFP transgenic mice was assessed by flow cytometry.
Figure 3
Figure 3. Transcriptomic profiling of GMP- and MDP-derived monocyte progenitors and Ly6Chi monocytes
GMPs and MDPs were isolated from mouse bone marrow and cultured in vitro with M-CSF. Monocyte-committed progenitors (MPs or cMoPs) and Ly6Chi monocytes were isolated from the cultures (see also Figure S5A–B), and RNA was isolated from these cells, as well as the GMPs and MDPs from which they were derived. Two replicate samples of each cell type were derived from independent cultures (each using GMPs or MDPs pooled from 20 mice) for RNA sequencing. (A) Principal component analysis of gene expression by the parental progenitors (GMPs and MDPs), monocyte-committed progenitors (MPs and cMoPs), and Ly6Chi monocytes (GMP- and MDP-derived: G-mono and M-mono respectively). (B) Gene expression by the monocyte-committed progenitors and Ly6Chi monocytes was compared between the two pathways. Volcano plots of differentially expressed genes (2-fold, adjusted p value < 0.05) are shown. The number of enriched (UP) genes in each subset is noted at the side, and this is also displayed as a percentage of the total genes expressed by each pair (e.g. number of MP-enriched (MPUP) genes/total number of genes expressed by MPs and cMoPs). (C) Circos plot of the enriched genes for each subset in the two pathways. In the outer circle, genes enriched at the indicated stage of the GMP lineage (compared to its counterpart in the MDP lineage) are red, while those enriched at the indicated stage of the MDP lineage (compared to the GMP lineage) are blue. Lines linking the subsets indicate genes that are enriched in multiple subsets, with red and blue lines indicating conservation within the same pathway (GMP or MDP, respectively). Only genes that are differentially expressed in at least one of the cell types are shown. (D) Expression of MPUP and cMoPUP genes (identified by bulk RNA sequencing; 2-fold, p<0.05) by 58 individual LKS CD34+ FcγRhi mouse bone marrow cells previously identified as monocyte-committed progenitors by single-cell RNA sequencing (Olsson et al., 2016). Clustering was performed in AltAnalyze using HOPACH (correlation distance), permitting the identification of 2 subsets corresponding to presumed MPs and cMoPs (“MPs” and “cMoPs”) as indicated. Red and blue tick marks indicate MPUP and cMoPUP genes respectively (genes not detected by single-cell RNA sequencing are not shown). (E) Individual monocyte-committed progenitors from the LKS CD34+ FcγRhi fraction of mouse bone marrow that were identified as presumed MPs or cMoPs (“MPs” or “cMoPs”; black tick marks) were viewed within the panorama of bone marrow progenitors profiled previously by single-cell RNA sequencing (Olsson et al., 2016). Cells sorted from other cell fractions (e.g. LKS CD34+ FcγRint cells) and annotated as monocyte progenitors (Olsson et al., 2016) were not characterized.
Figure 4
Figure 4. Relationship of GMP-derived and MDP-derived Ly6Chi monocytes to other immune cells
(A–B) Expression of the enriched gene sets of GMP- and MDP-derived Ly6Chi monocytes (A, 129 G-monoUP genes; B, 240 M-monoUP genes) by immune cells in the V1 dataset of the Immunological Genome Project (ImmGen) database. Each dot represents the mean expression of all G-monoUP or M-monoUP genes by an individual sample of the indicated cell type (6–49 samples per cell type, e.g. 6 neutrophil samples, 49 αβ T cell samples). Horizontal bars indicate median expression values for each cell type. Statistical significance was assessed using a Mann-Whitney U test with Holm correction to compare each cell type with the other cell types (**p<0.01, ***p<0.001). (C) Expression of myeloid, neutrophil and monocyte+DC transcription factors by the ex vivo GMPs and MDPs, and the MPs and cMoPs derived from them in vitro. Statistical significance was assessed using an empirical Bayes moderated t-test (***p<0.05). (D) Reporter protein expression by ex vivo GMPs and MDPs isolated from the bone marrow of Gfi1-Tomato IRF8-GFP transgenic mice, and MPs and cMoPs derived from them in vitro. Data are presented as mean plus standard deviation of MFIs from 3 independent cultures.
Figure 5
Figure 5. GMPs yield “neutrophil-like” Ly6Chi monocytes, and MDPs give rise to moDC-producing Ly6Chi monocytes
(A) Granule gene expression by GMP- and MDP-derived Ly6Chi monocytes (G-mono and M-mono respectively; data are from the bulk RNA sequencing dataset). (B–C) CFSE-stained GMPs and MDPs were adoptively transferred into recipient mice, and spleens were harvested 3 days later. MPO expression plus forward and side scatter (FSC-A and SSC-A) (B) of donor-derived Ly6Chi monocytes (CFSE+ CD11b+ Ly6G CD115+ Ly6Chi) were assessed by flow cytometry, and FACS-sorted donor-derived Ly6Chi monocytes were visualized by microscopy with May-Grunwald Giemsa staining to assess morphology (C; scale bar 10 μm). (D–F) Macrophage production in cultures of progenitors or Ly6Chi monocytes with 50 ng/ml M-CSF was assessed by flow cytometry. (E) GMPs, MDPs and the mixed MP+cMoP fraction of bone marrow were cultured with M-CSF for 7 days (E). (F) Ly6Chi monocytes FACS-sorted from 3-day M-CSF cultures of GMPs and MDPs (G-monos and M-monos, respectively) were cultured with M-CSF for a further 4 days. (G–I) moDC (CD11c+ MHCIIhi cells) production in cultures of progenitors or Ly6Chi monocytes with 20 ng/ml GM-CSF was assessed by flow cytometry. (H) GMPs, MDPs and the mixed MP+cMoP fraction of bone marrow were cultured with GM-CSF for 7 days. (I) Ly6Chi monocytes FACS-sorted from 3-day M-CSF cultures of GMPs and MDPs (G-monos and M-monos, respectively) were cultured for a further 4 days with GM-CSF. Data are representative of at least 3 independent experiments. (J) Expression of MHCII genes (H2-Ab1 and H2-Aa), Flt3 and CD209a by GMP- and MDP-derived Ly6Chi monocytes (G-mono and M-mono, respectively; data are from the bulk RNA sequencing dataset).
Figure 6
Figure 6. Single-cell RNA sequencing reveals a subset of “neutrophil-like” Ly6Chi monocytes in mouse bone marrow
(A–B) Ly6Chi monocytes were isolated from IRF8-GFP Gfi1-tdTomato reporter mice, profiled by flow cytometry in comparison with neutrophils (A), and visualized by microscopy with May-Grunwald Giemsa staining to assess morphology (B). (C–F) Total Ly6Chi monocytes from wild-type mice (78 monocytes isolated from bone marrow pooled from 5 mice) and GFPhi Tomatohi Ly6Chi monocytes from IRF8-GFP Gfi1-tdTomato reporter mice (14 monocytes isolated from bone marrow pooled from 3 mice) were profiled by single-cell RNA sequencing. (C) AltAnalyze profiling of individual Ly6Chi monocytes using 1309 genes correlated (rho>0.04) to the expression of 123 genes identified as differentially expressed in the bulk RNA sequencing analysis (G-monoUP vs. M-monoUP; only ICGS expressed genes were considered). (D) Comb plots of neutrophil granule gene expression by individual Ly6Chi monocytes. (E–F) The single-cell RNA sequencing data was also analyzed using Cytobank. (E) The monocytes were clustered using 252 genes that were differentially expressed in GMP- and MDP-derived Ly6Chi monocytes (G-monoUP and M-monoUP genes identified by bulk sequencing) and also detected by single-cell RNA sequencing; tSNE plots are shown. (F) Expression intensities (log10 RPKM) of neutrophil granule genes are shown overlaid on the tSNE plots.
Figure 7
Figure 7. LPS and CpG treatment differentially mobilize GMPs and MDPs in vivo
(A) LPS (25 μg/mouse) or CpG (5 μg/mouse) + DOTAP (25 μg/mouse) was injected i.v. into mice, and neutrophils, Ly6Chi monocytes and CD11b+ cDCs in the bone marrow were assessed at the indicated timepoints post-injection. Data are presented as means plus standard deviation of 3 mice/group and are representative of at least 2 independent experiments. (B) 25,000 GMPs or MDPs isolated from CD45.2 donor mice were injected i.v. into CD45.1 recipient mice (non-irradiated) on day 0. LPS (25 μg/mouse) or CpG (5 μg/mouse) + DOTAP (25 μg/mouse) was injected i.v. into the mice 2 hours later. Bone marrow and spleens were harvested from recipient mice 3 days after progenitor injection, and splenocytes were enriched for CD45.2+ (donor-derived) cells prior to staining for flow cytometry to detect donor cell-derived Ly6Chi monocytes, neutrophils and CD11b+ cDCs. Data are presented as mean plus standard error of 3 mice that received progenitors in independent experiments. (C) LPS (25 μg/mouse) or CpG (5 μg/mouse) + DOTAP (25 μg/mouse) was injected i.v. into IRF8-GFP Gfi1-tdTomato reporter mice, and Ly6Chi monocytes in the bone marrow were assessed 48 hours later. Data are presented as means plus standard deviation of 3 mice/group. Statistical significance was assessed by Student’s t-test (*p<0.05, **p<0.01).

References

    1. Akashi K, Traver D, Miyamoto T, Weissman IL. A clonogenic common myeloid progenitor that gives rise to all myeloid lineages. Nature. 2000;404:193–197. - PubMed
    1. Amir el AD, Davis KL, Tadmor MD, Simonds EF, Levine JH, Bendall SC, Shenfeld DK, Krishnaswamy S, Nolan GP, Pe’er D. viSNE enables visualization of high dimensional single-cell data and reveals phenotypic heterogeneity of leukemia. Nat Biotechnol. 2013;31:545–552. - PMC - PubMed
    1. Auffray C, Fogg DK, Narni-Mancinelli E, Senechal B, Trouillet C, Saederup N, Leemput J, Bigot K, Campisi L, Abitbol M, et al. CX3CR1+ CD115+ CD135+ common macrophage/DC precursors and the role of CX3CR1 in their response to inflammation. J Exp Med. 2009;206:595–606. - PMC - PubMed
    1. Basu S, Hodgson G, Zhang HH, Katz M, Quilici C, Dunn AR. “Emergency” granulopoiesis in G-CSF-deficient mice in response to Candida albicans infection. Blood. 2000;95:3725–3733. - PubMed
    1. Carlin LM, Stamatiades EG, Auffray C, Hanna RN, Glover L, Vizcay-Barrena G, Hedrick CC, Cook HT, Diebold S, Geissmann F. Nr4a1-dependent Ly6C(low) monocytes monitor endothelial cells and orchestrate their disposal. Cell. 2013;153:362–375. - PMC - PubMed

Publication types