. 2017 Nov 21;21(8):2291-2303.
doi: 10.1016/j.celrep.2017.10.097.

Spatiotemporal Proteomic Profiling of Huntington's Disease Inclusions Reveals Widespread Loss of Protein Function

Affiliations

Spatiotemporal Proteomic Profiling of Huntington's Disease Inclusions Reveals Widespread Loss of Protein Function

Fabian Hosp et al. Cell Rep. .

Abstract

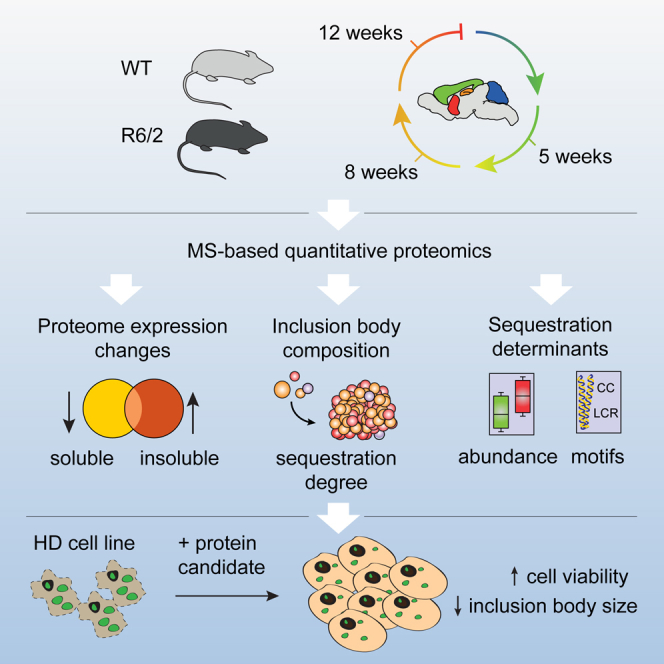
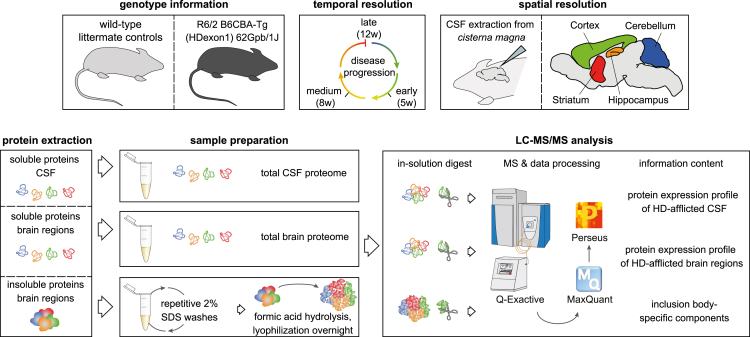
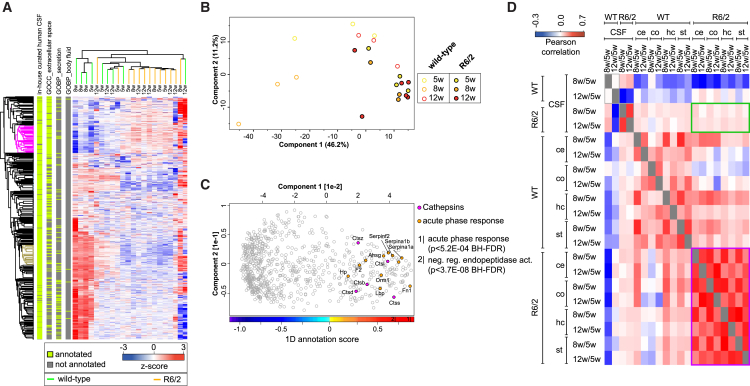
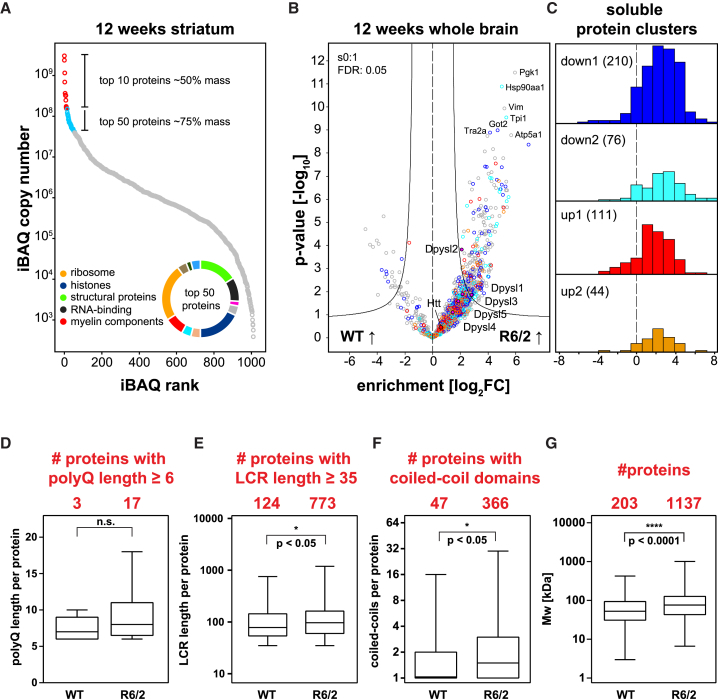
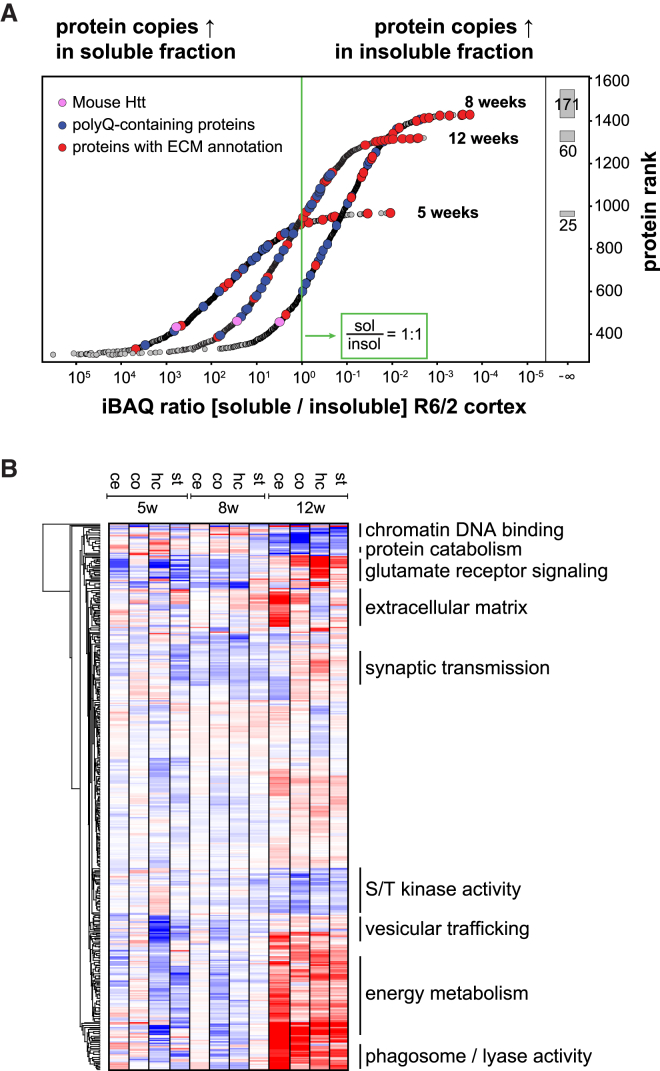
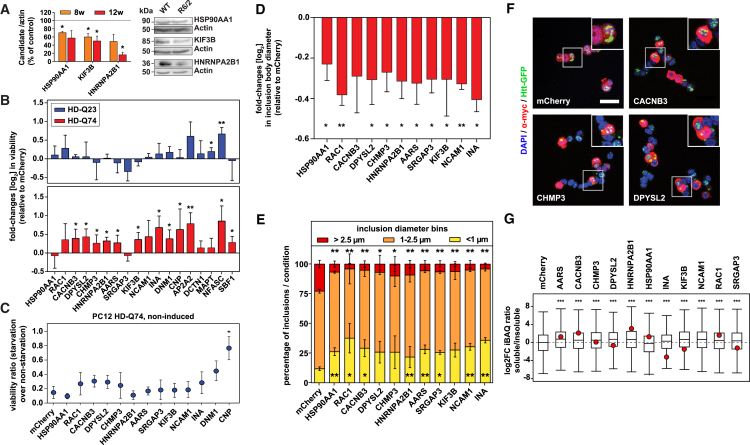
Aggregation of polyglutamine-expanded huntingtin exon 1 (HttEx1) in Huntington's disease (HD) proceeds from soluble oligomers to late-stage inclusions. The nature of the aggregates and how they lead to neuronal dysfunction is not well understood. We employed mass spectrometry (MS)-based quantitative proteomics to dissect spatiotemporal mechanisms of neurodegeneration using the R6/2 mouse model of HD. Extensive remodeling of the soluble brain proteome correlated with insoluble aggregate formation during disease progression. In-depth and quantitative characterization of the aggregates uncovered an unprecedented complexity of several hundred proteins. Sequestration to aggregates depended on protein expression levels and sequence features such as low-complexity regions or coiled-coil domains. In a cell-based HD model, overexpression of a subset of the sequestered proteins in most cases rescued viability and reduced aggregate size. Our spatiotemporally resolved proteome resource of HD progression indicates that widespread loss of cellular protein function contributes to aggregate-mediated toxicity.

Keywords: Huntington’s disease; cerebrospinal fluid; inclusion bodies; neurodegeneration; quantitative proteomics.


Figures

None
Graphical abstract
Figure 1
Figure 1
Experimental Design Brain regions from R6/2 and WT mice were assessed by quantitative LC-MS/MS. From each tissue sample, soluble and insoluble proteomes were measured. IBs were enriched by repetitive SDS washes and hydrolyzed in formic acid. Cerebrospinal fluid from each mouse was also analyzed. Number of animals: 5 weeks, 4 R6/2 and 4 WT; 8 weeks, 3 R6/2 and 3 WT; 12 weeks, 4 R6/2 and 4 WT.
Figure 2
Figure 2
Spatiotemporal Brain Proteome Resource (A) Ranking of brain proteins by iBAQ (intensity-based absolute quantification) copy numbers from highest to lowest. Strongest enrichment for each quartile is displayed for GO categories “biological process” and “cellular component”; BH-FDR, Benjamini-Hochberg-corrected false discovery rate. Cumulative protein mass from the highest to the lowest abundant protein shows that only a few proteins make up most of the protein mass. (B) iBAQ copy numbers for ∼8,500 proteins inversely correlate with molecular mass. Data points are colored by local point density. (C) Spatial resolution exposes functional brain region specificity. Three selected clusters display distinct protein expression across the four regions. p value, BH-FDR corrected; EF, enrichment factor of the most enriched GO term; MaxLFQ intensity, normalized label-free protein intensity. See also Figure S1 and Table S1.
Figure 3
Figure 3
Drastic Proteome Remodeling of R6/2 Mice after Disease Onset (A and B) PCA projections (A) and PCA loadings (B) of all soluble samples reveal specific effects on the proteome driven by the genotype, age, and differential spatial expression. Data points in (B) are colored by local point density. (C) Hierarchical clustering of protein expression over time shows substantial proteome shifts from early stages of HD onward. The two most upregulated (red and orange) or downregulated (blue and cyan) clusters are indicated. (D) Top 20 Euclidean distance tracking of protein expression profiles similar to Pde10a over time and across brain regions; gray boxes indicate striatal expression (upper panel). Boxplots of Z-scored MaxLFQ intensities for the striatal top 20 set (lower panel). Reduced expression of all targets in R6/2 samples compared to WT. See also Figure S2.
Figure 4
Figure 4
Altered Cerebrospinal Fluid Proteome in R6/2 Mice (A) Hierarchical clustering of cerebrospinal fluid protein expression reveals good separation of R6/2 and WT mice; row bars indicate filters for known GO annotations related to secretion (see Supplemental Experimental Procedures for details). (B) PCA projections of all cerebrospinal fluid samples show good separation between WT and R6/2 mice. (C) Corresponding PCA loadings of (B) reveal strong inflammatory response in R6/2 animals. The color bar displays the 1D annotation score with the two most enriched annotations for R6/2 mice; the annotation score indicates the center of the protein distribution of each significant annotation category relative to the overall distribution of values. p value, BH-FDR corrected. (D) Correlation of protein expression changes between different disease stages is high within the soluble proteome (purple inlay) but low for the comparison of the soluble proteome with the cerebrospinal fluid (green inlay) of R6/2 mice. See also Table S2.
Figure 5
Figure 5
In-Depth Characterization of PolyQ Aggregates (A) Distribution of iBAQ values for 12 week R6/2 striata. Pie chart distribution of annotations for the top 50 proteins. (B and C) Proteins with dysregulated soluble expression (color coding from Figure 3C) are enriched in R6/2 insoluble fractions, superimposing enrichment for all 12 week brain regions together. The most enriched insoluble proteins and endogenous Htt is indicated. (D–G) Significant enrichment of proteins with longer polyQ (D) and LCRs (E), more CCDs (F), and higher molecular weight (MW) (G) in 12 week R6/2 over WT striata. Mann-Whitney U test. See also Figures S3–S5 and Table S3.
Figure 6
Figure 6
Functional Attributes of PolyQ Aggregates (A) Ranking of proteins by iBAQ ratios representing protein sequestration from the soluble to the insoluble proteome in R6/2 cortices. Gray boxes show the number of proteins that were only identified in the insoluble proteome per age group, indicated by infinite iBAQ ratios. (B) Annotation matrix of protein attributes, such as complexes, gene ontologies, and pathways, highlighting changes in the spatiotemporal composition of the insoluble fraction. The color code indicates normalized median abundance of the proteins belonging to each category relative to the distribution of all proteins. Selected annotations are highlighted. Red, most abundant; blue, least abundant. Mann-Whitney U test (BH-FDR < 0.05). See also Figure S6 and Table S3.
Figure 7
Figure 7
Overexpression of Loss-of-Function Candidates Ameliorates HttEx1 Phenotypes (A) Left: quantification of candidates in immunoblots of 8- and 12-week-old R6/2 striata, normalized to WT (dotted line). Student’s t test, p < 0.05; n = 3–4. Right: representative examples of immunoblots from 12-week-old striata. (B) Log2 fold changes (log2FCs) in viability of HD-Q23 (upper panel) or HD-Q74 (lower panel) cells transfected with the candidates as measured by lactate dehydrogenase (LDH) assay. Multiple one-tailed t test with Benjamini-Hochberg correction; FDR < 0.05, ∗∗FDR < 0.01; normalized to mCherry controls; n = 4. (C) Candidates’ effects on the viability of starved, non-induced HD-Q74 cells. Multiple two-tailed t test with Benjamini-Hochberg correction; FDR < 0.05; n = 3. (D) Log2FCs in IB diameter in HD-Q74 cells transfected with the candidates. Multiple two-tailed t test with Benjamini-Hochberg correction; FDR < 0.05, ∗∗FDR < 0.01; normalized to mCherry; n = 3. (E) Distribution of IB diameter bins in HD-Q74 cells transfected with the candidates. Yellow, <1 μm; orange, 1–2.5 μm; red, >2.5 μm. Multiple two-tailed t test with Benjamini-Hochberg correction; FDR < 0.05, ∗∗FDR < 0.01; n = 3. (F) Representative images of HD-Q74 cells transfected with selected candidates. Blue, DAPI; red, myc candidate; green, HttEx1-GFP; scale bar, 20 μm. (G) Log2FCs in the soluble fraction of proteins after overexpression of candidates in HD-Q74 cells, determined by changes in iBAQ ratios (soluble to insoluble). The red dot indicates the iBAQ ratio of the candidate. Multiple two-tailed t test with Benjamini-Hochberg correction; ∗∗∗FDR < 0.001; n = 3. NCAM1 was not identified in the insoluble fraction in this experiment. See also Figure S7.

References

    1. Acuña A.I., Esparza M., Kramm C., Beltrán F.A., Parra A.V., Cepeda C., Toro C.A., Vidal R.L., Hetz C., Concha I.I. A failure in energy metabolism and antioxidant uptake precede symptoms of Huntington’s disease in mice. Nat. Commun. 2013;4:2917. - PMC - PubMed
    1. Aebersold R., Mann M. Mass-spectrometric exploration of proteome structure and function. Nature. 2016;537:347–355. - PubMed
    1. Arrasate M., Mitra S., Schweitzer E.S., Segal M.R., Finkbeiner S. Inclusion body formation reduces levels of mutant huntingtin and the risk of neuronal death. Nature. 2004;431:805–810. - PubMed
    1. Baldo B., Paganetti P., Grueninger S., Marcellin D., Kaltenbach L.S., Lo D.C., Semmelroth M., Zivanovic A., Abramowski D., Smith D. TR-FRET-based duplex immunoassay reveals an inverse correlation of soluble and aggregated mutant huntingtin in Huntington’s disease. Chem. Biol. 2012;19:264–275. - PubMed
    1. Byrne L.M., Wild E.J. Cerebrospinal fluid biomarkers for Huntington’s disease. J. Huntingtons Dis. 2016;5:1–13. - PubMed