

Cause-specific mortality for 249 causes in Brazil and states during 1990-2015: a systematic analysis for the global burden of disease study 2015
- PMID: 29166948
- PMCID: PMC5700707
- DOI: 10.1186/s12963-017-0156-y
Cause-specific mortality for 249 causes in Brazil and states during 1990-2015: a systematic analysis for the global burden of disease study 2015
Abstract
Background: Reliable data on cause of death (COD) are fundamental for planning and resource allocation priorities. We used GBD 2015 estimates to examine levels and trends for the leading causes of death in Brazil from 1990 to 2015.
Methods: We describe the main analytical approaches focused on both overall and specific causes of death for Brazil and Brazilian states.
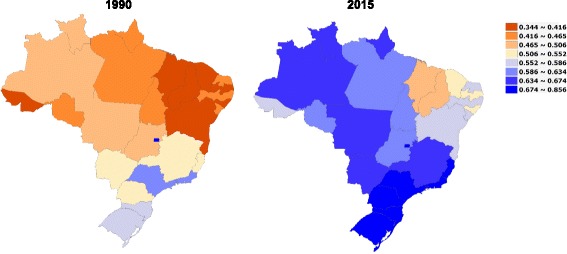
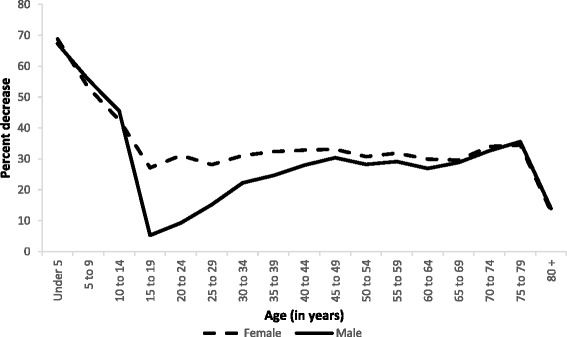
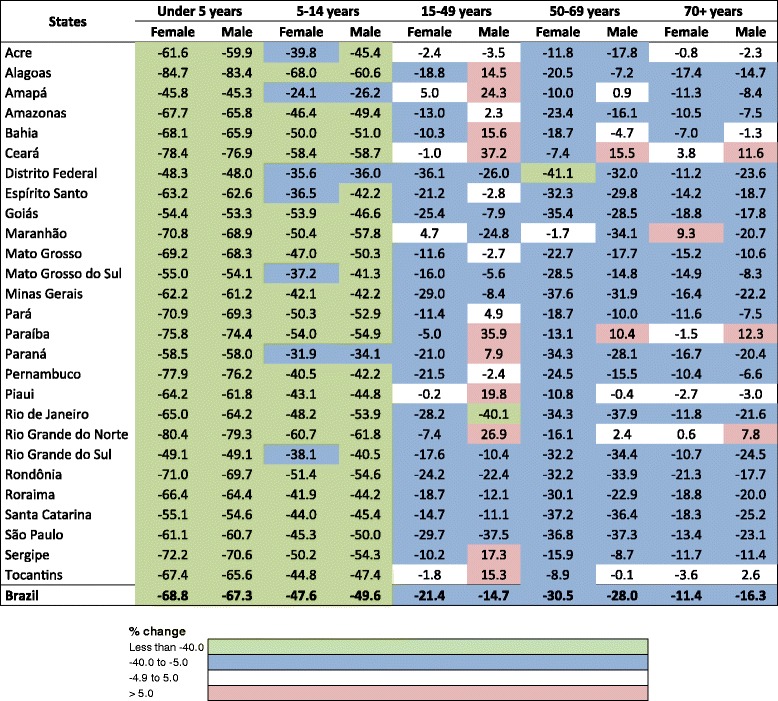
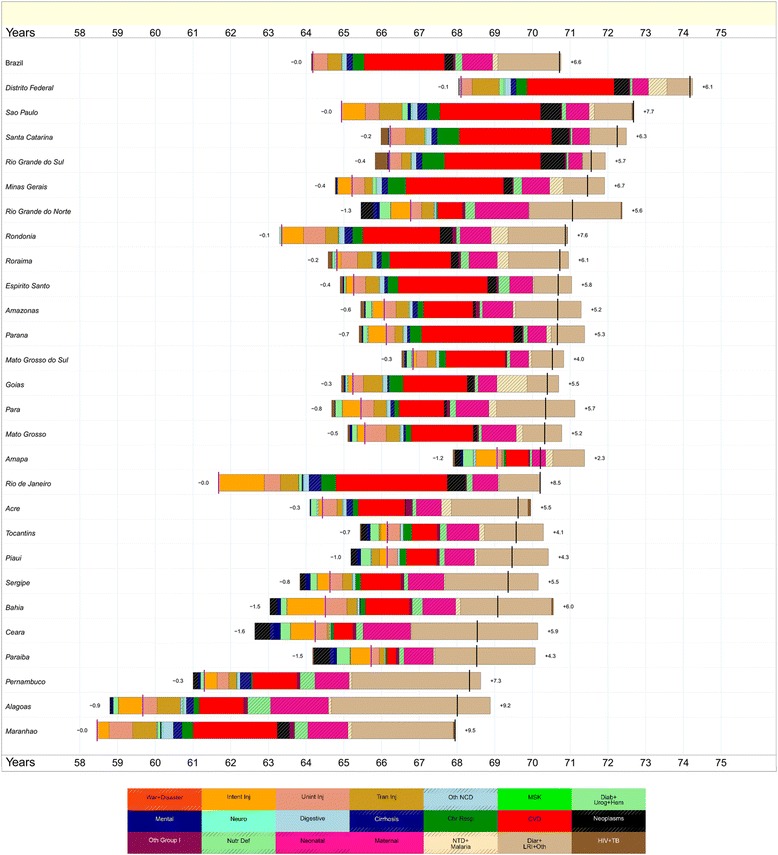
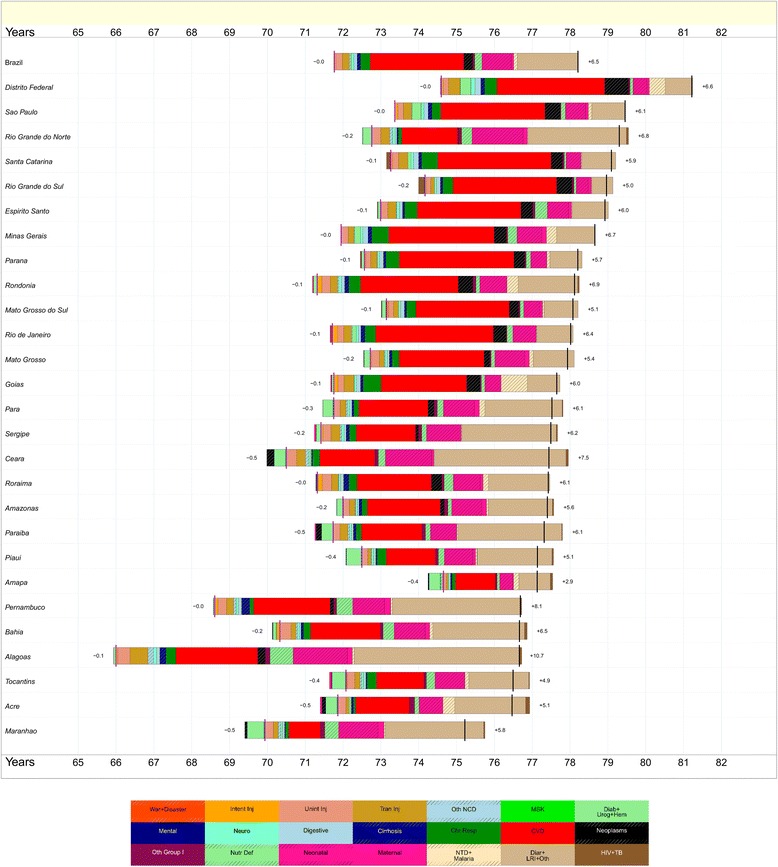
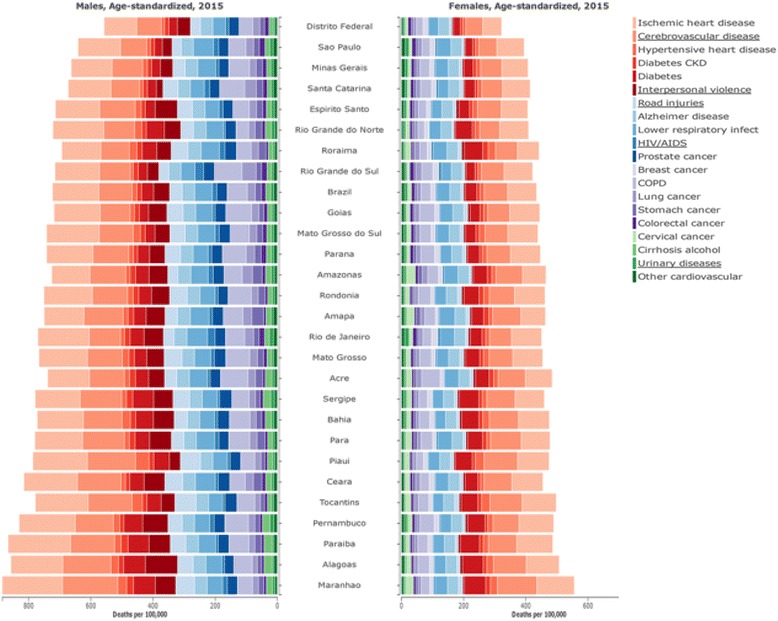
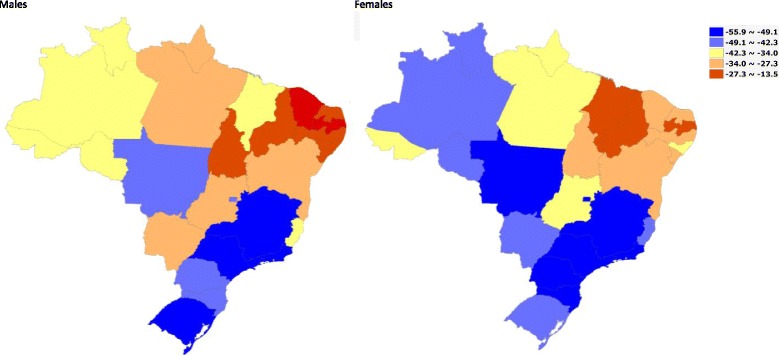
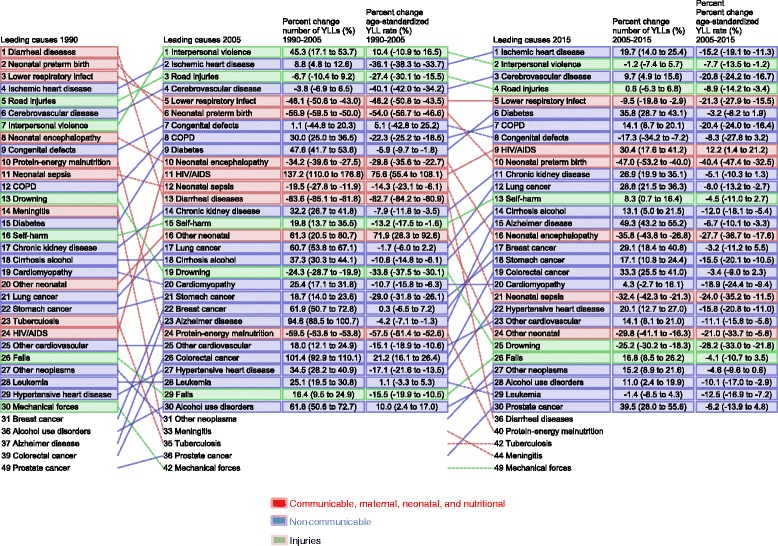
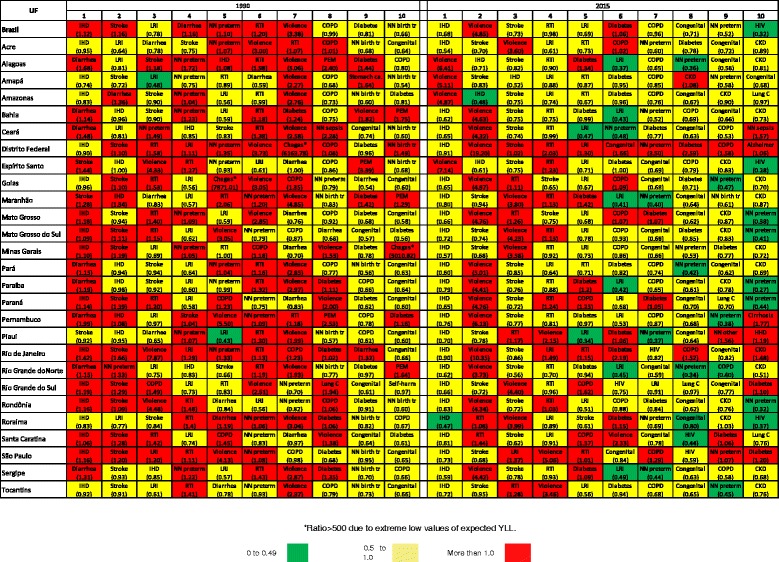
Results: There was an overall improvement in life expectancy at birth from 1990 to 2015, but with important heterogeneity among states. Reduced mortality due to diarrhea, lower respiratory infections, and other infectious diseases contributed the most for increasing life expectancy in most states from the North and Northeast regions. Reduced mortality due to cardiovascular diseases was the highest contributor in the South, Southeast, and Center West regions. However, among men, intentional injuries reduced life expectancy in 17 out of 27 states. Although age-standardized rates due to ischemic heart disease (IHD) and cerebrovascular disease declined over time, these remained the leading CODs in the country and states. In contrast, leading causes of premature mortality changed substantially - e.g., diarrheal diseases moved from 1st to 13th and then the 36th position in 1990, 2005, and 2015, respectively, while violence moved from 7th to 1st and to 2nd. Overall, the total age-standardized years of life lost (YLL) rate was reduced from 1990 to 2015, bringing the burden of premature deaths closer to expected rates given the country's Socio-demographic Index (SDI). In 1990, IHD, stroke, diarrhea, neonatal preterm birth complications, road injury, and violence had ratios higher than the expected, while in 2015 only violence was higher, overall and in all states, according to the SDI.
Conclusions: A widespread reduction of mortality levels occurred in Brazil from 1990 to 2015, particularly among children under 5 years old. Major shifts in mortality rates took place among communicable, maternal, neonatal, and nutritional disorders. The mortality profile has shifted to older ages with increases in non-communicable diseases as well as premature deaths due to violence. Policymakers should address health interventions accordingly.
Keywords: Brazil; Causes of death; Global burden of disease; Mortality.
Conflict of interest statement
Ethics approval and consent to participate
The protocol for this study was approved by the Research Ethics Committee of the Federal University of Minas Gerais (Project CAAE 62803316.7.0000.5149).
Consent for publication
Not applicable.
Competing interests
The authors declare that they have no competing interests.
Publisher’s Note
Springer Nature remains neutral with regard to jurisdictional claims in published maps and institutional affiliations.
Figures
References
-
- IBGE. Instituto Brasileiro de Geografia e Estatística. http://www.ibge.gov.br/english/estatistica/populacao/censo2010/default_r.... Accessed 4 June 2016.
-
- World Bank. Brazil overview. http://www.worldbank.org/en/country/brazil/overview. Accessed 4 June 2016.
-
- UNDP Human Development Report 2015. Work for human development. Briefing note for countries on the 2015 Human Development Report-Brazil. http://hdr.undp.org/sites/default/files/2015_human_development_report.pdf. Accessed 11 Nov 2016.
-
- Paim J, Travassos C, Almeida C, Bahia L, Macinko J. The Brazilian health system: history, advances, and challenges. Lancet. 2011; doi:10.1016/S0140-6736(11)60054-8. - PubMed
MeSH terms
Grants and funding
LinkOut - more resources
Full Text Sources
Other Literature Sources
Medical
