

Review
doi: 10.1104/pp.17.00962.
Epub 2017 Nov 22.
Advances in Imaging Plant Cell Dynamics
Affiliations
- PMID: 29167354
- PMCID: PMC5761809
- DOI: 10.1104/pp.17.00962
Item in Clipboard
Review
Advances in Imaging Plant Cell Dynamics
Plant Physiol.
2018 Jan.
Abstract
Advanced bioimaging uncovers insights into subcellular structures of plants.
Figures
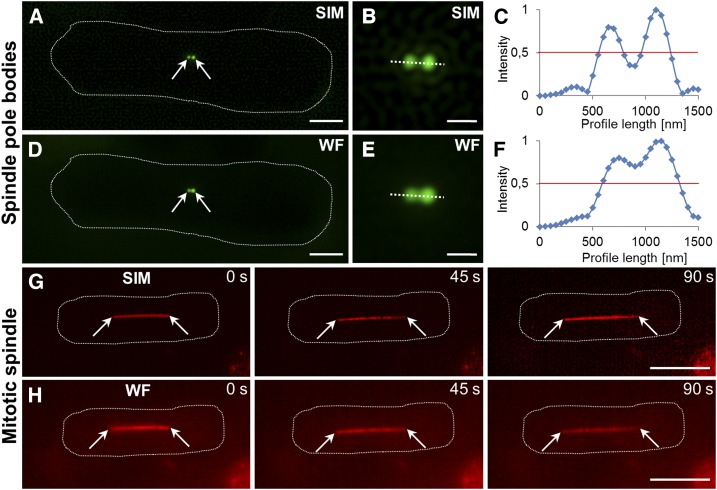
Comparative structured illumination and wide-field epifluorescence microscopy imaging of Schizosaccharomyces pombe cytoskeletal structures. A to C, Newly separated spindle pole bodies in a premitotic cell (A and B) and their clear discrimination based on normalized fluorescence intensity profiling (C) by means of SIM in S. pombe cells expressing the GFP-pcp1 spindle pole marker. D to F, Spindle bodies as visualized by wide-field epifluorescence (D and E) with less prominent resolution (F) compared with SIM. G and H, Mitotic spindle elongation visualized by SIM (G) and wide-field epifluorescence (H) in S. pombe cells expressing an mCherry-atb2 microtubule marker. Arrows indicate spindle pole bodies (A and D) and mitotic spindle poles (G and H). Bars = 2 µm (A and D), 1 µm (B and E), and 5 µm (G and H).
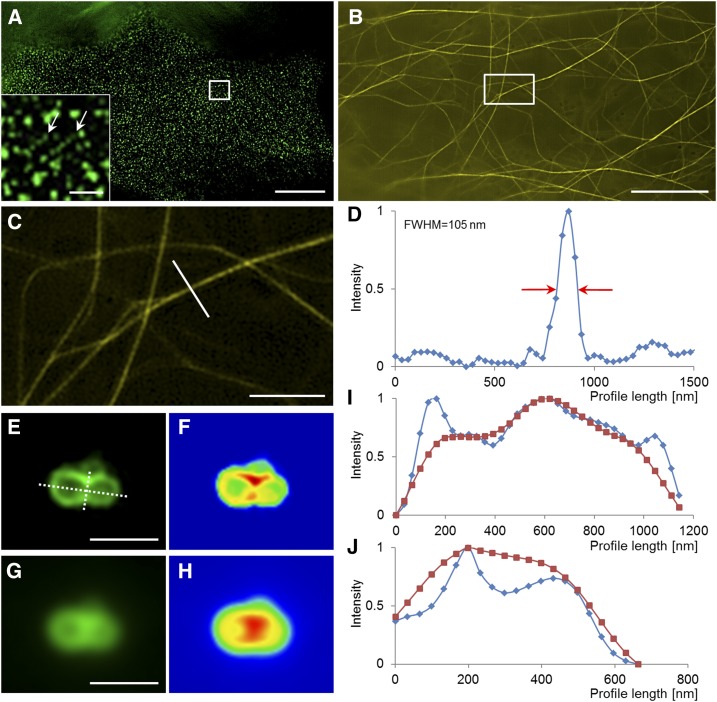
The superresolution potential of structured illumination microscopy applied to subcellular live imaging of plants. A, Imaging of Flot1 clusters at the plasma membrane of an Arabidopsis cotyledon pavement cell expressing a GFP-Flot1 marker. The inset shows two linear clusters of Flot1 particles (arrows). B to D, Imaging of the actin cytoskeleton in a hypocotyl epidermal cell expressing a YFP-FABD2-YFP actin marker (B; the boxed area is magnified in C) with the capacity to resolve fine actin bundles at approximately 100 nm at full width at half-maximum (FWHM) of the intensity profile (D) shown in C. E to J, Visualization of late endosome fusion with SIM imaging in root epidermal cells or Arabidopsis expressing a GFP-FYVE late endosomal reporter (E and F) as compared with wide-field epifluorescence (G and H). The graphic depiction of the longitudinal (I) and the transverse (J) profiles, drawn as dotted lines in E, highlights the potential of SIM to identify the area of fusion as an area of decreased fluorescence intensity. Bars = 10 μm (A and B), 2 μm (C), and 1 μm (E, G, and inset in A).

Structured illumination microscopy can deliver superresolved images of various plant organelles as compared with wide-field (WF) epifluorescence imaging. A and B, Plastids labeled by the marker ADP-sugar pyrophosphatase fused with GFP. C and D, Mitochondria labeled by the mitochondria-targeting sequence of the γ-subunit of the F1-ATPase fused with GFP. E and F, Nuclear structures of root epidermal cells expressing a nuclear localization signal-GFP marker. G and H, Nuclear structures of root epidermal cells expressing an HTB-mRFP marker. I and J, Structures of endoplasmic reticulum in root hairs stably expressing a GFP-HDEL marker. Bars = 2 μm (A–D, I, and J) and 10 μm (E–H).
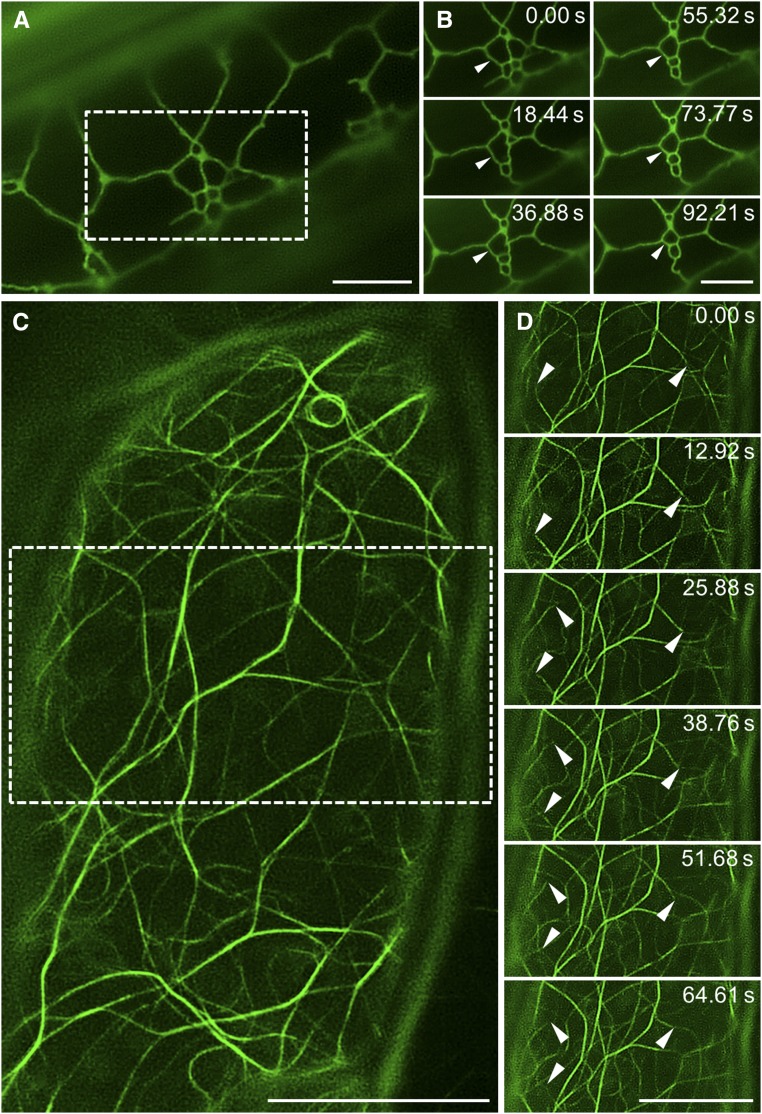
The potential for time-resolved structured illumination microscopy imaging. A and B, Overview (A) and time-lapse imaging (B) of cortical endoplasmic reticulum in a hypocotyl epidermal cell expressing a GFP-HDEL marker. The dynamic reorganization of the endoplasmic reticulum tubular structure is depicted by arrowheads (B). C and D, Overview (C) and time-lapse imaging (D) of actin filaments in a hypocotyl epidermal cell expressing a GFP-FABD2 marker. The dynamic reorganization of actin filaments is depicted by arrowheads (D). Bars = 5 μm (A and B) and 10 μm (C and D).

Photoactivation localization microscopy of EB1c protein in root epidermal cells of Arabidopsis expressing an EB1c-DRONPA marker and STED of actin filaments in Arabidopsis cotyledon epidermal cells expressing a GFP-FABD2 actin marker. A to C, Wide-field (WF) epifluorescence (A) and PALM (B) imaging and quantitative assessment (C) of the precision of localization of B at approximately 40 nm. D and E, Comparison of SIM (D) and PALM (E) localization of EB1c. F and G, Comparison of CLSM (F) and STED (G) imaging of actin filaments in Arabidopsis cotyledon epidermal cells. H and I, Volumetric CLSM (H) and STED (I) imaging of actin microfilament organization in Arabidopsis cotyledon epidermal cells. Bars = 2 μm (A, B, D, and E) and 10 μm (F–I).
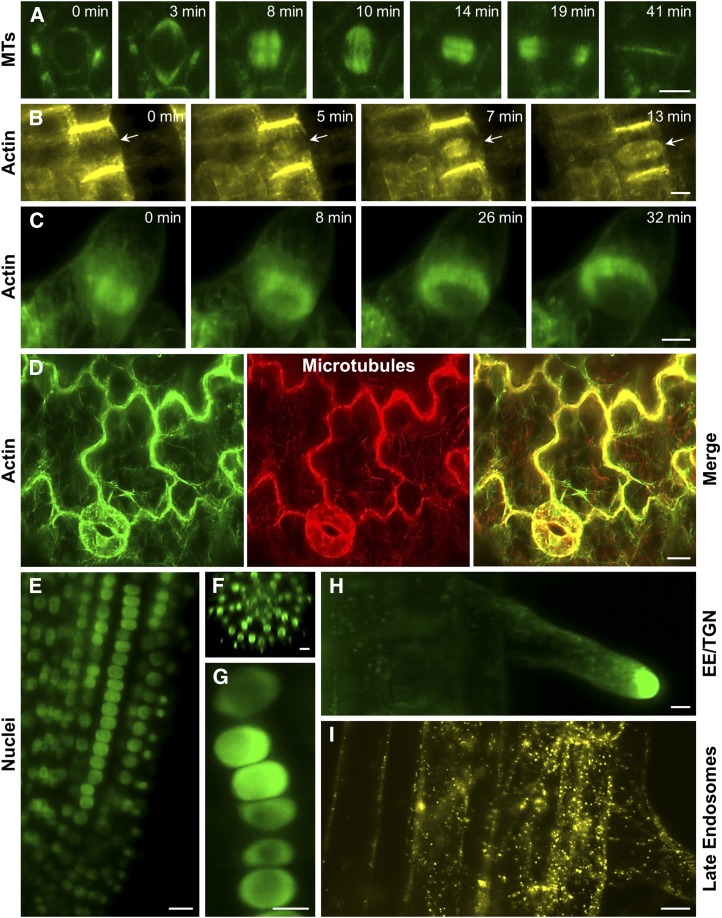
Advances of LSFM imaging of dynamic cellular and developmental processes in plants. A, Imaging of microtubules (MTs) in a time-course recording of a dividing Arabidopsis root epidermal cell as visualized using a GFP-TUA5 marker. B, Time-course imaging of actin in phragmoplast of a dividing Arabidopsis root epidermal cell (arrows) as visualized using a YFP-FABD2-YFP marker. C, Time-course imaging of actin in phragmoplast of a dividing BY-2 suspension cell as visualized using a GFP-Lifeact marker. D, Covisualization of actin using GFP-FABD2 and microtubules using mCherry-TUA5 in cotyledon stomata and pavement cells of Arabidopsis. E to G, Localization of EB1c in nuclei of Arabidopsis root as visualized using an EB1c-GFP marker. The high potential of LSFM for deep tissue imaging provides insight into EB1c-GFP nuclear localization in cells of different developmental zones (E), different root cell layers (F), as well as in individual cell files (G). H, Localization of the small Rab GTPase RabA1d in early endosomal-trans-Golgi network (EE-TGN) compartments accumulating at the tip of growing root hairs as visualized using a GFP-RabA1d marker. I, Imaging of late endosomes in Arabidopsis cortical and epidermal root cells as visualized using a YFP-RabF2a marker. Bars = 5 µm (A, B, and G–I) and 10 µm (C–F).

References
Publication types
MeSH terms
LinkOut - more resources
Full Text Sources
Other Literature Sources
