. 2018 Jan 10;38(2):409-422.
doi: 10.1523/JNEUROSCI.2860-17.2017. Epub 2017 Nov 22.

Dissociable Decoding of Spatial Attention and Working Memory from EEG Oscillations and Sustained Potentials

Affiliations

Dissociable Decoding of Spatial Attention and Working Memory from EEG Oscillations and Sustained Potentials

Gi-Yeul Bae et al. J Neurosci. .

Abstract

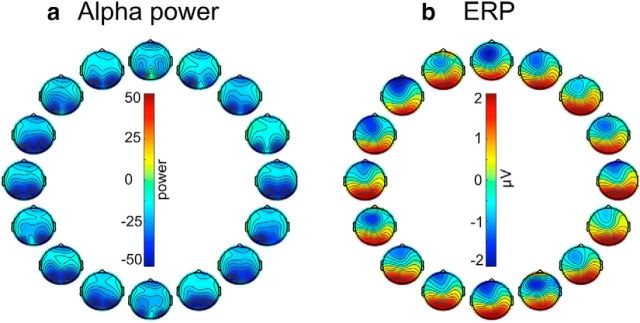
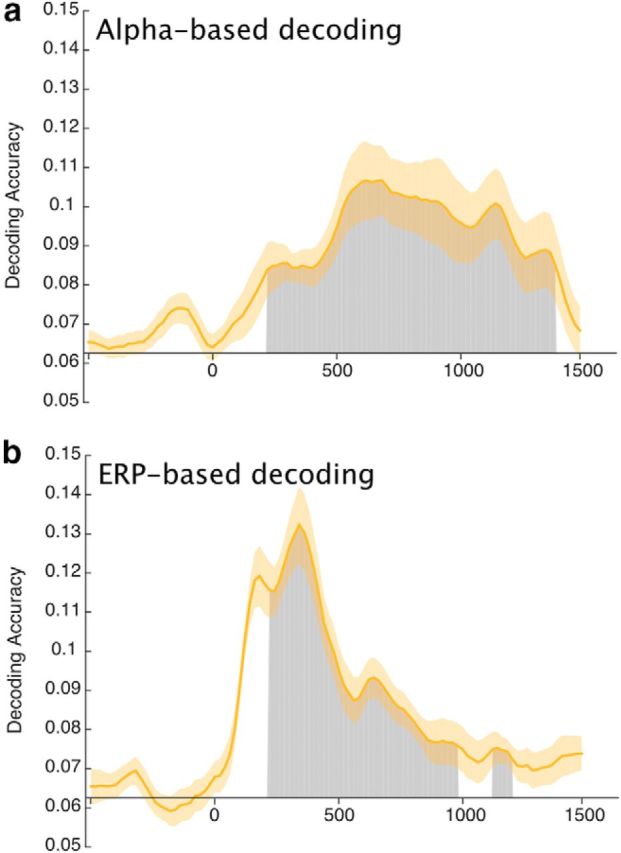
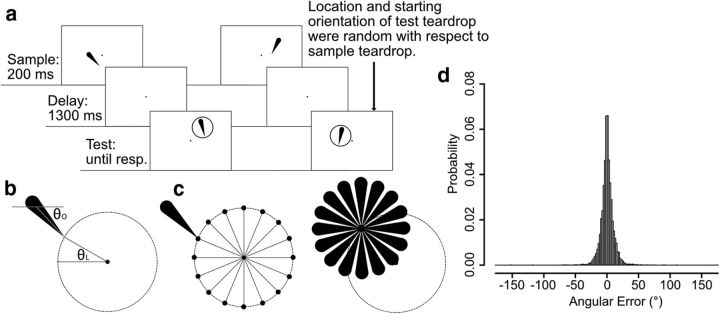
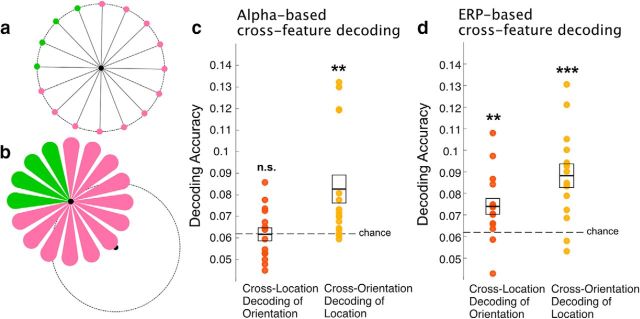
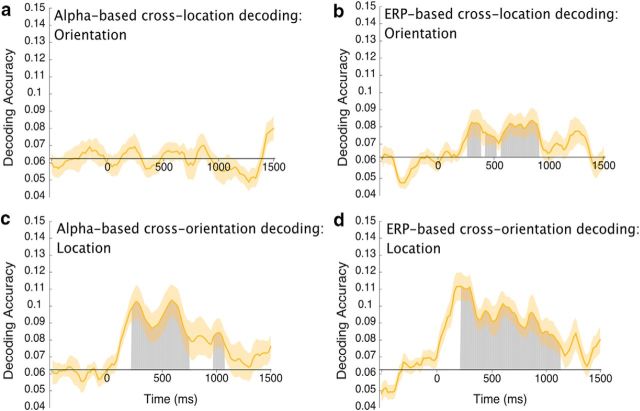
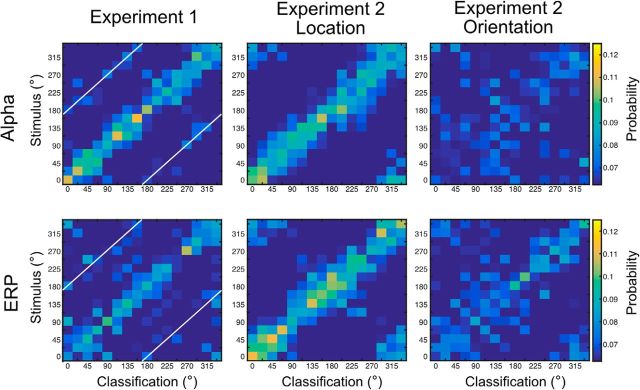
In human scalp EEG recordings, both sustained potentials and alpha-band oscillations are present during the delay period of working memory tasks and may therefore reflect the representation of information in working memory. However, these signals may instead reflect support mechanisms rather than the actual contents of memory. In particular, alpha-band oscillations have been tightly tied to spatial attention and may not reflect location-independent memory representations per se. To determine how sustained and oscillating EEG signals are related to attention and working memory, we attempted to decode which of 16 orientations was being held in working memory by human observers (both women and men). We found that sustained EEG activity could be used to decode the remembered orientation of a stimulus, even when the orientation of the stimulus varied independently of its location. Alpha-band oscillations also carried clear information about the location of the stimulus, but they provided little or no information about orientation independently of location. Thus, sustained potentials contain information about the object properties being maintained in working memory, consistent with previous evidence of a tight link between these potentials and working memory capacity. In contrast, alpha-band oscillations primarily carry location information, consistent with their link to spatial attention.SIGNIFICANCE STATEMENT Working memory plays a key role in cognition, and working memory is impaired in several neurological and psychiatric disorders. Previous research has suggested that human scalp EEG recordings contain signals that reflect the neural representation of information in working memory. However, to conclude that a neural signal actually represents the object being remembered, it is necessary to show that the signal contains fine-grained information about that object. Here, we show that sustained voltages in human EEG recordings contain fine-grained information about the orientation of an object being held in memory, consistent with a memory storage signal.

Keywords: EEG; ERP; alpha; decoding; orientation; working memory.


Figures

Figure 1.
Figure 1.
a, Possible attention-based strategy for remembering an orientation. Maintaining attention on one or both of the extreme ends of the grating over a delay interval could help an observer reproduce the orientation or detect changes in orientation at the end of the interval. Even if this was not the sole mechanism being used for the task, it would likely be useful for performing the task, and neural signals related to spatial attention could potentially be sufficient to produce above-chance decoding of the orientation. b, Delayed estimation task used in Experiment 1. On each trial, participants fixated at the central dot for 500 ms (not shown here) and then saw a 200 ms teardrop. After a 1300 ms delay period, a response ring appeared, followed by a test teardrop as soon as the participant began moving the mouse. Participants used the mouse to adjust the orientation of the test teardrop until it matched the remembered orientation of the sample teardrop. The tip of the test teardrop pointed toward the mouse cursor, and participants clicked the mouse button to finalize their report. c, Probability distribution of response errors in Experiment 1, collapsed across all participants.
Figure 2.
Figure 2.
Topography of (a) instantaneous alpha power and (b) ERP activity for each of 16 sample orientations, averaged across the delay interval and participants in Experiment 1. Both alpha power and ERP amplitude were computed relative to the prestimulus baseline period. The position of each scalp map corresponds to the orientation of the sample teardrop.
Figure 3.
Figure 3.
Mean accuracy of (a) alpha-based decoding and (b) ERP-based decoding in Experiment 1. Chance-level performance (0.0625 = 1/16) is indicated by the black horizontal lines. Gray areas indicate clusters of time points in which the decoding was significantly greater than chance after correction for multiple comparisons. Note that the first 200 ms following stimulus onset were excluded from the statistical analysis to minimize any contributions of sensory activity to the decoding. The orange shading indicates ±1 SEM.
Figure 4.
Figure 4.
a, Two example trials of the delayed estimation used in Experiment 2: on each trial, participants fixated the central dot for 500 ms (not shown) and then saw a 200 ms teardrop. After a 1300 ms delay period, a second teardrop was presented at a different random location, and the participant used a mouse to adjust this second teardrop's orientation so that it matched the remembered orientation of the first teardrop. b, Definition of θL (the angular location of the teardrop tip) and θO (the orientation of the teardrop): θL was defined by the location (in polar coordinates) of the tip of the teardrop object relative to an invisible circle with a radius of 2.17°, centered on the fixation dot. θO was defined by the orientation of the tip of the teardrop relative to the center of the teardrop. c, Independence of θL and θO. The tip of a teardrop with a given θO could be presented at any of the 16 θL values, and a teardrop with a given θL could have any of the 16 θO values. d, Probability distribution of response errors collapsed across all participants.
Figure 5.
Figure 5.
Scalp topography of (a) instantaneous alpha power and (b) ERP activity relative to prestimulus baseline for each of the 16 orientations of the sample teardrop, averaged across the delay interval and participants. The position of each scalp map corresponds to the orientation of the sample teardrop. Topography of (c) alpha power and (d) ERP activity for each of the 16 locations of the sample teardrop tip, averaged across the delay interval and participants. The position of each scalp map corresponds to the location of the tip of the sample teardrop. Both alpha power and ERP amplitude were computed relative to the prestimulus baseline period.
Figure 6.
Figure 6.
Alpha-based decoding accuracy for (a) the orientation of the sample teardrop and (c) the location of the sample teardrop tip. ERP-based decoding accuracy for (b) the orientation of the sample teardrop and (d) the location of the sample teardrop tip. Each gray area shows a cluster of time points for which the decoding was greater than chance after correction for multiple comparisons. The red lines in c and d indicate clusters of time points in which the decoding was significantly greater for location than for orientation. The orange shading indicates ±1 SEM. Note that the first 200 ms following stimulus onset were excluded from the statistical analysis to minimize any contributions of sensory activity to the decoding.
Figure 7.
Figure 7.
Cross-feature decoding. a, To completely remove the impact of the tip location on the decoding of orientation, we trained the decoders using data from teardrops presented in three of the four quadrants (indicated by pink locations) and then tested the decoding on trials from the remaining quadrant (indicated by green locations). This was repeated four times, using each quadrant as the test quadrant once. b, The analogous procedure was used for location decoding. The decoders were trained to decode location using ¾ of the orientations (indicated by pink teardrops), and then tested with the other ¼ (indicated by green teardrops). c, Alpha-based cross-feature decoding accuracy for orientation and location, averaged over the entire delay period (d) ERP-based cross-feature decoding accuracy for orientation and location, averaged over the entire delay period for orientation and location. Each participant is represented by a dot, and the mean ± 1 SEM are indicated by the line and box. **p < 0.01, ***p < 0.001.
Figure 8.
Figure 8.
Average cross-feature decoding accuracy at each time point. a, Average accuracy of alpha-based cross-location decoding of orientation. b, Average accuracy of ERP-based cross-location decoding of orientation. c, Average accuracy of alpha-based cross-orientation decoding of location. d, Average accuracy of ERP-based cross-orientation decoding of location. The orange shading indicates ±1 SEM. Gray areas represent clusters of points with significantly above-chance decoding accuracy after correction for multiple comparisons. Note that the first 200 ms following stimulus onset were excluded from the statistical analysis to minimize any contributions of sensory activity to the decoding.
Figure 9.
Figure 9.
Confusion matrices for alpha-based (top row) and ERP-based (bottom row) decoding for Experiment 1 (left column), Experiment 2 location (middle column), and Experiment 2 orientation (right column). Each cell shows the probability of a given classification response (x-axis) for given a stimulus value (y-axis), averaged over the entire delay interval and across observers. The white diagonal lines indicate classification responses that are 180° from the stimulus value. Note that the values in the top left and bottom right corners of each matrix represent stimulus–response combinations that are actually adjacent to the stimulus–response combinations in the bottom left and top right corners (because these matrices provide a linear representation of a circular stimulus space).

References

    1. Adrian ED, Matthews BHC (1934) The Berger rhythm: potential changes from the occipital lobes in man. Brain 57:355–385. 10.1093/brain/57.4.355 - DOI - PubMed
    1. Awh E, Jonides J (2001) Overlapping mechanisms of attention and spatial working memory. Trends Cogn Sci 5:119–126. 10.1016/S1364-6613(00)01593-X - DOI - PubMed
    1. Awh E, Jonides J, Reuter-Lorenz PA (1998) Rehearsal in spatial working memory. J Exp Psychol Hum Percept Perform 24:780–790. 10.1037/0096-1523.24.3.780 - DOI - PubMed
    1. Awh E, Anllo-Vento L, Hillyard SA (2000) The role of spatial selective attention in working memory for locations: evidence from event-related potentials. J Cogn Neurosci 12:840–847. 10.1162/089892900562444 - DOI - PubMed
    1. Bisiach E. (1996) Unilateral neglect and the structure of space representation. Curr Dir Psychol Sci 5:62–65. 10.1111/1467-8721.ep10772737 - DOI

Publication types