. 2017 Nov 23;8(1):1730.
doi: 10.1038/s41467-017-01911-8.

Inactivation of KCNQ1 potassium channels reveals dynamic coupling between voltage sensing and pore opening

Affiliations

Inactivation of KCNQ1 potassium channels reveals dynamic coupling between voltage sensing and pore opening

Panpan Hou et al. Nat Commun. .

Abstract

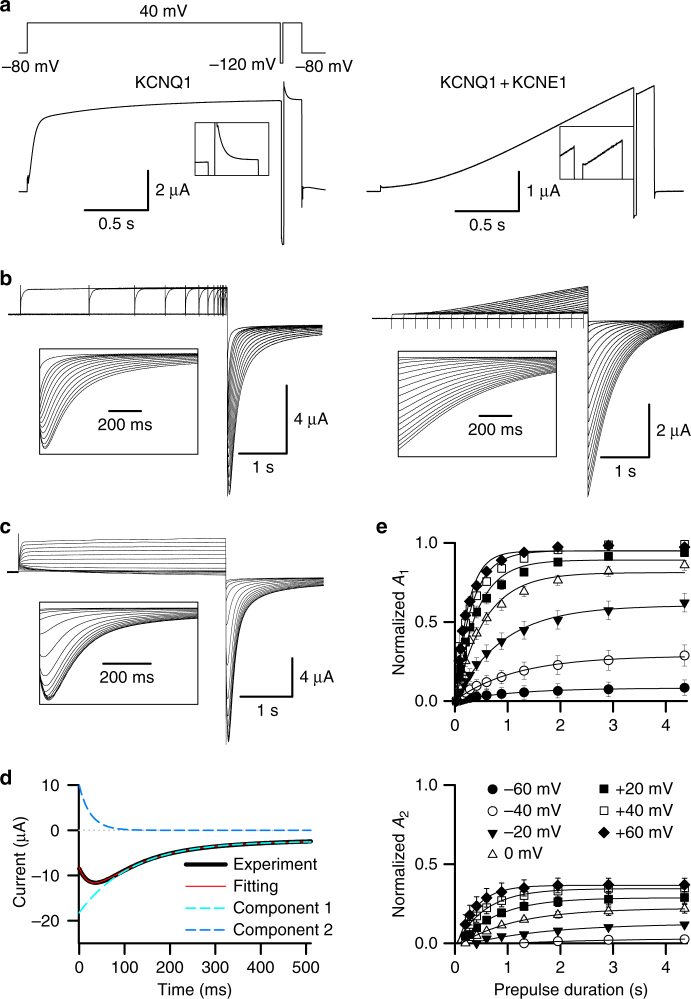
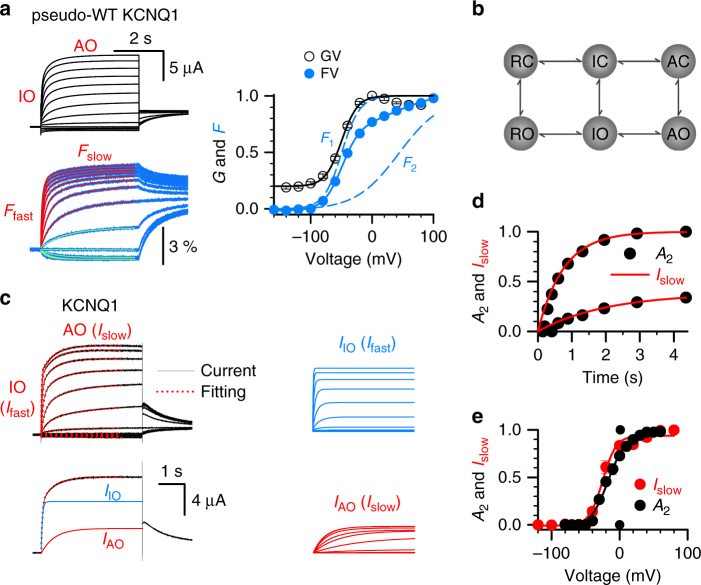
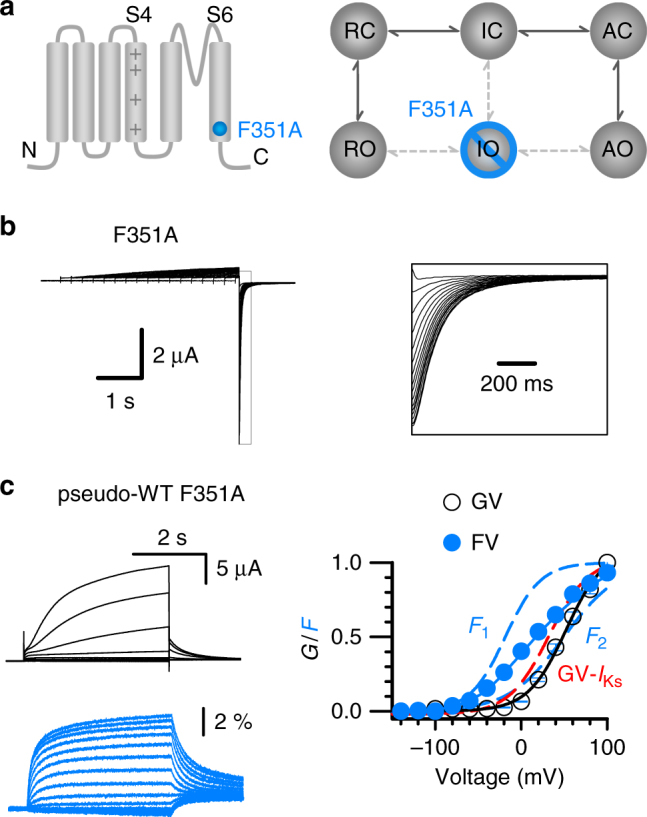
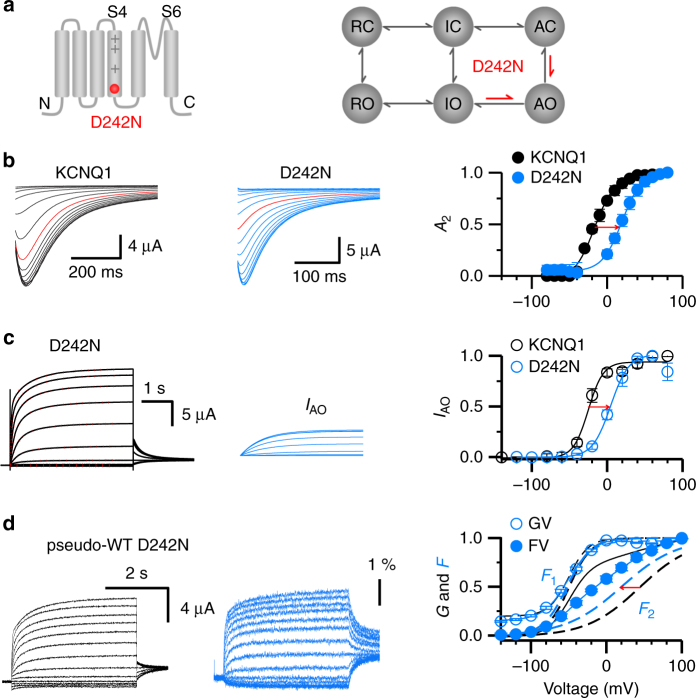
In voltage-activated ion channels, voltage sensor (VSD) activation induces pore opening via VSD-pore coupling. Previous studies show that the pore in KCNQ1 channels opens when the VSD activates to both intermediate and fully activated states, resulting in the intermediate open (IO) and activated open (AO) states, respectively. It is also well known that accompanying KCNQ1 channel opening, the ionic current is suppressed by a rapid process called inactivation. Here we show that inactivation of KCNQ1 channels derives from the different mechanisms of the VSD-pore coupling that lead to the IO and AO states, respectively. When the VSD activates from the intermediate state to the activated state, the VSD-pore coupling has less efficacy in opening the pore, producing inactivation. These results indicate that different mechanisms, other than the canonical VSD-pore coupling, are at work in voltage-dependent ion channel activation.


Conflict of interest statement

The authors declare no competing financial interests.

Figures

Fig. 1
Fig. 1
Time and voltage dependence of KCNQ1 hook currents. a Left, representative KCNQ1 fast decay current recorded in ND96 solution from a triple pulse protocol. The hyperpolarizing pulse was for 20 ms at −120 mV, and the depolarizing pulse was to +40 mV. The inset shows the fast decaying currents in response to the return of the voltage to +40 mV after hyperpolarization, with expanded current and time scales. Right, representative KCNQ1 + KCNE1 current recorded under the same conditions. b Left, time dependence of KCNQ1 hook currents recorded in high potassium (100 mM K+) solution. The pre-pulses were +40 mV with time durations ranging between 0.02 and 4.355 s, and the test pulse was 2 s long at −120 mV. The inset shows the hook in tail currents with an expanded time scale. Right, representative KCNQ1 + KCNE1 current recorded under the same conditions. c Voltage dependence of KCNQ1 hook currents recorded in high potassium (100 K+) solution. The pre-pulse was 4 s with voltages ranging from −80 to +60 mV, and the test pulse was 2 s at −120 mV. The inset shows tail currents with an expanded time scale. d KCNQ1 hook current (black) fitted with the double exponential function F(t) = A 1 × exp(−t/τ 1) + A 2 × exp(−t2) + C. The fitting curve, slow component (A 1 × exp(−t/τ 1) + C), and hook component (A 2 × exp(−t/τ 2)) are shown in red, cyan, and blue, respectively. e Normalized A 1 (top) and A 2 (bottom) of KCNQ1 hook currents vs. time durations of the pre-pulse, with voltages ranging from −60 to +60 mV (n ≥ 4). Error bars are SEM
Fig. 2
Fig. 2
Similar time and voltage dependence of hook currents and the AO state of the KCNQ1 channel. a VCF recordings of pseudo-WT (C214A/G219C/C331A) KCNQ1 currents (black) and fluorescence (blue), with voltages from −140–100 mV in 20 mV increments and back to −40 mV to test the tail currents. The fluorescent traces were fitted with a single (green) exponential equation below −50 mV, and a double (red) exponential equation above −50 mV showing both F fast and F slow components. Right panel, the GV (black, V 50 = −49.12 mV, slope = 13.81) and FV (blue) relationships with F 1 (V 50 = −49.17 mV, slope = 14.67) and F 2 (V 50 = 43.57 mV, slope = 38.00) components (dotted lines). b The scheme shows the two-step VSD movements R ↔ I ↔ A and channel opening C ↔ O. c Upper left, the WT KCNQ1 currents (black lines) recorded with voltage ranging from −120–80 mV were fitted with a double exponential function (red dots). The tail currents were measured at −40 mV. Lower left, the current (black line) recorded at 40 mV was fit with a double exponential function (red dots). The blue trace is the fast component (I fast) representing the current of the IO state, and the red trace is the slow component (I slow) representing the current of the AO state. Right, I fast and I slow from the currents in upper left. d Dependence of A 2 on the pre-pulse duration (black, from Fig. 1e) and I slow on test pulse duration (red, from Fig. 2c) at −20 and +40 mV. e The dependences of A 2 on pre-pulse voltages (black, from Fig. 1e) and I slow on test pulse voltages (red, from Fig. 2c) of KCNQ1 channels. The voltage for half activation (V 1/2) of A 2V and I slowV is −18.2 ± 2.1 mV and −25.0 ± 2.7 mV, respectively. n ≥ 4. Error bars are the SEM. RC resting closed, IC intermediate closed, AC activated closed, RO resting open, IO intermediate open, AO activated open
Fig. 3
Fig. 3
F351A suppresses the IO state and eliminates hook currents. a Schemes to illustrate the location of the mutation in the KCNQ1 subunit (left) and show that the IO state was suppressed by F351A mutation (right). b Representative hook currents of F351A recorded in 100 mM K+ solution. The pre-pulses were +40 mV, with 0.02–4 s time durations, and the test pulse was 2 s long at −120 mV. The right panel shows tail currents with an expanded time scale. c VCF recordings of F351A currents (black) and florescence (blue). Right panel shows the GV (open circle) and FV (solid circle) relationships of F351A with the F 1 and F 2 components (dotted blue lines). The red dotted line is the GV relationship of IKs channels. n ≥ 4. Error bars are the SEM
Fig. 4
Fig. 4
S338F suppresses the AO state and eliminates hook currents. a Schemes to illustrate that the AO state was suppressed by S338F mutation. b Representative currents of S338F recorded in 100 mM K+ solution. The pre-pulses were +40 mV with 0.02–4 s time durations, and the test pulse was 2 s long at −120 mV. The inset shows tail currents with an expanded time scale. c Representative currents of S338F and S338F + KCNE1 with voltages ranging from −100 to +60 mV. S338F currents were fitted with a single exponential function (red dots). At 60 mV, only the first 1 s of the current was fitted. d Representative currents of E1R/R4E/S338F and E1R/R2E/S338F with voltages ranging from −100 to +40 mV. Currents are shown on the same scale. e VCF recordings of S338F/F351A currents (black) and fluorescence changes (blue). f VCF recordings of S338F currents (black) and fluorescence (red). g The GV (black) and FV (red) relationships of S338F with the F 1 and F 2 components (dotted red lines). n ≥ 4. Error bars are the SEM
Fig. 5
Fig. 5
D242N shifts the voltage dependence of the AO state and hook currents. a Schemes showing that the D242N mutation shifted the voltage-dependent transitions of the AO state and the VSD-pore coupling in the AO state. b Left, the hook currents of KCNQ1 (black) and D242N (blue) recorded at −120 mV in 100 mM K+ solution, with pre-pulse voltages ranging from −80 mV to +80 mV. Currents at −20 mV are shown in red for comparison. Right, hook current (A 2) voltage dependences of WT KCNQ1 (black) and D242N (blue). c Left, D242N currents (left, black lines) responding to voltages from −120 to 80 mV are fitted with a double exponential function (red dots), and the currents of the AO state (I AO) are shown in blue (middle). Right, voltage dependence of the AO state in WT KCNQ1 (black) and D242N (blue). d VCF recordings of D242N currents (black) and fluorescence (red). Right panel, the GV (blue open circle) and FV (blue solid circle) relationships of D242N with the F 1 and F 2 components (dotted blue lines). The GV (black short dashed line) and FV (black line) relationships with the F 1 and F 2 components (dotted black lines) of the pseudo-WT KCNQ1 are shown in black for comparison. n ≥ 4. Error bars are the SEM
Fig. 6
Fig. 6
E1R/R2E, E1R/R4E, and KCNQ1-GFP single-channel recordings. The voltage protocol was the same for all recordings in this figure. The potential was stepped from a holding potential of −80 to +60 mV for 4 s, and then to −40 mV for 0.75 s, as shown above the current traces. a Representative single-channel current recordings made from membrane patches containing a single E1R/R2E channel. b Addition of 50 μM Chromanol 293B silenced all E1R/R2E channel activity after ~3 min of exposure. All-points histogram (blue) of the +60 mV portion of the fourth sweep down in a, with closed (maroon) and open (teal) Gaussian fits. The peak of the open component is 0.022 ± 0.002 pA. c, d Representative recordings of a single E1R/R4E channel (c) or E1R/R4E + KCNE1 (d). All-points histogram (blue) of E1R/R4E of the +60 mV portion of a sweep, showing a significant closed portion, with closed (blue) and open (green) Gaussian fits (c) and of 25 active E1R/R4E + KCNE1 sweeps (d). e Representative traces of single-channel recordings made from membrane patches containing a single GFP-tagged KCNQ1 channel. All points histogram (blue) of the +60 mV portion of sweeps in e, with closed (green) and open (gray) Gaussian fits. The peak of the open component is 0.02 ± 0.004 pA. f Ensemble average of seven active sweeps (of 75 total) of KCNQ1-GFP. The ensemble average was filtered again at 50 Hz to show the current waveform more clearly
Fig. 7
Fig. 7
A kinetic model accounts for the inactivation phenotype in KCNQ1. a Kinetic model of KCNQ1 channel gating. K ij = k ij × exp(z ij × F × V/(R × T)), where K ij is the voltage-dependent rate of transition from VSD state i to VSD state j, z is the equivalent gating charge, F is the Faraday constant (96485 C mol−1), V is voltage (in mV), R is the gas constant (8314 J kmol−1 K−1), and T is the absolute temperature (293 K). The intrinsic VSD-pore transitions k CO and k OC are assumed to be voltage-independent (i.e., constant), and the θ terms explicitly represent the net effect of all VSD-pore interactions within each channel state. b Model simulations of KCNQ1 inactivation currents stimulated with the activation protocol (upper, voltage stepped from −80 mV holding potential to −100 to +40 mV with 10 mV increment, and then stepped to −40 mV) and a triple pulse protocol (lower, same as in Fig. 1a). The insets are the enlarged currents. The values of the parameters are as follows: k RI = 0.012 ms−1, k IR = 0.00063 ms−1, k IA = 0.0019 ms−1, k AI = 0.0013 ms−1, z RI = 0.62 e, z IR = −0.55 e, z IA = 0.66 e, z AI = −0.34  e, k CO = 0.014 ms−1, k OC = 11.18 ms−1, θ RC = 15.52, θ IC = 0.17, θ AC = 3.03, θ RO = 0.031, θ IO = 1.36, θ AO = 2.11

Similar articles

Cited by

References

    1. Long SB, Campbell EB, Mackinnon R. Crystal structure of a mammalian voltage-dependent Shaker family K+ channel. Science. 2005;309:897–903. doi: 10.1126/science.1116269. - DOI - PubMed
    1. Papazian DM, et al. Electrostatic interactions of S4 voltage sensor in Shaker K+ channel. Neuron. 1995;14:1293–1301. doi: 10.1016/0896-6273(95)90276-7. - DOI - PubMed
    1. Larsson HP, Baker OS, Dhillon DS, Isacoff EY. Transmembrane movement of the shaker K+ channel S4. Neuron. 1996;16:387–397. doi: 10.1016/S0896-6273(00)80056-2. - DOI - PubMed
    1. Shen, H. et al. Structure of a eukaryotic voltage-gated sodium channel at near-atomic resolution. Science355, eaal4326 (2017). - PubMed
    1. Wu J, et al. Structure of the voltage-gated calcium channel Ca(v)1.1 at 3.6 A resolution. Nature. 2016;537:191–196. doi: 10.1038/nature19321. - DOI - PubMed

Publication types

MeSH terms