

Mussel larvae modify calcifying fluid carbonate chemistry to promote calcification
- PMID: 29167466
- PMCID: PMC5700083
- DOI: 10.1038/s41467-017-01806-8
Mussel larvae modify calcifying fluid carbonate chemistry to promote calcification
Abstract
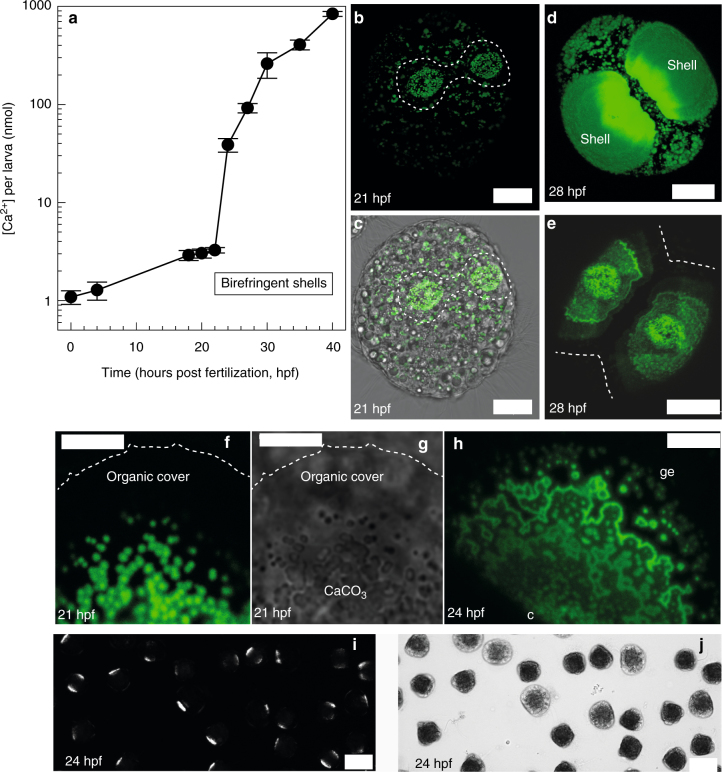
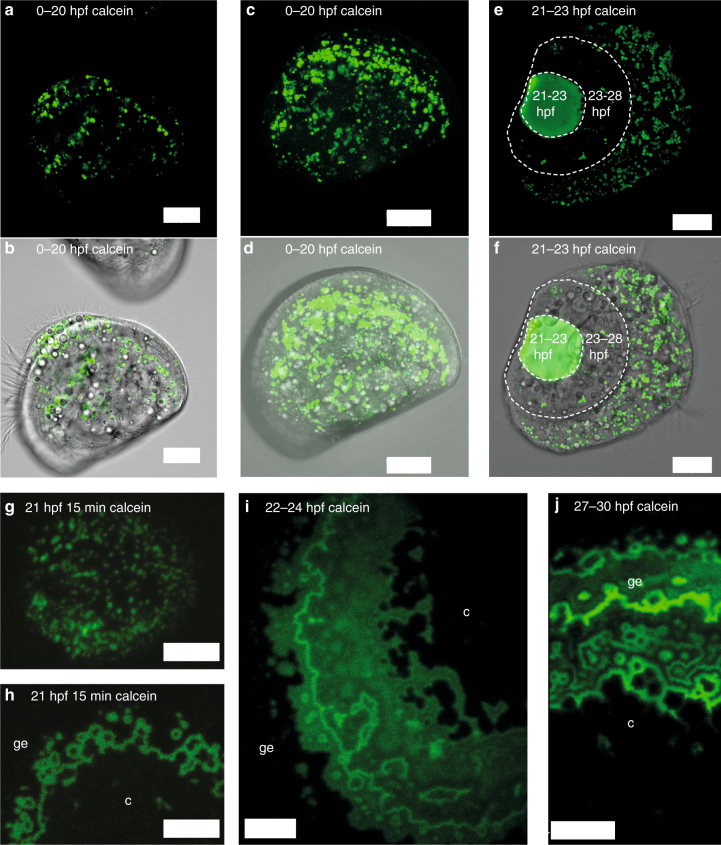
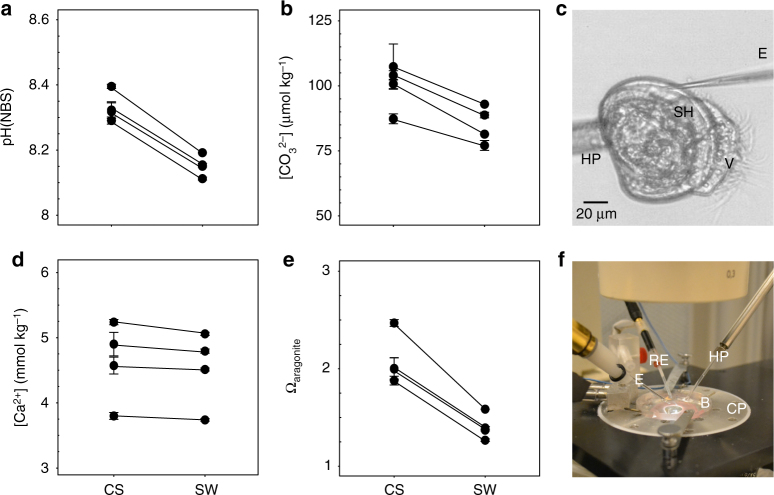
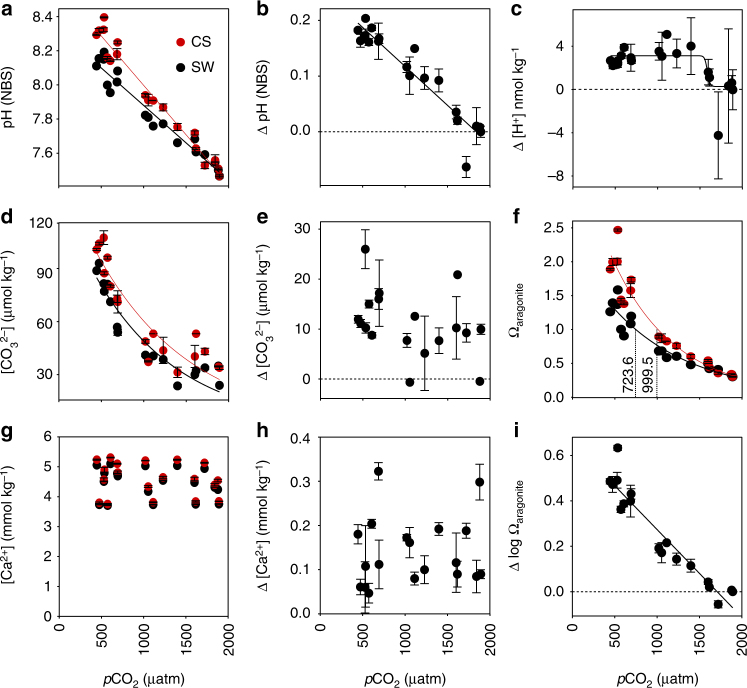
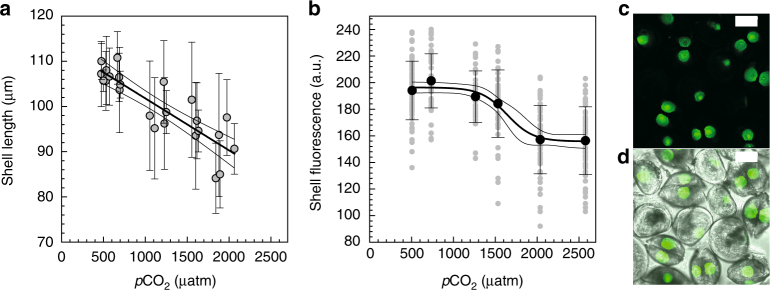
Understanding mollusk calcification sensitivity to ocean acidification (OA) requires a better knowledge of calcification mechanisms. Especially in rapidly calcifying larval stages, mechanisms of shell formation are largely unexplored-yet these are the most vulnerable life stages. Here we find rapid generation of crystalline shell material in mussel larvae. We find no evidence for intracellular CaCO3 formation, indicating that mineral formation could be constrained to the calcifying space beneath the shell. Using microelectrodes we show that larvae can increase pH and [CO32-] beneath the growing shell, leading to a ~1.5-fold elevation in calcium carbonate saturation state (Ωarag). Larvae exposed to OA exhibit a drop in pH, [CO32-] and Ωarag at the site of calcification, which correlates with decreased shell growth, and, eventually, shell dissolution. Our findings help explain why bivalve larvae can form shells under moderate acidification scenarios and provide a direct link between ocean carbonate chemistry and larval calcification rate.
Conflict of interest statement
The authors declare no competing financial interests.
Figures
Similar articles
-
Maintained larval growth in mussel larvae exposed to acidified under-saturated seawater.Sci Rep. 2016 Mar 29;6:23728. doi: 10.1038/srep23728. Sci Rep. 2016. PMID: 27020613 Free PMC article.
-
Deciphering carbon sources of mussel shell carbonate under experimental ocean acidification and warming.Mar Environ Res. 2018 Nov;142:141-146. doi: 10.1016/j.marenvres.2018.10.007. Epub 2018 Oct 13. Mar Environ Res. 2018. PMID: 30337051
-
Ocean acidification impacts mussel control on biomineralisation.Sci Rep. 2014 Aug 28;4:6218. doi: 10.1038/srep06218. Sci Rep. 2014. PMID: 25163895 Free PMC article.
-
Bioremediation of waste under ocean acidification: Reviewing the role of Mytilus edulis.Mar Pollut Bull. 2016 Feb 15;103(1-2):5-14. doi: 10.1016/j.marpolbul.2015.12.040. Epub 2016 Jan 8. Mar Pollut Bull. 2016. PMID: 26778338 Review.
-
Biomineralization: Some complex crystallite-oriented skeletal structures.J Biosci. 2013 Dec;38(5):925-35. doi: 10.1007/s12038-013-9390-z. J Biosci. 2013. PMID: 24296896 Review.
Cited by
-
Characterization of the main steps in first shell formation in Mytilus galloprovincialis: possible role of tyrosinase.Proc Biol Sci. 2019 Dec 4;286(1916):20192043. doi: 10.1098/rspb.2019.2043. Epub 2019 Nov 27. Proc Biol Sci. 2019. PMID: 31771478 Free PMC article.
-
Temperature but not ocean acidification affects energy metabolism and enzyme activities in the blue mussel, Mytilus edulis.Ecol Evol. 2021 Mar 5;11(7):3366-3379. doi: 10.1002/ece3.7289. eCollection 2021 Apr. Ecol Evol. 2021. PMID: 33841790 Free PMC article.
-
Impact of Polycyclic Aromatic Hydrocarbon Accumulation on Oyster Health.Front Physiol. 2021 Sep 10;12:734463. doi: 10.3389/fphys.2021.734463. eCollection 2021. Front Physiol. 2021. PMID: 34566698 Free PMC article. Review.
-
Chromosome-level genome assembly of the hard-shelled mussel Mytilus coruscus, a widely distributed species from the temperate areas of East Asia.Gigascience. 2021 Apr 23;10(4):giab024. doi: 10.1093/gigascience/giab024. Gigascience. 2021. PMID: 33891010 Free PMC article.
-
Genetic Diversity, Population Structure, and Environmental Adaptation Signatures of Chinese Coastal Hard-Shell Mussel Mytilus coruscus Revealed by Whole-Genome Sequencing.Int J Mol Sci. 2023 Sep 4;24(17):13641. doi: 10.3390/ijms241713641. Int J Mol Sci. 2023. PMID: 37686445 Free PMC article.
References
-
- Ekstrom JA, et al. Vulnerability and adaptation of US shellfisheries to ocean acidification. Nat. Clim. Change. 2015;5:207–214. doi: 10.1038/nclimate2508. - DOI
-
- Ries JB, Cohen AL, McCorkle DC. Marine calcifiers exhibit mixed responses to CO2-induced ocean acidification. Geology. 2009;37:1131–1134. doi: 10.1130/G30210A.1. - DOI
-
- Gazeau F, et al. Impacts of ocean acidification on marine shelled molluscs. Mar. Biol. 2013;160:2207–2245. doi: 10.1007/s00227-013-2219-3. - DOI
-
- Wittmann AC, Portner HO. Sensitivities of extant taxa to ocean acidification. Nat. Clim. Change. 2013;3:995–1001. doi: 10.1038/nclimate1982. - DOI
-
- Gazeau F, et al. Effect of ocean acidification on the early life stages of the blue mussel Mytilus edulis. Biogeosciences. 2010;7:2051–2060. doi: 10.5194/bg-7-2051-2010. - DOI
Publication types
MeSH terms
Substances
LinkOut - more resources
Full Text Sources
Other Literature Sources
