. 2017 Nov 22;7(1):16082.
doi: 10.1038/s41598-017-16463-6.

Increased inflammation, oxidative stress and mitochondrial respiration in brown adipose tissue from obese mice

Affiliations

Increased inflammation, oxidative stress and mitochondrial respiration in brown adipose tissue from obese mice

Martín Alcalá et al. Sci Rep. .

Abstract

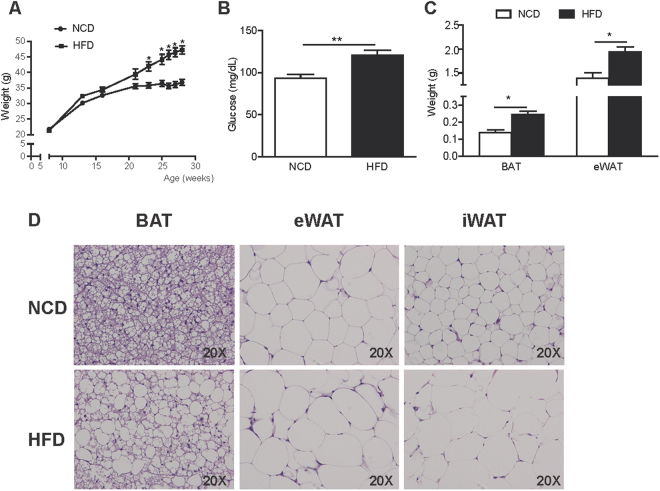
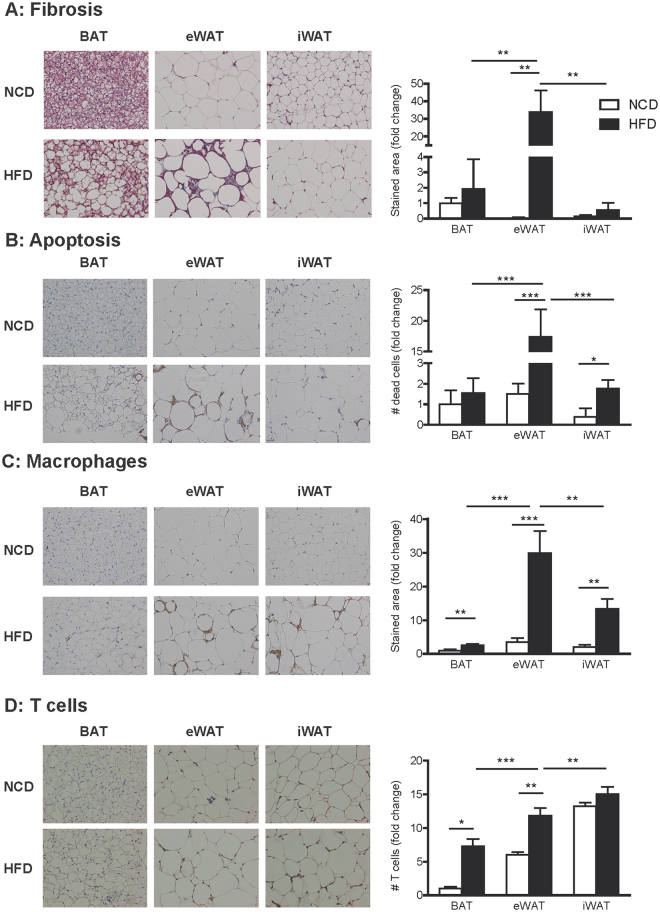
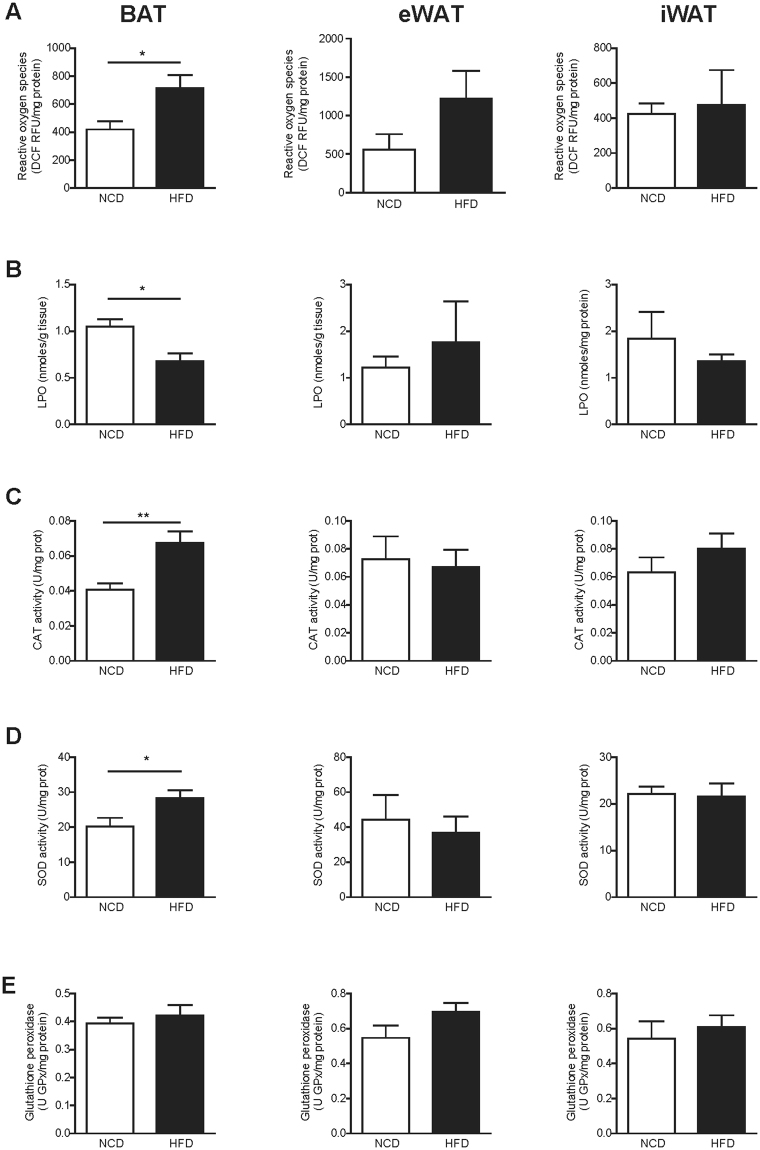
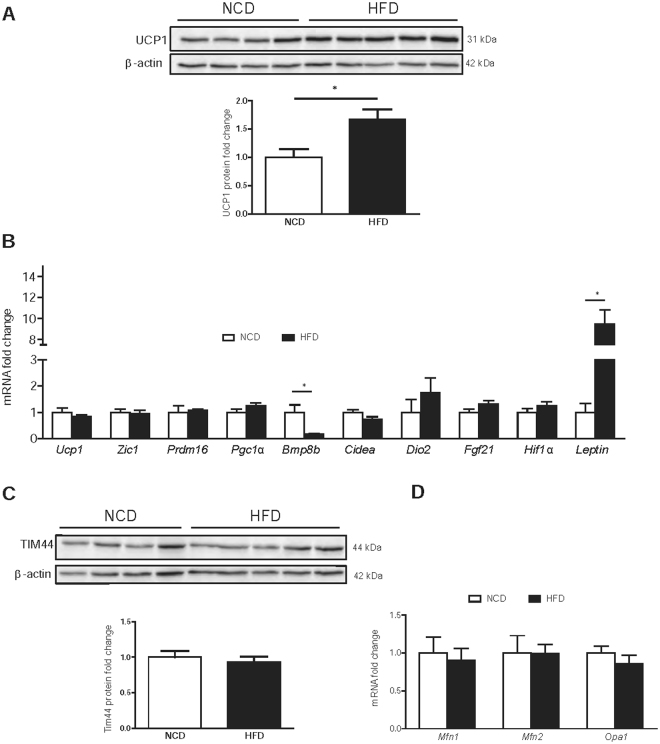
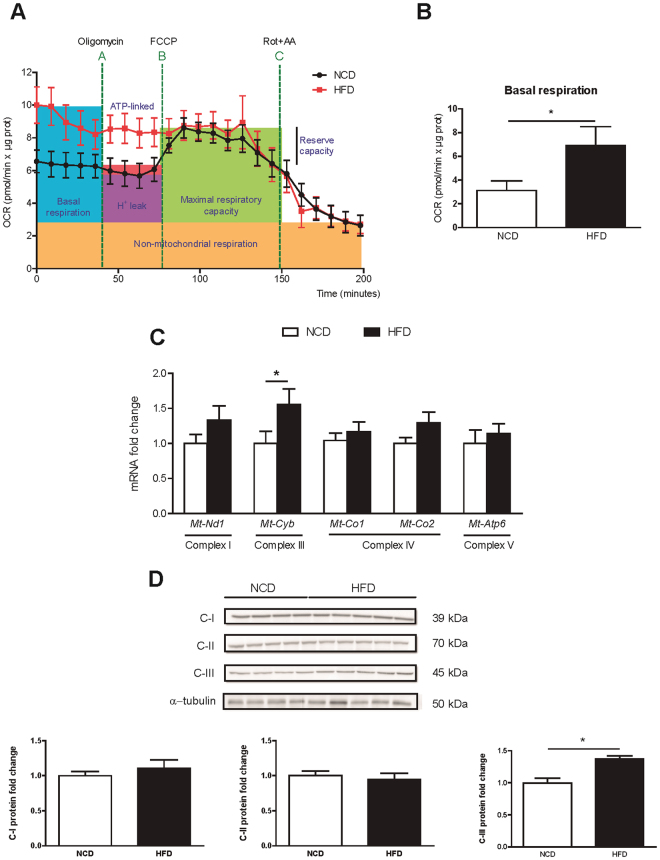
Obesity is associated with severe metabolic diseases such as type 2 diabetes, insulin resistance, cardiovascular disease and some forms of cancer. The pathophysiology of obesity-induced metabolic diseases has been strongly related to white adipose tissue (WAT) dysfunction through several mechanisms such as fibrosis, apoptosis, inflammation, ER and oxidative stress. However, little is known of whether these processes are also present in brown adipose tissue (BAT) during obesity, and the potential consequences on mitochondrial activity. Here we characterized the BAT of obese and hyperglycemic mice treated with a high-fat diet (HFD) for 20 weeks. The hypertrophic BAT from obese mice showed no signs of fibrosis nor apoptosis, but higher levels of inflammation, ER stress, ROS generation and antioxidant enzyme activity than the lean counterparts. The response was attenuated compared with obesity-induced WAT derangements, which suggests that BAT is more resistant to the obesity-induced insult. In fact, mitochondrial respiration in BAT from obese mice was enhanced, with a 2-fold increase in basal oxygen consumption, through the upregulation of complex III of the electron transport chain and UCP1. Altogether, our results show that obesity is accompanied by an increase in BAT mitochondrial activity, inflammation and oxidative damage.


Conflict of interest statement

The authors declare that they have no competing interests.

Figures

Figure 1
Figure 1
Phenotypic and histological characterization of HFD-treated mice. Changes in body weight (A), serum glucose levels (B) and adipose tissue weight (C) in NCD and HFD-fed mice for 20 weeks. (D) Representative histological images from interscapular BAT, eWAT and iWAT from NCD and HFD-fed mice stained with H&E. Results are represented as mean ± SEM. n = 8–10; *p < 0.05; **p < 0.01.
Figure 2
Figure 2
Increased immune cell infiltration in BAT from obese mice. Histological sections from interscapular BAT, eWAT and iWAT were analysed. (A) Representative images of Masson´s trichrome staining (left). Total collagen was quantified and expressed as the percentage of stained area in blue (right). (B) Representative images of immunohistochemical localization of Caspase-3 (left). The stained area was quantified and apoptosis is expressed as the number of dead cells (right). (C) Representative images of immunohistochemical localization of Mac-2 (left). The stained area was quantified and macrophage infiltration was expressed as a percentage of the stained area (right). (D) Representative images of immunohistochemical localization of CD3 (left). T cell infiltration was expressed through the quantification of CD3 positive cells (right). Arrows point to stained areas. Results are represented as mean ± SEM. n = 8–10; *p < 0.05; **p < 0.01.
Figure 3
Figure 3
Diet-induced obesity increases ER stress and inflammation in BAT, eWAT and iWAT. (A) Endoplasmic reticulum stress, determined as mRNA relative expression of Bip, Chop, Edem and Pdi by qPCR in interscapular BAT (left), eWAT (middle) and iWAT (right). (B) Pro-inflammatory cytokines, determined as mRNA relative expression of Tnfα, Il-1β, Mcp1 and Il-6 by qPCR in interscapular BAT (left), eWAT (middle) and iWAT (right). Protein levels of (C) IL-1β, (D) MCP-1 and (E) leptin in interscapular BAT (left), eWAT (middle) and iWAT (right). Results are represented as mean ± SEM. n = 8–10; *p < 0.05; **p < 0.01; ***p < 0.005.
Figure 4
Figure 4
BAT from obese mice showed increased ROS generation with a concomitant increase in antioxidant enzyme activity. Oxidative status in interscapular BAT (left), eWAT (middle) and iWAT (right) from NCD and HFD mice was assessed by determining ROS generation, oxidative damage to lipids, and antioxidant enzymes activity. (A) Total ROS were measured by determining the fluorescent probe DCFH-DA oxidation (DCF RFU: Dichlorofluorescein Relative Fluorescence Units). (B) Combined detection of malondialdehyde and 4-hydroxynonenal as major lipid peroxidation by-products, expressed together as lipoperoxides (LPO). (CE) Antioxidant activity of the enzymes catalase (CAT) (C), superoxide dismutase (SOD) (D) and glutathione peroxidase (E). Results are represented as mean ± SEM. n = 8–10; *p < 0.05; **p < 0.01.
Figure 5
Figure 5
HFD increases UCP1 protein levels without changes in BAT mitochondrial content. Whole interscapular BAT lysates were subjected to Western Blot analysis. (A) UCP1 protein levels using β-actin as a loading control. (B) Relative mRNA expression of BAT markers Ucp1, Zic1, Prdm16, PGc1α, Bmp8b, Cidea, Dio2, Fgf21, Hif1α and Leptin in NCD and HFD-fed mice. (C) TIM44 protein levels using β-actin as a loading control. Shown representative immunoblots out of at least 4 independent experiments. (D) Mitochondrial dynamics were determined by the relative mRNA expression of Mfn1, Mfn2 and Opa1 of BAT in NCD and HFD-fed mice. Results are represented as mean ± SEM. n = 8–10; *p < 0.05.
Figure 6
Figure 6
Enhanced mitochondrial respiration activity in BAT from obese mice. (A) Bioenergetic profile of interscapular BAT explants in NCD (black dots) and HFD-fed (red squares) mice. Nine milligrams of BAT/mice were analysed using the XF24 islet capture microplate. Basal oxygen consumption is recorded. After oligomycin was added in A, ATP-linked respiration and H+ leak were calculated. Maximal respiration and reserve capacity were measured after FCCP addition, and finally ETC inhibitors were added in C to determine non-respiratory oxygen consumption. Concentration of inhibitors and incubation times are described in the materials and methods section. Results are normalized by protein content. (B) Quantification of basal respiration in NCD and HFD mice. (C) Relative mRNA expression of the mitochondrial ETC complexes I, III, IV and ATP synthase. (D) Whole BAT lysates were subjected to Western blot. Complexes I, II and III protein levels were analysed by immunoblot, using α-tubulin as a loading control. Results are represented as mean ± SEM. n = 8–10; *p < 0.05.

References

    1. World Health Organization. Obesity and overweight. http//www.who.int/mediacentre/factsheets/fs311/en/ (accessed July 2017).
    1. Shoelson SE, Herrero L, Naaz A. Obesity, inflammation, and insulin resistance. Gastroenterology. 2007;132:2169–80. doi: 10.1053/j.gastro.2007.03.059. - DOI - PubMed
    1. Shulman GI. Ectopic fat in insulin resistance, dyslipidemia, and cardiometabolic disease. N. Engl. J. Med. 2014;371:1131–41. doi: 10.1056/NEJMra1011035. - DOI - PubMed
    1. Saltiel AR, Olefsky JM. Inflammatory mechanisms linking obesity and metabolic disease. J. Clin. Invest. 2017;127:1–4. doi: 10.1172/JCI92035. - DOI - PMC - PubMed
    1. Hotamisligil GS. Inflammation and endoplasmic reticulum stress in obesity and diabetes. Int. J. Obes. (Lond). 2008;32(Suppl 7):S52–4. doi: 10.1038/ijo.2008.238. - DOI - PMC - PubMed

Publication types