. 2001 Jan:4258:10.1117/12.430768.
doi: 10.1117/12.430768. Epub 2001 Jun 18.

Ultrahigh-resolution multicolor colocalization of single fluorescent nanocrystals

Affiliations

Ultrahigh-resolution multicolor colocalization of single fluorescent nanocrystals

Xavier Michalet et al. Proc SPIE Int Soc Opt Eng. 2001 Jan.

Abstract

A new method for in vitro and possibly in vivo ultrahigh-resolution colocalization and distance measurement between biomolecules is described, based on semiconductor nanocrystal probes. This ruler bridges the gap between FRET and far-field (or near-field scanning optical microscope) imaging and has a dynamic range from few nanometers to tens of micrometers. The ruler is based on a stage-scanning confocal microscope that allows the simultaneous excitation and localization of the excitation point-spread-function (PSF) of various colors nanocrystals while maintaining perfect registry between the channels. Fit of the observed diffraction and photophysics-limited images of the PSFs with a two-dimensional Gaussian allows one to determine their position with nanometer accuracy. This new high-resolution tool opens new windows in various molecular, cell biology and biotechnology applications.

Keywords: Superresolution; confocal; diffraction limit; fluorescence; microscopy; quantum dot; semiconductor nanocrystal; single molecule.


Figures
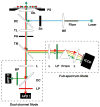
Figure 1
Figure 1
Setup used for ultrahigh-resolution colocalization of multicolor fluorescent probes. The microscope is a homemade stage-scanning confocal microscope using a nanometer-resolution closed-loop piezo-stage scanner (PS). A single laser line is brought via a fiber and a beam expander (BE) to the back focal plane of the objective (Ob) after reflection on a dichroic mirror (DC). Emission of the fluorescent probes is collected by the same objective, and either sent to a dual-channel recording arm using avalanche photodiodes (APD), or to a full-spectrum recording arm using a prism and an intensidifed CCD camera (ICCD). Sh: Shutter, TL: Tube lens, PH: Pinhole, TM: Tiltable Mirror, L: lens, LP: Longpass Filter, BP: Bandpass Filter.
Figure 2
Figure 2
Normalized bulk emission spectra of 4 different NC samples (large dots) obtained with a standard spectrofluorimeter, superimposed with individual nanocrystals spectra (thin curves) as obtained with our multicolor imaging setup using the integrated data of 11×11 pixels and an integration time of 100 ms per pixel (200 nW incident excitation power). FWHM of bulk spectra are of the order of 30 nm: 34, 37, 34 and 32 nm, respectively for the 540, 575, 588 and 620 nm emissions. Peak ± FWHM of individual spectra from left to right (in nm): 537 ± 16, 565 ± 24, 578 ± 15, 598 ± 18, 605 ± 20, 627 ± 24.
Figure 3
Figure 3
Multicolor imaging of a mixture of 4 NC batches (bulk spectra as indicated in Fig. 2). The area corresponds to a 3 × 3 μm2 scan (bar indicates 1 μm) using 128 steps. Incident laser power: 200 nW, integration time: 100 ms per pixel. 4 spectral bands were selected as discussed in the text and false-colored (green: 540 ± 6, red: 571 ± 7, blue: 594 ± 8, orange: 643 ± 9). Some overlapping NCs are clearly visible in this contrast-enhanced image (case a, spectrum: 586 ± 6 nm), as well as cases of nanocrystals appearing simultaneously in the blue and red false-color channels (violet, case b, spectra: 546 ± 10 and 602 ± 10 nm).
Figure 4
Figure 4
Spectra of two different 11×11 pixels area of Fig. 3. Recorded spectra are displayed as scatter plots, with the best Lorentzian fits indicated by continuous curves. Boundaries of spectral bands used to build the false-color image planes of Fig. 3 are indicated by dashed vertical lines. Case a correspond to two nearby NCs whose PSFs overlap over most of their physical extension, but with clearly separated spectra (and different emission intensity). Case b corresponds to a single NC whose spectrum overlaps the two chosen bands used to build the red and blue image plane.
Figure 5
Figure 5
Repeated dual-color imaging of the same 2×2 μm2 area of a mixture of green and red NCs, excited at 488 nm (incident excitation power: 200 nW, integration time: 50 ms, pixel size: 50 nm). The overall scan duration is about 80 s and the next scan is started almost immediately. Bar indicates 500 nm. The measured distance in each case is indicated with its corresponding 95 % confidence limit error bar as obtained with 1000 bootstrap simulations. Scan d gives a single stripe of signal for the red nanocrystal, so that no position can be determined for this NC. In subsequent scans, this NC gives more complete PSF images.

References

    1. McNally JG, Karpova T, Cooper J, Conchello JA. Three-Dimensional Imaging by Deconvolution Microscopy. Methods. 1999;19:373–385. - PubMed
    1. Cragg EG, So PT. Lateral resolution enhancement with standing evanescent waves. Optics Letters. 2000;25:46–48. - PMC - PubMed
    1. Edelman P, Cremer C. Improvement of confocal Spectral Precision Distance Microscopy (SPDM) SPIE Proceedings. 2000;3921 Optical Diagnostics of Living Cells III.
    1. Frohn JT, Knapp HF, Stemmer A. True optical resolution beyond the Rayleigh limit achieved by standing wave illumination. Proceedings of the National Academy of Sciences USA. 2000;97:7232–7236. - PMC - PubMed
    1. Gustafsson MGL, Agard DA, Sedat JW. I5M: 3D widefield light microscopy with better than 100 nm axial resolution. Journal of Microscopy. 1999;195:10–16. - PubMed

LinkOut - more resources