. 2017 Nov 8:8:1479.
doi: 10.3389/fimmu.2017.01479. eCollection 2017.

Iron Induces Anti-tumor Activity in Tumor-Associated Macrophages

Affiliations

Iron Induces Anti-tumor Activity in Tumor-Associated Macrophages

Milene Costa da Silva et al. Front Immunol. .

Abstract

Tumor-associated macrophages (TAMs) frequently help to sustain tumor growth and mediate immune suppression in the tumor microenvironment (TME). Here, we identified a subset of iron-loaded, pro-inflammatory TAMs localized in hemorrhagic areas of the TME. The occurrence of iron-loaded TAMs (iTAMs) correlated with reduced tumor size in patients with non-small cell lung cancer. Ex vivo experiments established that TAMs exposed to hemolytic red blood cells (RBCs) were converted into pro-inflammatory macrophages capable of directly killing tumor cells. This anti-tumor effect could also be elicited via iron oxide nanoparticles. When tested in vivo, tumors injected with such iron oxide nanoparticles led to significantly smaller tumor sizes compared to controls. These results identify hemolytic RBCs and iron as novel players in the TME that repolarize TAMs to exert direct anti-tumor effector function. Thus, the delivery of iron to TAMs emerges as a simple adjuvant therapeutic strategy to promote anti-cancer immune responses.

Keywords: anti-tumor activity; heme; hemolytic red blood cells; iron; iron nanoparticles; macrophage polarization; non-small cell lung cancer; tumor-associated macrophages.


Figures

Figure 1
Figure 1
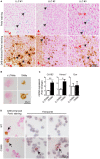
Tumor-associated macrophages associated with invasive margin accumulate iron and correlate with smaller tumor size. (A) Representative examples of three different patients with non-small cell lung cancer (NSCLC). Arrows indicate iron-positive cells (blue staining). Red blood cells (RBCs) are identified by morphology. (B,C) Representative examples of Perls’ staining and anti-CD68 immunostaining in lung adenocarcinoma (B) and tumor-associated leukocytes after magnetic isolation (C), blue staining indicates iron and red staining represents CD68 positive cells (representative of four patients). (D) Representative Perls’ staining in normal lung, tumor center and invasive front in lung squamous cell carcinoma (upper panel) and lung adenocarcinoma (lower panel). (E) Quantification of Perls’ staining in normal lung, center and invasion front of NSCLC. Results are shown as area of pixels corresponding to blue staining (n = 38). (F) Comparison of tumor size in a cohort of NSCLC patients divided by iron content: iron positive (n = 29) and iron negative (n = 65). Data are shown as mean ± SEM. *p < 0.05, **p < 0.01, ***p < 0.001, and ****p < 0.0001.
Figure 2
Figure 2
Iron-loaded tumor-associated macrophages (TAMs) from Lewis lung carcinoma (LLC) tumors localize near sites of red blood cells (RBCs) extravasation. (A) Consecutive slides with Perls’ staining of three different LLC tumors (upper panel) and DAB enhanced Perls’ staining (lower panel). Black arrows indicate iron-loaded TAMs and red arrows indicate RBCs. (B) DAB enhanced Perls’ staining of sorted iron-spared (i(-)TAMs) and iron-loaded (iTAMs) TAMs after magnetic isolation. (C) mRNA expression of Cd163, Hmox1, and Fpn in iron-spared (i(-)TAMs) and iron-loaded (iTAMs) TAMs determined by quantitative RT-PCR (three independent experiments, each experiment with TAMs pooled from eight mice). (D) DAB enhanced Perls’ staining and anti-ferroportin staining in TAMs sorted from LLC tumors of WT and Slc40a1C326S mice (C326S). Images are representative of 4 mice and arrows indicate TAMs positive for iron and ferroportin staining respectively. All mRNA levels were normalized to Rpl19 mRNA expression and all tissues were collected 15 days after LLC inoculation. Data are shown as mean ± SEM. *p < 0.05, **p < 0.01, ***p < 0.001, and ****p < 0.0001.
Figure 3
Figure 3
Hemorrhagic areas from Lewis lung carcinoma (LLC) tumors show increased inflammation. (A) Magnetic resonance imaging of LLC tumors, 7 and 15 days after LLC inoculation with T2-w sequence and T2*-w gradient echo sequence (representative of n = 8). (B) Quantification of micro-bleeds by T2*-w gradient echo sequence (n = 5). (C) Dynamic contrast-enhanced imaging in muscle (n = 7) and in tumor tissue (n = 3) at day 7 after LLC inoculation. (D) Co-existence of non-hemorrhagic (NH) area and hemorrhagic (H) area in a LLC tumor. (E) Heme and hemoglobin quantification in NH and H areas (n = 6). (F) Hmox1 and Cd163 mRNA expression determined by quantitative RT-PCR in total lysates of NH and H areas (n = 6). (G) Representative plots and quantification of Gr-1+ cells in NH and H areas (n = 6). (H,I) mRNA expression of Cxcl1 and Cxcl2, (H) and Csf1 and Csf2 (I) determined by quantitative RT-PCR of total lysates of NH and H areas (n = 6). (J) Representative flow cytometry plots of F4/80+ CD206+ TAMs and quantification in NH and H areas (n = 5). (K) mRNA expression of Nos2 and Il6 determined by quantitative RT-PCR of total lysates of NH and H areas (n = 6). All mRNA levels were normalized to Rpl19 mRNA expression and expressed as fold change relative to NH. All tumors were collected 15 days after LLC inoculation. Data are shown as mean ± SEM. *p < 0.05, **p < 0.01, ***p < 0.001, and ****p < 0.0001.
Figure 4
Figure 4
Hemolytic red blood cells (RBCs) shift tumor-associated macrophages (TAMs) polarization toward an M1-like phenotype. (A) Representative flow cytometry plots of BMDM differentiated with conditioned media (CM) from Lewis lung carcinoma (LLC) cells (in vitro TAMs) and mRNA expression of Arginase 1, Ccl2, and Vegf compared to control BMDM. (B) DAB enhanced Perls’ staining (indicated by arrows) of in vitro TAMs, non-treated (NT), treated with aged RBCs (aRBC) or RBCs (RBC) (representative of n = 3). (C) Heme and hemoglobin quantification in the supernatant of in vitro TAMs, NT, treated with aged RBCs (aRBC) or RBCs (RBC). (D,E) mRNA expression of Hmox1 and Spi-c (D) and Csf1, Cxcl1, and Cxcl2 (E) in in vitro TAMs, NT, treated with aged RBCs (aRBC) or RBCs (RBC), determined by quantitative RT-PCR. (F) Quantification of CD86 and CD206 expression by flow cytometry in in vitro TAMs NT, treated with aged RBCs (aRBC) or RBCs (RBC), results are shown as geometric mean fold change to NT samples (n = 9). (G) mRNA expression of M1 markers: Il6, Nos2 and Tnfa and M2 markers: Arginase 1, Ym1, and Il10 in in vitro TAMs NT, treated with aged RBCs (aRBC) or RBCs (RBC). All cultures were analyzed 24 h after the respective treatment. All mRNA levels were determined by quantitative RT-PCR and normalized to Rpl19 mRNA expression [shown as fold change to NT samples (n = 9)]. Data are shown as mean ± SEM. *p < 0.05, **p < 0.01, ***p < 0.001, and ****p < 0.0001.
Figure 5
Figure 5
Macrophages exposed to hemolytic red blood cells (RBCs) promote tumor cell death. (A) Viability of Lewis lung carcinoma (LLC) cells co-cultured with in vitro tumor-associated macrophages (TAMs) and aged RBCs (aRBC) measured by flow cytometry. Results are shown as% of 7AAD negative cells (representative plots of LLC stained with 7AAD). (B) Representative plots and reactive oxygen species (ROS) quantification by flow cytometry in in vitro TAMs co-cultured with LLC cells and non-treated (NT) or treated with aged RBCs (aRBC). Results are shown as fold change to NT samples (n = 6). (C) Quantification of CD206 and CD86 expression by flow cytometry in in vitro TAMs co-cultured with LLC cells and aged RBCs (aRBC). Results are shown as geometric mean fold change to in vitro TAMs+LLC (white bar) (n = 9). All cultures were analyzed 24 h after the respective treatment. (D) Consecutive slides of LLC, showing four different areas overlapping (A–D) of tumors (upper panel) with TUNEL staining for apoptosis (purple staining) and (lower panel) DAB enhanced Perls’ staining (brown staining represents iTAMs and RBCs). Data are shown as mean ± SEM. *p < 0.05, **p < 0.01, ***p < 0.001, and ****p < 0.0001.
Figure 6
Figure 6
Iron nanoparticles accumulate in tumor-associated macrophages (TAMs) and delay tumor growth. (A) Representative plots of in vitro TAMs analyzed for the uptake of cross-linked iron oxide (CLIO)-FITC nanoparticles and expression of CD206. (B) Percentage of CD206 positive cells in in vitro TAMs (F4/80+), non-treated (NT) or incubated with CLIO-FITC nanoparticles. (C) Viability of Lewis lung carcinoma (LLC) cells measured by flow cytometry, in the presence of in vitro TAMs, CLIO-FITC at 48 h. Results are shown as% of 7AAD negative cells. (D) Expression of CD206 measured by flow cytometry in in vitro TAMs in the presence of LLC cells and incubated with CLIO-FITC, as geometric mean fold change (Geo Mean) to control (TAMs+LLC) at 48 h. (E) Tumor volume of sc LLC tumors NT or co-injected with CLIO-FITC nanoparticles and tumor weight at 15 days after LLC inoculation. (F) CLIO-FITC uptake in TAMs (F4/80), CD3+ and LLC cells measured by flow cytometry. Results are shown as geometric mean fold change (Geo Mean) compared to cells from NT tumors. (G) Representative Perls’ staining of LLC tumors NT or co-injected with CLIO-FITC nanoparticles (CLIO). RBCs are indicated in the NT sample. Blue staining represents iron-loaded TAMs. (H) Quantification of CD86 and CD206 expression by flow cytometry in F4/80+ cells in tumors NT or co-injected with CLIO-FITC nanoparticles (CLIO) results are shown as geometric mean fold change to NT samples (n = 9). (I) Ratio of the% of CD8/CD4 cells within CD45+ cells in tumors non-treated (NT) or co-injected with CLIO-FITC nanoparticles (CLIO). All tumors were collected 15 days after LLC inoculation. Data are shown as mean ± SEM. *p < 0.05, **p < 0.01, ***p < 0.001, and ****p < 0.0001.
Figure 7
Figure 7
Heme and iron shift the polarization of tumor-associated macrophages (TAMs) toward a pro-inflammatory phenotype. (A) Lewis lung carcinoma (LLC) tumor cells promote M2 polarization of TAMs by inducing the expression of CD206, Arginase 1, Ccl2, and Vegf. (B) M2 macrophages exposed to the degradation products of hemolytic RBCs (heme, hemoglobin, and iron) or iron nanoparticles are reprogrammed to iron-loaded TAMs (iTAMs), with an M1-like inflammatory phenotype (increased production of Tnfa, Il6 and reactive oxygen species (ROS) and increased expression of Nos2 (iNOS), CD86, Cd163, Spi-c, and Hmox1). (C) iTAMs show tumoricidal activity by decreasing the viability of LLC cells.

Similar articles

Cited by

References

    1. Hanahan D, Weinberg RA. Hallmarks of cancer: the next generation. Cell (2011) 144:646–74.10.1016/j.cell.2011.02.013 - DOI - PubMed
    1. Solinas G, Germano G, Mantovani A, Allavena P. Tumor-associated macrophages (TAM) as major players of the cancer-related inflammation. J Leukoc Biol (2009) 86:1065–73.10.1189/jlb.0609385 - DOI - PubMed
    1. Mantovani A, Bottazzi B, Colotta F, Sozzani S, Ruco L. The origin and function of tumor-associated macrophages. Immunol Today (1992) 13:265–70.10.1016/0167-5699(92)90008-U - DOI - PubMed
    1. Balkwill F, Mantovani A. Inflammation and cancer: back to Virchow? Lancet (2001) 357:539–45.10.1016/S0140-6736(00)04046-0 - DOI - PubMed
    1. Jung KY, Cho SW, Kim YA, Kim D, Oh BC, Park DJ, et al. Cancers with higher density of tumor-associated macrophages were associated with poor survival rates. J Pathol Transl Med (2015) 49:318–24.10.4132/jptm.2015.06.01 - DOI - PMC - PubMed