. 2017 Nov 20:3:16.
doi: 10.1038/s41514-017-0018-7. eCollection 2017.

Health benefits of late-onset metformin treatment every other week in mice

Affiliations

Health benefits of late-onset metformin treatment every other week in mice

Irene Alfaras et al. NPJ Aging Mech Dis. .

Abstract

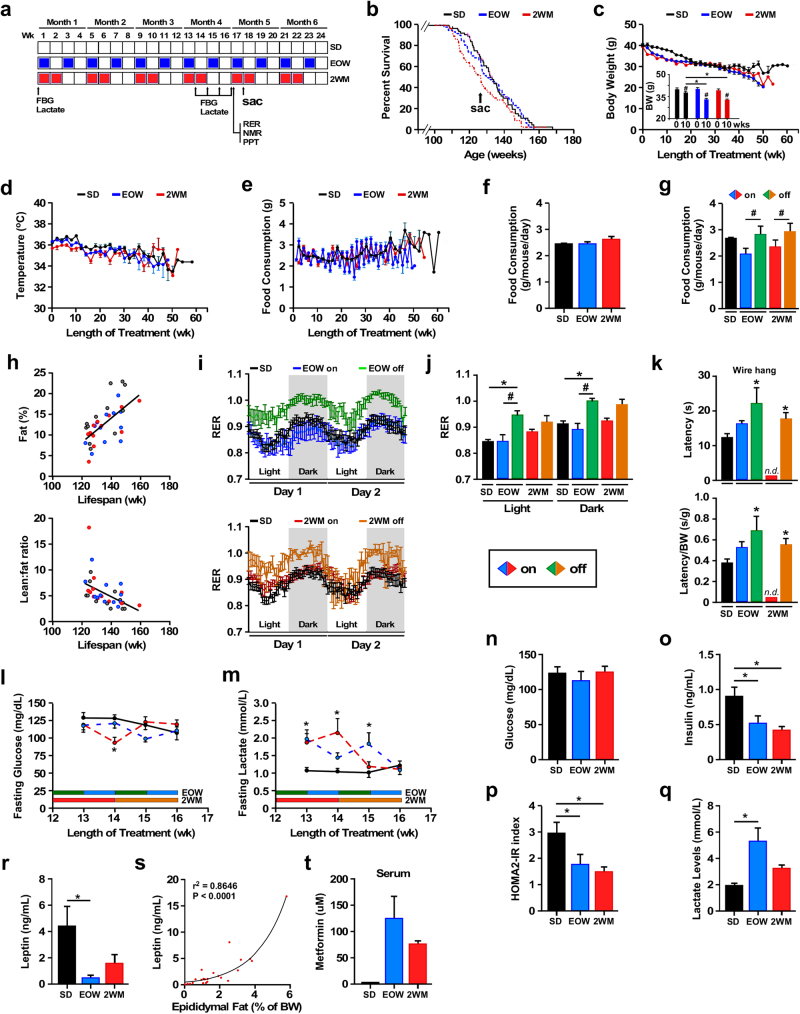
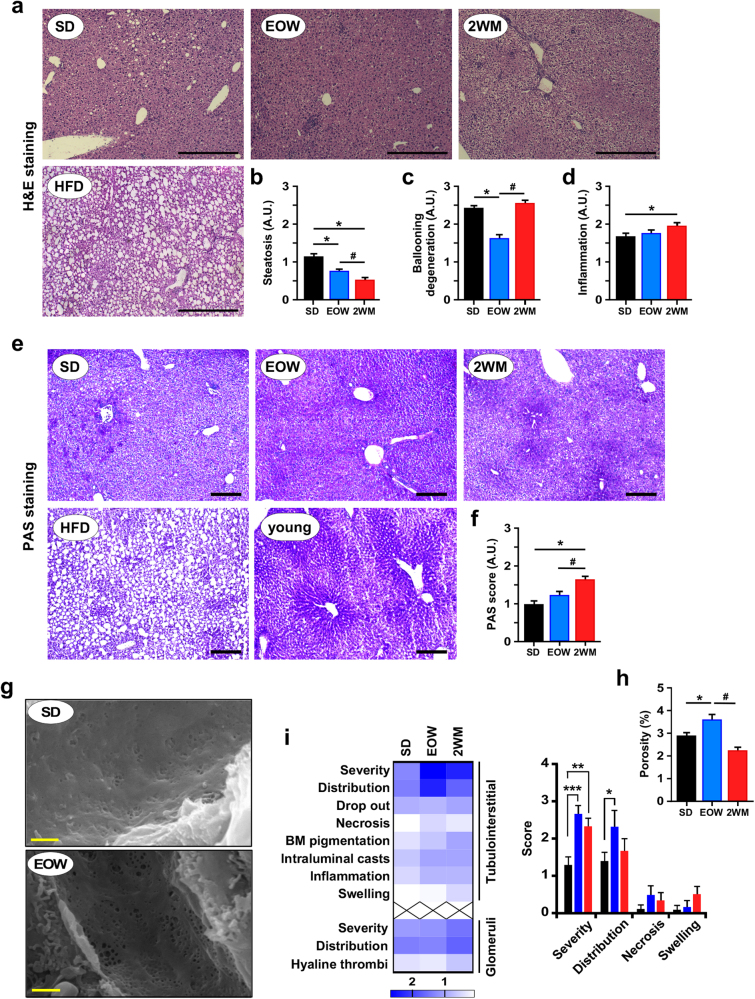
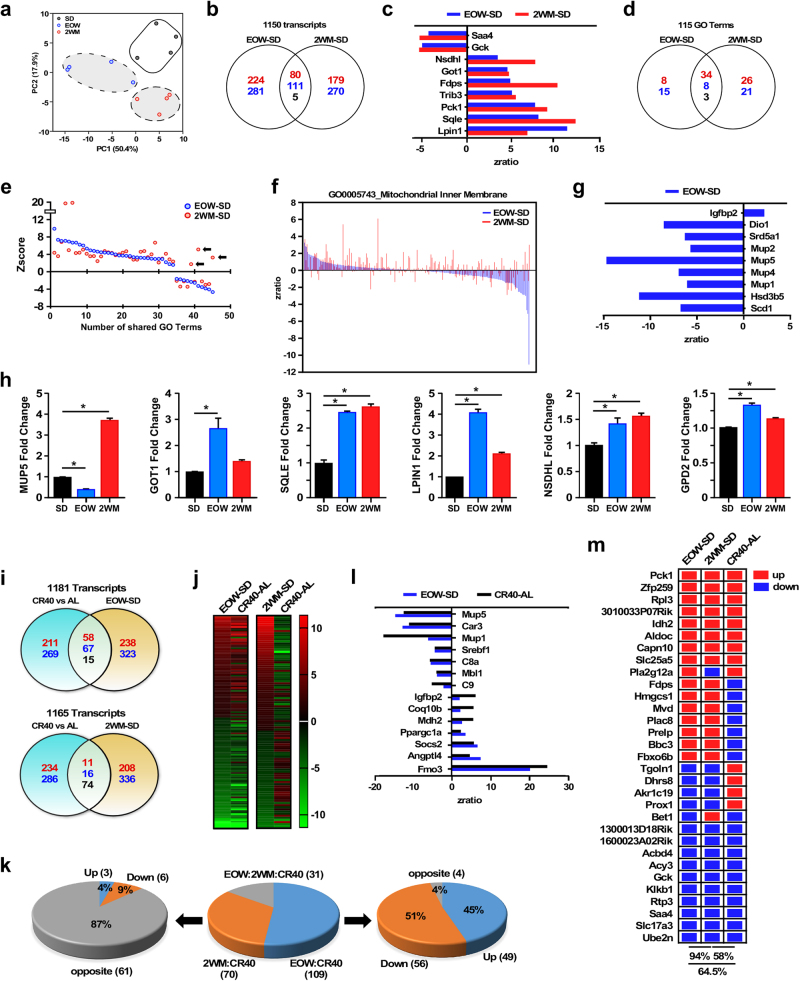
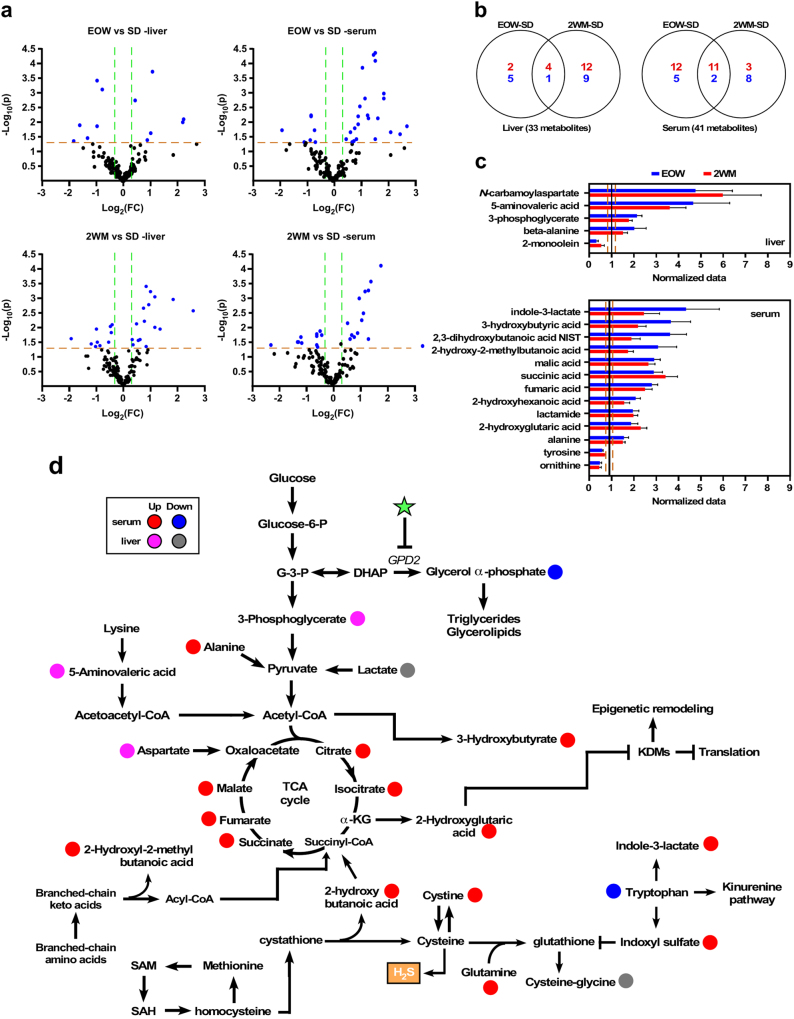
Chronic 1% metformin treatment is nephrotoxic in mice, but this dose may nonetheless confer health benefits if given intermittently rather than continuously. Here, we examined the effects of 1% metformin given every-other week (EOW) or two consecutive weeks per month (2WM) on survival of 2-year-old male mice fed standard chow. EOW and 2WM mice had comparable life span compared with control mice. A significant reduction in body weight within the first few weeks of metformin treatment was observed without impact on food consumption and energy expenditure. Moreover, there were differences in the action of metformin on metabolic markers between the EOW and 2WM groups, with EOW metformin conferring greater benefits. Age-associated kidney lesions became more pronounced with metformin, although without pathological consequences. In the liver, metformin treatment led to an overall reduction in steatosis and was accompanied by distinct transcriptomic and metabolomic signatures in response to EOW versus 2WM regimens. Thus, the absence of adverse outcomes associated with chronic, intermittent use of 1% metformin in old mice has clinical translatability into the biology of aging in humans.


Conflict of interest statement

The authors declare thst they have no competing financial interests.

Figures

Fig. 1
Fig. 1
Characteristics of mice on intermittent metformin treatment. a Protocol design. Male mice (108 week-old) were fed a standard diet (SD) without (n = 68) or with 1% metformin in the diet every-other week (EOW, n = 64) or for two consecutive weeks each month (2WM, n = 67) for 24 weeks. At the indicated time points (weeks), body composition (NMR), metabolic assessment (RER), and physical performance tests (PPT) were performed on non-fasted animals, whereas blood glucose and lactate levels were measured in 6-h fasted mice. Sac, sacrifice of a subset of animals for tissue collection and analysis (SD, n = 10; EOW, n = 6; 2WM, n = 6). b Kaplan–Meier survival curve for the three experimental groups of mice (SD, EOW, 2WM). No extension of maximal lifespan was observed. c Body weight profile over the lifespan. Data include all live animals at each time point. Inset, Body weight at the initiation (0) and after 10 weeks of treatment (10) (SD, n = 68(0) and 64(10); EOW, n = 64(0) and 58(10); 2WM, n = 67(0) and 57(10)). #p < 0.05 compared to t = 0; *p < 0.05 compared to SD at t = 10 weeks. d Body temperature. e Food consumption. f Average daily food consumption per mouse. g The data shown in panel f was segregated by whether mice were on metformin treatment or returned to SD without metformin. h Correlations between % body fat (upper panel) or lean-to-fat ratio (lower panel) and time of death (n = 12 in each group) (upper, F = 22.27; dFn, dFd (1, 35); P < 0.0001); lower, (F = 11.1; dFn, dFd (1, 35); P < 0.002). ij Mice were subjected to metabolic assessment after 17 weeks of treatment (SD, n = 11; EOW on metformin, n = 6; EOW off metformin, n = 6; 2WM on metformin, n = 9; 2WM off metformin, n = 3): i Respiratory exchange ratio (RER) values over the course of 48 h; j RER values shown in panel i were segregated based on the light and dark periods of the L12:D12 cycle; k Latency to fall from wire hang was measured after 16 weeks of treatment (SD, n = 47; EOW on metformin, n = 12; EOW off metformin, n = 7; 2WM on metformin, n = 0; 2WM off metformin, n = 22) before (upper panel) and after (lower panel) correction for body weight. l, m At 13–16 weeks of treatment, mice were fasted for 6 h (SD, n = 8–10; EOW, n = 9–10; 2WM, n = 9–10) and circulating levels of l glucose and m lactate were measured. n–r The following analyses were carried out at 17 weeks of treatment in fed mice (SD, n = 10; EOW, n = 6; 2WM, n = 6): n blood glucose; o serum insulin levels; p HOMA-IR index; q blood lactate; r Serum levels of leptin. s Correlation between circulating levels of leptin and amount of epididymal fat as percent body weight. t Serum levels of metformin after 17 weeks of treatment (SD, n = 3; EOW, n = 6; 2WM, n = 6). Data are represented as the mean ± s.e.m. *P < 0.05 compared to SD-fed mice, #P < 0.05 compared to mice on metformin (Kruskal–Wallis with Dunn’s post hoc test)
Fig. 2
Fig. 2
Intermittent metformin treatment reduces liver injury and improves the porosity of the mouse liver sieve. a H&E staining depicted steatosis as circular white gaps caused when the dehydration process leaches the fat out of fixed liver tissues. HFD, representative image of fixed liver section of a high-fat diet-fed mouse showing intense steatosis. c-d The following quantitative measurements were carried out: b The degree of steatosis; c Extent of ballooning degeneration of hepatocytes; d Degree of inflammation. e Periodic acid–Schiff staining (PAS) for the detection of polysaccharides (e.g., glycogen) in fixed liver tissues. Young crtl, representative image of fixed liver section of a young mouse with strong glycogen deposition. f Semi-quantification of PAS staining. a Scale bar, 200 μm; 5× final magnification; e Scale bar, 200 μm; 10× final magnification. g Representative scanning electron microscopy images of liver sections of the SD and EOW groups of mice. Scale bar, 1 μm; 15,000× final magnification. h The degree of porosity seen as the fenestration area expressed as percent of total area was quantitatively determined. All data are represented as the mean ± s.e.m. *P < 0.05 compared to SD-fed mice (ANOVA with Tukey’s multiple comparisons test and Kruskal–Wallis with Dunn’s post hoc test for PAS). #P < 0.05 compared to EOW-treated mice (ANOVA with Tukey’s multiple comparisons test). i Heatmap of the average score of various types of tubular and glomerular lesions in each experimental group of mice (SD, n = 10; EOW, n = 6; 2WM, n = 6). Bars represent the mean ± s.e.m. of selected tubulointersitial lesions. See “Methods” for additional information. *P < 0.05, **P < 0.01, ***P < 0.001. SD standard diet
Fig. 3
Fig. 3
Intermittent metformin treatment alters the global hepatic gene expression profile of SD-fed mice. a Principal component analysis (PCA) from microarray RNA experiments in livers of 108-week-old mice maintained for 17 weeks on 1% metformin either EOW or 2WM compared with SD controls (SD, n = 4; EOW, n = 4; 2WM, n = 4). b Venn diagram of upregulated (red), downregulated (blue), and reciprocally regulated (black) gene transcripts between the EOW–SD and 2WM–SD pairwise comparisons. c Graphical representation of select genes significantly impacted by EOW and 2WM. As indicated in Methods, the measure in gene expression uses Z-score transformation of the normalized data, accompanied by z-ratios for predicting significant changes., d Venn diagram of upregulated (red), downregulated (blue), and reciprocally regulated (black) GO Terms between the EOW–SD and 2WM–SD pairwise comparisons. e Graphical representation of the significant 45 GO Terms shared by EOW (plotted in blue) and 2WM (plotted in red). Zscores depict the number of standard deviations, either above or below the mean of all pathways, the aggregated Z-score of a given GO Term (or pathway) has within a pairwise comparison (see Methods for additional details). The list of all the significantly modified GO Terms can be found in Supplementary Table S4c. Arrows depict 3 GO Terms with changes (Z-score) shifted in the opposite direction between the two pairwise comparisons. f Expression of genes within the GO Term “Mitochondrial inner membrane” is depicted as Z ratios. g Expression of genes significantly altered only in the EOW–SD comparison. h Validation of the microarray data by quantitative RT-PCR. Data are represented as the mean ± s.e.m. *P < 0.05 compared to SD-fed mice (t-test two tailed). SD, standard diet. i–m Exploratory data analysis aimed at visualizing the main characteristics of the current set of gene expression with that of our recent study on the chronic effect of 40% calorie restriction versus ad libitum feeding (CR40-AL) in male C57BL/6J mice. i Venn diagram of upregulated (red), downregulated (blue), and reciprocally regulated (black) gene transcripts in the livers of CR40-AL versus either EOW–SD (upper panel) or 2WM–SD (lower panel) pairwise comparisons. j Heat map comparing the expression of liver transcripts common between EOW–SD and CR40-AL or 2WM–SD and CR40-AL. k Distribution of the 210 transcripts shared between EOW–SD and CR40-AL (109), 2WM–SD and CR40-AL (70), or all three comparisons (31) (middle panel). More than 87% of transcripts shared between 2WM–SD and CR40-AL (61/70) were in the opposite direction (left panel), whereas the large majority (96%) of transcripts shared between EOW–SD and CR40-AL followed the same direction (right panel). l Change in expression of select genes common between EOW–SD and 40CR-AL is depicted as z-ratios. m Binary representation of gene expression related to the 31 transcripts (k, middle panel) shared between the three pairwise comparisons. Upregulated, red boxes; downregulated, blue boxes. The complete list of genes is provided in the Supplementary Table S5c
Fig. 4
Fig. 4
Identification of hepatic and serum metabolites in SD-fed mice subjected to intermittent metformin treatment. a Volcano plots of 136 metabolites quantified in the liver and serum of 108-week-old mice maintained for 17 weeks on EOW or 2WM (Liver: SD, n = 10; EOW, n = 5; 2WM, n = 6; serum: SD, n = 10; EOW, n = 6; 2WM, n = 6). Significantly altered metabolites are labeled in blue (fold change ≥ 1.25 in both directions, P ≤ 0.05). b Venn diagrams of upregulated (red) and downregulated (blue) metabolites in the livers (left panel) and serum (right panel) of mice following EOW–SD and 2WM–SD pairwise comparisons. c Graphical representation of the significant metabolites shared by EOW (plotted in blue) and 2WM (plotted in red) normalized to SD controls in the liver (upper) and serum (bottom). See Supplementary Tables S6a and S6b for complete list of significantly altered metabolites. Data are represented as the mean ± s.e.m. d Schematic diagram of select metabolic pathways induced by EOW treatment based on the liver and serum metabolite profiles. Metabolism of organic sulfur compounds is also depicted. Red and pink colors represent increased metabolites and blue and gray colors represent decreased metabolites in serum and liver, respectively. H2S, production of hydrogen sulfide measured in Supplementary Fig. S1g. Data are represented as the mean ± s.e.m; n = 6 biological replicates per group, 23–24 months of age, 17–18 months on diet

References

    1. US Food and Drug Administration. Metformin Informationhttps://www.fda.gov/Drugs/DrugSafety/PostmarketDrugSafetyInformationforP... (2017).
    1. Martin-Montalvo A, et al. Metformin improves healthspan and lifespan in mice. Nat. Commun. 2013;4:2192. doi: 10.1038/ncomms3192. - DOI - PMC - PubMed
    1. Anisimov VN, et al. If started early in life, metformin treatment increases life span and postpones tumors in female SHR mice. Aging (Albany NY) 2011;3:148–157. doi: 10.18632/aging.100273. - DOI - PMC - PubMed
    1. Strong R, et al. Longer lifespan in male mice treated with a weakly estrogenic agonist, an antioxidant, an α-glucosidase inhibitor or a Nrf2-inducer. Aging Cell. 2016;15:872–884. doi: 10.1111/acel.12496. - DOI - PMC - PubMed
    1. De Haes W, et al. Metformin promotes lifespan through mitohormesis via the peroxiredoxin PRDX-2. Proc. Natl. Acad. Sci. USA. 2014;111:2501–2509. doi: 10.1073/pnas.1321776111. - DOI - PMC - PubMed