

Ion-protein interactions of a potassium ion channel studied by attenuated total reflection Fourier transform infrared spectroscopy
- PMID: 29168118
- PMCID: PMC5899698
- DOI: 10.1007/s12551-017-0337-8
Ion-protein interactions of a potassium ion channel studied by attenuated total reflection Fourier transform infrared spectroscopy
Abstract
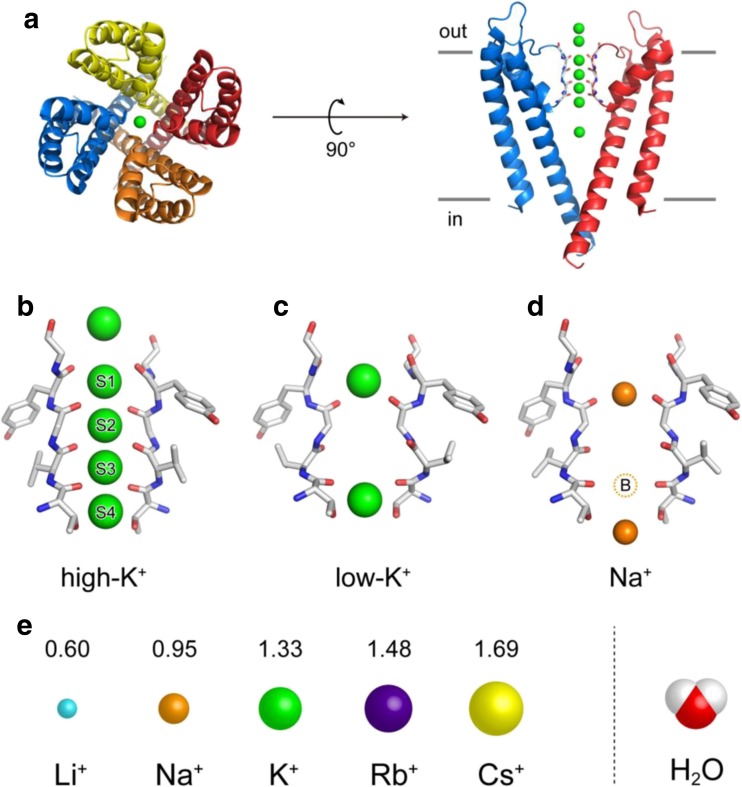
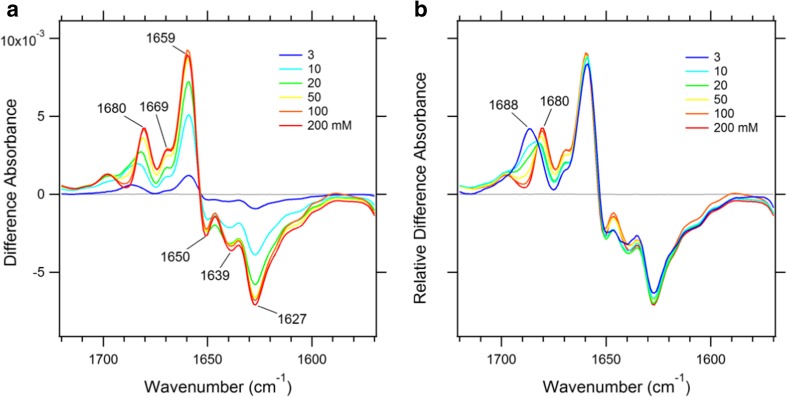
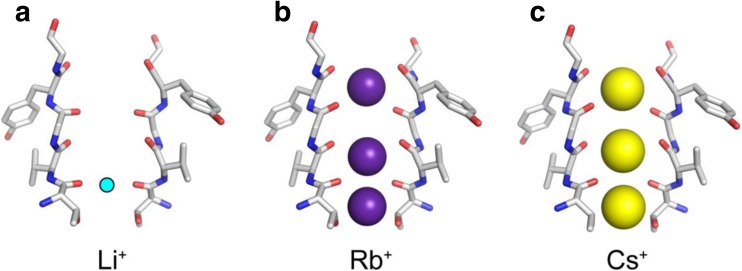
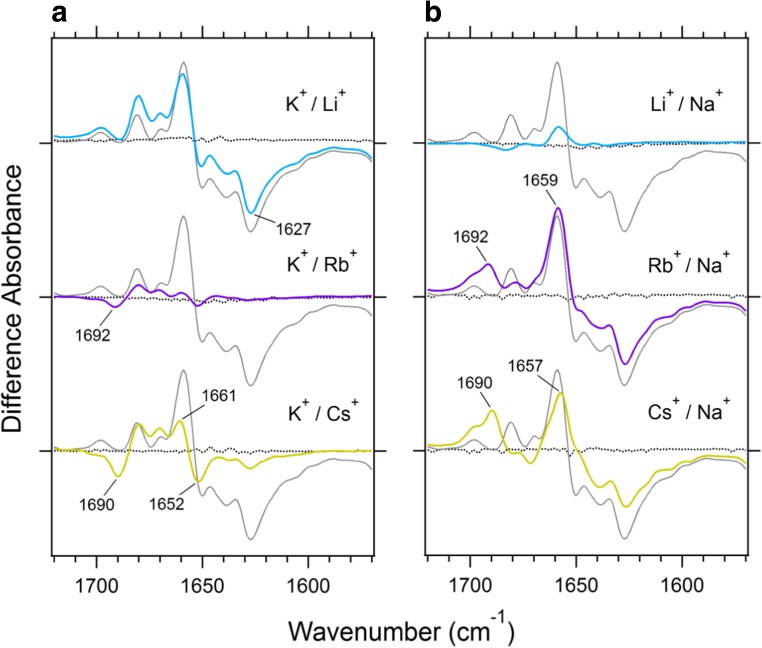
An understanding of ion-protein interactions is key to a better understanding of the molecular mechanisms of proteins, such as enzymes, ion channels, and ion pumps. A potassium ion channel, KcsA, has been extensively studied in terms of ion selectivity. Alkali metal cations in the selectivity filter were visualized by X-ray crystallography. Infrared spectroscopy has an intrinsically higher structural sensitivity due to frequency changes in molecular vibrations interacting with different ions. In this review article, I attempt to summarize ion-exchange-induced differences in Fourier transform infrared spectroscopy, as applied to KcsA, to explain how this method can be utilized to study ion-protein interactions in the KcsA selectivity filter. A band at 1680 cm-1 in the amide I region would be a marker band for the ion occupancy of K+, Rb+, and Cs+ in the filter. The band at 1627 cm-1 observed in both Na+ and Li+ conditions suggests that the selectivity filter similarly interacts with these ions. In addition to the structural information, the results show that the titration of K+ ions provides quantitative information on the ion affinity of the selectivity filter.
Keywords: Infrared spectroscopy; Ion channel; Ion–protein interactions; Membrane proteins.
Conflict of interest statement
Conflict of interest
Yuji Furutani declares that he has no conflicts of interest.
Ethical approval
This article does not contain any studies with human participants or animals performed by any of the authors.
Figures
Similar articles
-
Structural properties determining low K+ affinity of the selectivity filter in the TWIK1 K+ channel.J Biol Chem. 2018 May 4;293(18):6969-6984. doi: 10.1074/jbc.RA118.001817. Epub 2018 Mar 15. J Biol Chem. 2018. PMID: 29545310 Free PMC article.
-
Specific interactions between alkali metal cations and the KcsA channel studied using ATR-FTIR spectroscopy.Biophys Physicobiol. 2015 Sep 12;12:37-45. doi: 10.2142/biophysico.12.0_37. eCollection 2015. Biophys Physicobiol. 2015. PMID: 27493853 Free PMC article.
-
ATR-FTIR Spectroscopy Revealing the Different Vibrational Modes of the Selectivity Filter Interacting with K(+) and Na(+) in the Open and Collapsed Conformations of the KcsA Potassium Channel.J Phys Chem Lett. 2012 Dec 20;3(24):3806-10. doi: 10.1021/jz301721f. Epub 2012 Dec 10. J Phys Chem Lett. 2012. PMID: 26291114
-
Visualizing KcsA conformational changes upon ion binding by infrared spectroscopy and atomistic modeling.J Phys Chem B. 2015 May 7;119(18):5824-31. doi: 10.1021/acs.jpcb.5b02223. Epub 2015 Apr 25. J Phys Chem B. 2015. PMID: 25861001 Free PMC article.
-
Surface-enhanced IR absorption spectroscopy of the KcsA potassium channel upon application of an electric field.Phys Chem Chem Phys. 2015 Sep 7;17(33):21104-11. doi: 10.1039/c5cp02681d. Epub 2015 Jul 6. Phys Chem Chem Phys. 2015. PMID: 26147491 Review.
Cited by
-
Foreword to 'Multiscale structural biology: biophysical principles and mechanisms underlying the action of bio-nanomachines', a special issue in Honour of Fumio Arisaka's 70th birthday.Biophys Rev. 2018 Apr;10(2):105-129. doi: 10.1007/s12551-018-0401-z. Epub 2018 Mar 2. Biophys Rev. 2018. PMID: 29500796 Free PMC article.
-
Epithelial Sodium Channel Inhibition by Amiloride Addressed with THz Spectroscopy and Molecular Modeling.Molecules. 2022 May 19;27(10):3271. doi: 10.3390/molecules27103271. Molecules. 2022. PMID: 35630748 Free PMC article.
-
Structural properties determining low K+ affinity of the selectivity filter in the TWIK1 K+ channel.J Biol Chem. 2018 May 4;293(18):6969-6984. doi: 10.1074/jbc.RA118.001817. Epub 2018 Mar 15. J Biol Chem. 2018. PMID: 29545310 Free PMC article.
References
-
- Furutani Y, Shimizu H, Asai Y, Fukuda T, Oiki S, Kandori H. ATR-FTIR spectroscopy revealing the different vibrational modes of the selectivity filter interacting with K+ and Na+ in the open and collapsed conformations of the KcsA potassium channel. J Phys Chem Lett. 2012;3:3806–3810. doi: 10.1021/jz301721f. - DOI - PubMed
Publication types
Grants and funding
LinkOut - more resources
Full Text Sources
Other Literature Sources
