

Drivers of measles mortality: the historic fatality burden of famine in Bangladesh
- PMID: 29168439
- PMCID: PMC6010045
- DOI: 10.1017/S0950268817002564
Drivers of measles mortality: the historic fatality burden of famine in Bangladesh
Abstract
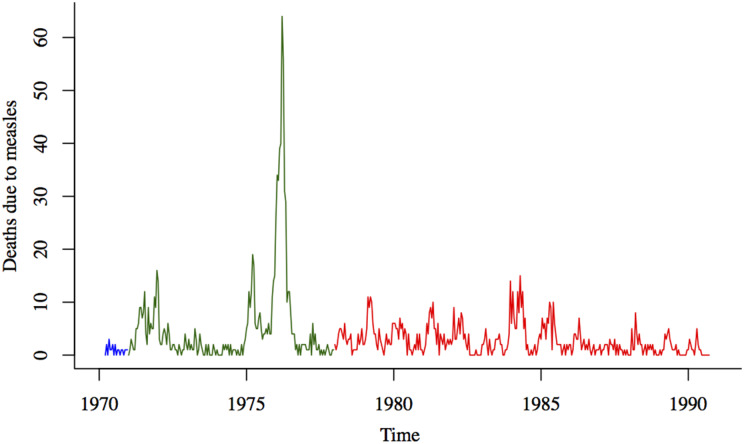
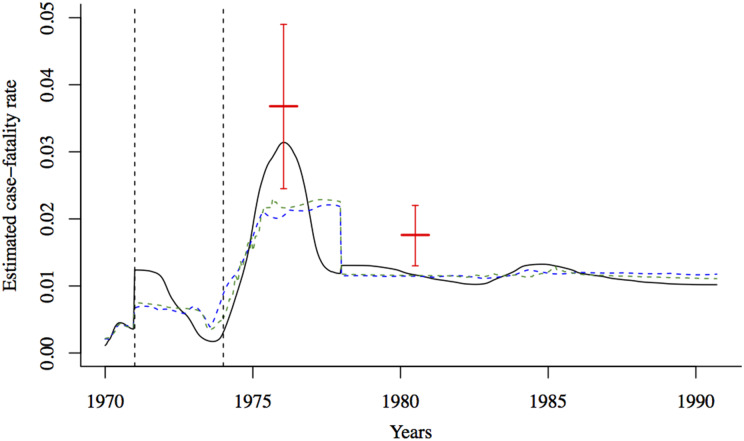
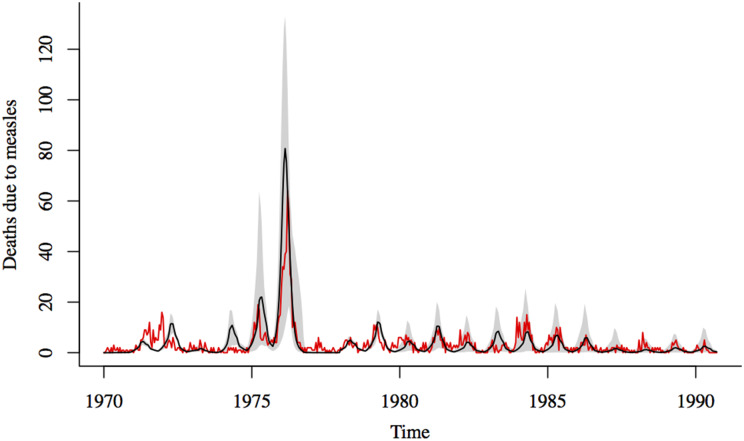
Measles is a major cause of childhood morbidity and mortality in many parts of the world. Estimates of the case-fatality rate (CFR) of measles have varied widely from place to place, as well as in the same location over time. Amongst populations that have experienced famine or armed conflict, measles CFR can be especially high, although past work has mostly focused on refugee populations. Here, we estimate measles CFR between 1970 and 1991 in a rural region of Bangladesh, which experienced civil war and famine in the 1970s. We use historical measles mortality data and a mechanistic model of measles transmission to estimate the CFR of measles. We first demonstrate the ability of this model to recover the CFR in the absence of incidence data, using simulated mortality data. Our method produces CFR estimates that correspond closely to independent estimates from surveillance data and we can capture both the magnitude and the change in CFR suggested by these previous estimates. We use this method to quantify the sharp increase in CFR that resulted in a large number of deaths during a measles outbreak in the region in 1976. Most of the children who died during this outbreak were born during a famine in 1974, or in the 2 years preceding the famine. Our results suggest that the period of turmoil during and after the 1971 war and the sustained effects of the famine, is likely to have contributed to the high fatality burden of the 1976 measles outbreak in Matlab.
Keywords: case-fatality rate; infectious disease epidemiology; mathematical modelling; measles (rubeola).
Figures
Similar articles
-
Case-fatality rate during a measles outbreak in eastern Niger in 2003.Clin Infect Dis. 2006 Feb 1;42(3):322-8. doi: 10.1086/499240. Epub 2005 Dec 19. Clin Infect Dis. 2006. PMID: 16392075
-
Measles outbreak response among adolescent and adult Somali refugees displaced by famine in Kenya and Ethiopia, 2011.J Infect Dis. 2014 Dec 15;210(12):1863-70. doi: 10.1093/infdis/jiu395. Epub 2014 Aug 12. J Infect Dis. 2014. PMID: 25117754
-
Measles deaths in Nepal: estimating the national case-fatality ratio.Bull World Health Organ. 2009 Jun;87(6):456-65. doi: 10.2471/blt.07.050427. Bull World Health Organ. 2009. PMID: 19565124 Free PMC article.
-
Measles mortality in India: a review of community based studies.J Commun Dis. 1994 Dec;26(4):203-14. J Commun Dis. 1994. PMID: 7759802 Review.
-
Measles case fatality ratio in India a review of community based studies.Indian Pediatr. 2009 Nov;46(11):983-9. Indian Pediatr. 2009. PMID: 19955580 Review.
Cited by
-
Association between seroprevalence of measles virus in monkeys and degree of human-monkey contact in Bangladesh.One Health. 2023 May 31;17:100571. doi: 10.1016/j.onehlt.2023.100571. eCollection 2023 Dec. One Health. 2023. PMID: 37332882 Free PMC article.
-
Extreme mortality during a historical measles outbreak on Rotuma is consistent with measles immunosuppression.Epidemiol Infect. 2024 May 13;152:e85. doi: 10.1017/S095026882400075X. Epidemiol Infect. 2024. PMID: 38736255 Free PMC article.
-
Small-molecule polymerase inhibitor protects non-human primates from measles and reduces shedding.Nat Commun. 2021 Sep 2;12(1):5233. doi: 10.1038/s41467-021-25497-4. Nat Commun. 2021. PMID: 34475387 Free PMC article.
References
-
- World Health Organization WHO Measles Fact Sheet 2016. [Online]. http://www.who.int/mediacentre/factsheets/fs286/en/.
-
- Wolfson LJ, Grais RF, Luquero FJ, Birmingham ME, Strebel PM. Estimates of measles case fatality ratios: a comprehensive review of community-based studies. International Journal of Epidemiology 2009; 38(1): 192–205. - PubMed
-
- Aaby P. Malnutrition and overcrowding/intensive exposure in severe measles infection: review of community studies. Clinical Infectious Diseases 1988; 10(2): 478–491. - PubMed
Publication types
MeSH terms
Grants and funding
LinkOut - more resources
Full Text Sources
Other Literature Sources
Medical
Miscellaneous
