Seasonality of urinary tract infections in the United Kingdom in different age groups: longitudinal analysis of The Health Improvement Network (THIN)
- PMID: 29168442
- PMCID: PMC9134528
- DOI: 10.1017/S095026881700259X
Seasonality of urinary tract infections in the United Kingdom in different age groups: longitudinal analysis of The Health Improvement Network (THIN)
Abstract
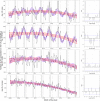
Evidence regarding the seasonality of urinary tract infection (UTI) consultations in primary care is conflicting and methodologically poor. To our knowledge, this is the first study to determine whether this seasonality exists in the UK, identify the peak months and describe seasonality by age. The monthly number of UTI consultations (N = 992 803) and nitrofurantoin and trimethoprim prescriptions (N = 1 719 416) during 2008-2015 was extracted from The Health Improvement Network (THIN), a large nationally representative UK dataset of electronic patient records. Negative binomial regression models were fitted to these data to investigate seasonal fluctuations by age group (14-17, 18-24, 25-45, 46-69, 70-84, 85+) and by sex, accounting for a change in the rate of UTI over the study period. A September to November peak in UTI consultation incidence was observed for ages 14-69. This seasonality progressively faded in older age groups and no seasonality was found in individuals aged 85+, in whom UTIs were most common. UTIs were rare in males but followed a similar seasonal pattern than in females. We show strong evidence of an autumnal seasonality for UTIs in individuals under 70 years of age and a lack of seasonality in the very old. These findings should provide helpful information when interpreting surveillance reports and the results of interventions against UTI.
Keywords: The Health Improvement Network; Urinary tract infections (UTIs); seasonality.
Conflict of interest statement
None of the authors has any conflicts of interest to declare. The funding bodies had no role in the study design, data collection and analysis, decision to publish, or preparation of the manuscript. The views expressed are those of the authors, and not necessarily those of the funding bodies.
Figures


References
-
- Ian Blunt. Trends in emergency admissions for ambulatory care sensitive conditions, 2001 to 2013. QualityWatch: focus on preventable admissions. 2013. (http://www.health.org.uk/sites/health/files/QualityWatch_FocusOnPreventa...). Accessed 27 October 2017.
-
- Public Health England. English surveillance programme for antimicrobial utilisation and resistance (ESPAUR) report 2016. 2016. (https://www.gov.uk/government/uploads/system/uploads/attachment_data/fil...). Accessed 27 October 2017.
Publication types
MeSH terms
Substances
LinkOut - more resources
Full Text Sources
Other Literature Sources
Medical

