. 2017 Nov 30;551(7682):648-652.
doi: 10.1038/nature24661. Epub 2017 Nov 22.

A gut bacterial pathway metabolizes aromatic amino acids into nine circulating metabolites

Affiliations

A gut bacterial pathway metabolizes aromatic amino acids into nine circulating metabolites

Dylan Dodd et al. Nature. .

Abstract

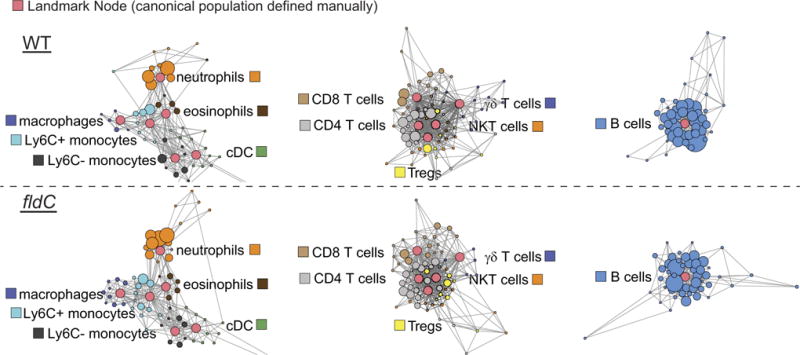
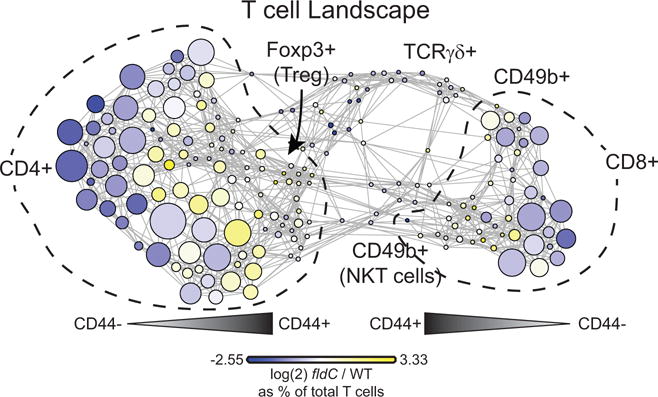
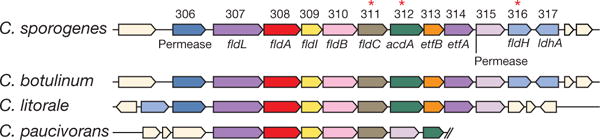
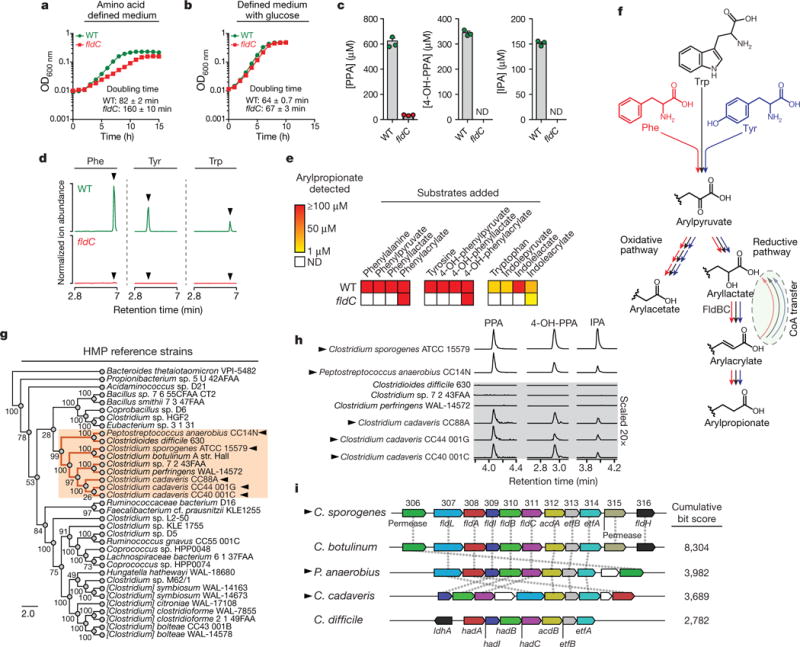
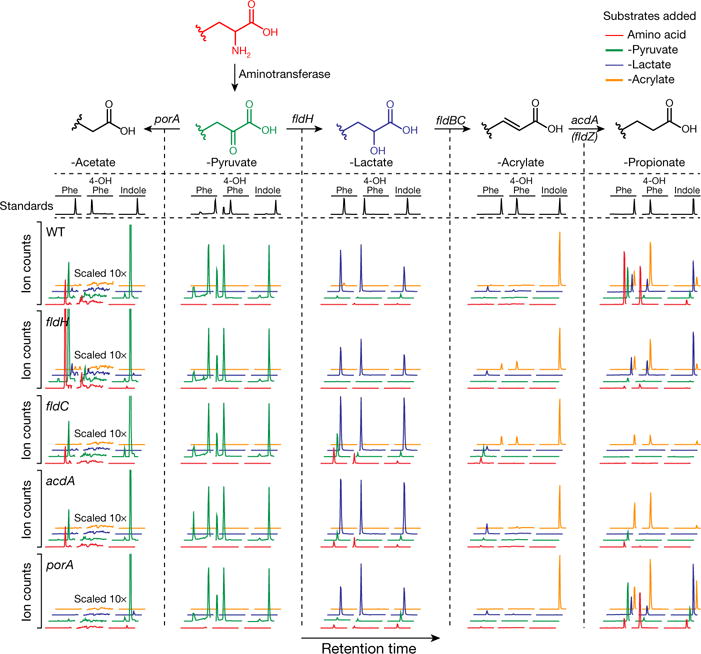
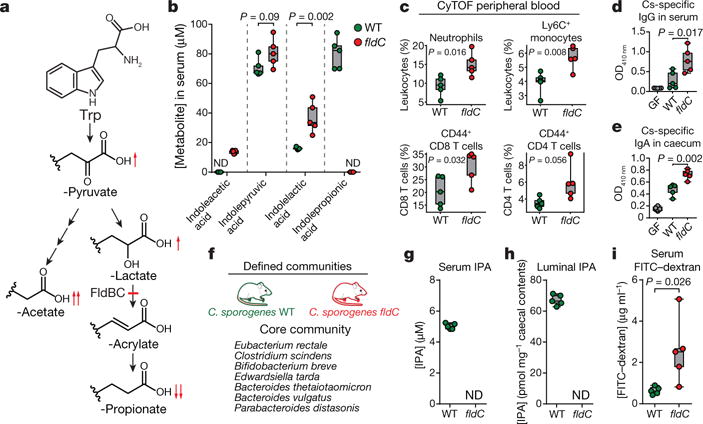
The human gut microbiota produces dozens of metabolites that accumulate in the bloodstream, where they can have systemic effects on the host. Although these small molecules commonly reach concentrations similar to those achieved by pharmaceutical agents, remarkably little is known about the microbial metabolic pathways that produce them. Here we use a combination of genetics and metabolic profiling to characterize a pathway from the gut symbiont Clostridium sporogenes that generates aromatic amino acid metabolites. Our results reveal that this pathway produces twelve compounds, nine of which are known to accumulate in host serum. All three aromatic amino acids (tryptophan, phenylalanine and tyrosine) serve as substrates for the pathway, and it involves branching and alternative reductases for specific intermediates. By genetically manipulating C. sporogenes, we modulate serum levels of these metabolites in gnotobiotic mice, and show that in turn this affects intestinal permeability and systemic immunity. This work has the potential to provide the basis of a systematic effort to engineer the molecular output of the gut bacterial community.


Conflict of interest statement

Author Information The authors declare no competing financial interests. Readers are welcome to comment on the online version of the paper.

Figures

Extended Data Figure 1
Extended Data Figure 1. Search for an indolelactate dehydratase
a, Phylogenetic analyses indicate that FldC (CLOSPO_00311) is distinct from its closest isospecific, heterofunctional homologue (HadC, CLOSPO_02758) in C. sporogenes. The neighbour-joining tree was built from the top 100 BLAST hits to FldC from the GenBank database. Sequences from very similar species and strains are collapsed into red branches. b, Genomic context for fldC and the most similar gene (hadC) in C. sporogenes. The amino acid sequence similarity between FldC and HadC is 47%.
Extended Data Figure 2
Extended Data Figure 2. Generation of the phenyllactate dehydratase disruption mutant
a, The ClosTron bacterial type II intron system was used to disrupt fldC (CLOSPO_00311) by insertion of an erythromycin-containing intron within the coding sequence at nucleotide position 561. b, Successful integration at the fldC locus was determined by amplifying DNA using primers flanking the region of insertion. The expected PCR product for the wild type is 600 bp as shown in the ethidium-bromide-stained agarose gel from a single experiment. Successful chromosomal integration was confirmed by Sanger sequencing.
Extended Data Figure 3
Extended Data Figure 3. Summary of biochemical pathways for AAA metabolism by C. sporogenes
Phenylalanine, tyrosine and tryptophan are all metabolized through the reductive pathway by the same enzymes. The first step is an aminotransferase reaction, probably catalysed by aromatic amino acid aminotransferase (Aat). This enzyme activity has been demonstrated in C. sporogenes cells, however, the gene encoding this enzyme has not been identified. The arylpyruvates are then converted to their corresponding aryllactates by phenyllactate dehydrogenase (FldH, CLOSPO_00316). The aryllactates are then dehydrated by phenyllactate dehydratase (FldBC, CLOSPO_00310-311) along with its activator (FldI, CLOSPO_00309). Previous studies indicate that the dehydration reaction requires the substrate to first be activated to a CoA thioester, probably catalysed by acyl-CoA ligase (FldL, CLOSPO_00307), and that the CoA is recycled by the action of acyl-CoA transferase (FldA, CLOSPO_00308). Finally, the arylacrylates are reduced by acyl-CoA dehydrogenase (AcdA, CLOSPO_00312) involving its two electron transport factors (EtfA-EtfB, CLOSPO_00313-314). For the oxidative pathway, phenylpyruvate and 4-OH-phenylpyruvate are first oxidatively decarboxylated by pyruvate:ferredoxin oxidoreductase A (PorA, CLOSPO_00147-149), followed by phosphate acyltransferase and acyl kinase reactions that remain to be studied. The enzyme involved in indoleacetic acid production remains unknown, however, candidate genes in the genome include pyruvate:ferredoxin oxidoreductases B and C (PorB, CLOSPO_02262; PorC, CLOSPO_03792). Transformations for which the specific genes involved are not known are indicated in red.
Extended Data Figure 4
Extended Data Figure 4. acdA, fldH and porA mutants exhibit growth defects when cultured with amino acids as the sole carbon source
a–f, The wild-type (a–f) and acdA (a, d), fldH (b, e) and porA (c, f) mutant strains of C. sporogenes were cultured in minimal defined medium containing 10 amino acids at standard concentrations (SACC) with (d–f) or without (a–c) glucose (10 mM) and growth was monitored spectrophotometrically. Representative curves from n = 3 biological replicates are shown and doubling times are reported as mean ± s.d.
Extended Data Figure 5
Extended Data Figure 5. fldZ does not exhibit a growth defect during amino acid fermentation
a, b, The wild-type and fldZ mutant strains of C. sporogenes were cultured in minimal defined medium containing 10 amino acids at standard concentrations (SACC) with (a) or without (b) glucose (10 mM) and growth was monitored spectrophotometrically. Representative curves from n = 3 biological replicates are shown and doubling times are reported as mean ± s.d.
Extended Data Figure 6
Extended Data Figure 6. The fldZ mutant is defective in conversion of phenylacrylate and 4-OH-phenylacryalte
Resting cell suspensions of wild-type and fldZ mutant C. sporogenes were prepared and incubated with phenylacrylate, 4-OH-phenylacrylate or indoleacrylate for 1 h at 37 °C. Cells were then collected by centrifugation and the corresponding arylacrylates were detected in the supernatant by LC-MS/MS. The presence of a peak corresponds to a defect in the conversion of the indicated substrate (that is, retention of precursor). Representative chromatograms from n = 3 biological replicates are shown.
Extended Data Figure 7
Extended Data Figure 7. porA is important for phenylacetate and 4-OH-phenylacetate production, but not indoleacetate
Resting cell suspensions of wild-type and porA mutant C. sporogenes were prepared at a fourfold higher cell density (for example, 1/20 culture volume), and incubated with phenylalanine, tyrosine, tryptophan (red) or indolepyruvate (green) for 1 h at 37 °C. Cells were then collected by centrifugation and the arylacetates were detected in the supernatant by LC-MS/MS. The absence of a peak indicates a defect in the conversion of the indicated substrate to the corresponding arylacetate. Representative chromatograms from n = 3 biological replicates are shown.
Extended Data Figure 8
Extended Data Figure 8. Broad overview of scaffold maps of mass cytometry data
Scaffold maps of immune cells in the peripheral blood of mice colonized with wild-type or fldC mutant C. sporogenes. The full scaffold maps are presented here to provide topological context; zoomed-in regions are shown in Extended Data Fig. 9.
Extended Data Figure 9
Extended Data Figure 9. Fine detail scaffold maps of mass cytometry data
Scaffold maps of mass cytometry data from the peripheral blood of mice colonized with wild-type (top) or fldC mutant (bottom) C. sporogenes. Red nodes represent landmarks, or canonical immune cell populations defined manually. These landmarks facilitate the interpretation of the graph. Other nodes represent unsupervised clusters of similar cells, providing a data-driven representation of the cells present in the samples. The size of these nodes reflects the number of cells in that particular cluster. Unsupervised clusters are coloured according to their nearest landmark node. Edges in the graphs connect similar cells, with the length of each edge inversely proportional to that similarity. Cells that are most similar to one another are thereby connected by a short edge.
Extended Data Figure 10
Extended Data Figure 10. Unsupervised force-directed graph of T cells in the peripheral blood
T cells from mice colonized with wild-type and fldC mutant C. sporogenes were clustered together. Each cluster of T cells is coloured by the log2 fold change of the frequency in mice colonized with fldC mutant over wild-type C. sporogenes to visualize differences between the groups.
Figure 1
Figure 1. Genes in the reductive pathway of phenylalanine metabolism map to a conserved gene cluster
Gene designations are indicated as follows: fldL, acyl-CoA ligase; fldA, acyl-CoA transferase; fldI, dehydratase activator; fldB, phenyllactate dehydratase subunit; fldC, phenyllactate dehydratase subunit; acdA, acyl-CoA dehydrogenase; etfB, electron transport flavoprotein subunit B; etfA, electron transport flavoprotein subunit A; fldH, phenyllactate dehydrogenase; ldhA, lactate dehydrogenase. Asterisks indicate genes targeted for disruption.
Figure 2
Figure 2. A pathway for reductive aromatic amino acid metabolism by members of the gut microbiota
a, b, The fldC mutant exhibits a growth defect during AAA metabolism. OD, optical density; WT, wild type. c, Metabolite analysis of supernatants from cultures in a. d, e, The fldC mutant exhibits a defect in reductive metabolism of AAAs. ND, not detected. f, Summary of the predicted pathway for AAA metabolism showing phenyllactate dehydratase (FldBC). g, Phylogenetic distribution of reference strains. h, Metabolite screening identifies AAA-reducing strains. i, AAA-reducing microbes share similar gene clusters with C. sporogenes. hadA, isocaproyl-CoA:2-hydroxyisocaproate CoA transferase; hadI, 2-hydroxyisocaproyl-CoA dehydratase activator; hadBC, 2-hydroxyisocaproyl-CoA dehydratase; acdB, acyl-CoA dehydrogenase. a, b, d, h, Representative curves from n = 3 biological replicates are shown; a–c, Data are mean ± s.d. Arrowheads in d mark retention times for arylpropionates. Arrowheads in g, h, i indicate strains capable of AAA reduction.
Figure 3
Figure 3. Metabolite profiling reveals shared and divergent features in AAA metabolic pathways
Mutant and wild-type C. sporogenes were incubated with phenylalanine, tyrosine and tryptophan derivatives of each of the four coloured compounds and metabolites were assayed by LC-MS/MS. Compared to wild-type, the fldH, fldC and acdA mutants were deficient in reductive metabolism of phenylalanine, tyrosine and tryptophan (rows 1–4, column 5, red and green traces). Relative to wild-type, the porA mutant was deficient in oxidative metabolism of phenylalanine and tyrosine, but not tryptophan (rows 1 and 5, column 1, red and green traces). Representative chromatograms from n = 3 biological replicates. Phe, phenyl; 4-OH-Phe, 4-hydroxyphenyl.
Figure 4
Figure 4. Gut bacteria-driven modulation of mouse serum metabolites alters host immune activation and intestinal permeability
a, Tryptophan metabolism by C. sporogenes. be, Germ-free (GF) mice were mono-colonized with the wild-type strain or the fldC mutant. b, Altered tryptophan metabolites in fldC-colonized mice. c, Immune cell subsets in peripheral blood analysed using mass cytometry (CyTOF). d, e, Bacterial indirect ELISA. f, Defined community experiment. gi, Germ-free mice were colonized with organisms listed in f, including either WT or fldC mutant C. sporogenes. g, h, IPA was quantified in serum (g) or caecal contents (h) by LC-MS/MS. i, FITC-dextran intestinal permeability. b–e, g–i, Box and whisker plots show median values, 25th–75th percentiles and range for n = 5 biological replicates. b–e, i, P values are shown from two-tailed, unpaired t-tests.

Comment in

Similar articles

Cited by

References

    1. Nicholson JK, et al. Host-gut microbiota metabolic interactions. Science. 2012;336:1262–1267. - PubMed
    1. Wikoff WR, et al. Metabolomics analysis reveals large effects of gut microflora on mammalian blood metabolites. Proc Natl Acad Sci USA. 2009;106:3698–3703. - PMC - PubMed
    1. Danaceau JP, Anderson GM, McMahon WM, Crouch DJ. A liquid chromatographic-tandem mass spectrometric method for the analysis of serotonin and related indoles in human whole blood. J Anal Toxicol. 2003;27:440–444. - PubMed
    1. Venkatesh M, et al. Symbiotic bacterial metabolites regulate gastrointestinal barrier function via the xenobiotic sensor PXR and Toll-like receptor 4. Immunity. 2014;41:296–310. - PMC - PubMed
    1. Chyan YJ, et al. Potent neuroprotective properties against the Alzheimer β-amyloid by an endogenous melatonin-related indole structure, indole-3- propionic acid. J Biol Chem. 1999;274:21937–21942. - PubMed

Publication types

MeSH terms