. 2017 Nov 30;551(7682):590-595.
doi: 10.1038/nature24477. Epub 2017 Nov 22.

Mechanism of tandem duplication formation in BRCA1-mutant cells

Affiliations

Mechanism of tandem duplication formation in BRCA1-mutant cells

Nicholas A Willis et al. Nature. .

Abstract

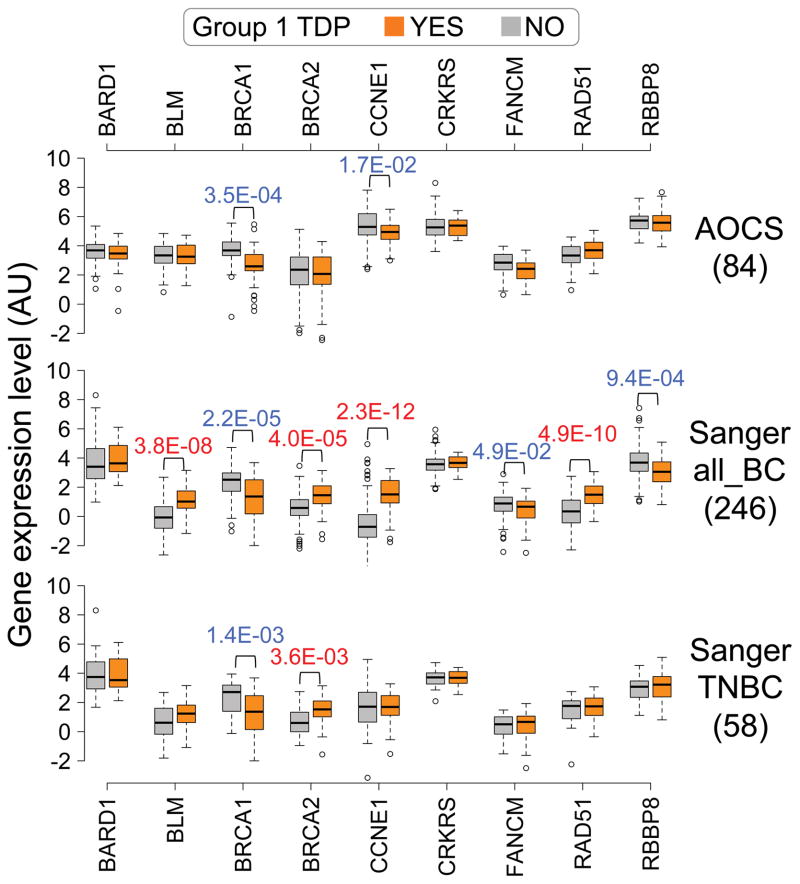
Small, approximately 10-kilobase microhomology-mediated tandem duplications are abundant in the genomes of BRCA1-linked but not BRCA2-linked breast cancer. Here we define the mechanism underlying this rearrangement signature. We show that, in primary mammalian cells, BRCA1, but not BRCA2, suppresses the formation of tandem duplications at a site-specific chromosomal replication fork barrier imposed by the binding of Tus proteins to an array of Ter sites. BRCA1 has no equivalent role at chromosomal double-stranded DNA breaks, indicating that tandem duplications form specifically at stalled forks. Tandem duplications in BRCA1 mutant cells arise by a replication restart-bypass mechanism terminated by end joining or by microhomology-mediated template switching, the latter forming complex tandem duplication breakpoints. Solitary DNA ends form directly at Tus-Ter, implicating misrepair of these lesions in tandem duplication formation. Furthermore, BRCA1 inactivation is strongly associated with ~10 kilobase tandem duplications in ovarian cancer. This tandem duplicator phenotype may be a general signature of BRCA1-deficient cancer.


Conflict of interest statement

The authors declare no competing financial interests.

Figures

Extended Data Figure 1
Extended Data Figure 1. BRCA1 suppresses Rad51-independent Tus/Ter-induced GFPRFP+ repair outcomes
a, Repair frequencies in BRCA1fl/exon11 and BRCA1Δ/exon11 6xTer-HR reporter cells transfected with Tus or I-SceI and with either control Luciferase siRNA (siLUC) or BRCA1 SMARTpool (siBRCA1). Columns represent mean of duplicate samples from ten independent experiments (i.e., n=10). Error bars: s.e.m. Tus-induced HR, BRCA1fl/exon11 cells, t-test siBRCA1 vs. siLUC: All measurements p<0.01; BRCA1Δ/exon11 cells, siBRCA1 vs. siLUC: Total HR: p=0.0470; STGC: p=0.0003; LTGC: not significant (NS); LTGC/Total HR: p<0.0001; GFPRFP+: p=0.0010. I-SceI-induced HR, BRCA1fl/exon11 cells, t-test siBRCA1 vs. siLUC: All measurements P<0.05; BRCA1Δ/exon11 cells, t-test siBRCA1 vs. siLUC: All measurements p<0.02. b, Representative primary FACS data for BRCA1fl/exon11 and BRCA1Δ/exon11 6xTer-HR reporter cells transfected with empty vector (EV), Tus or I-SceI and with siLUC or siBRCA1. Tus-transfected samples reproduced from Fig. 1b. FACS plots produced from pooled data of duplicate samples from three independent experiments. Numbers represent percentages. c, RT-qPCR analysis of BRCA1 mRNA in siRNA-treated cells. Data normalized to GAPDH and expressed as fold difference from siLUC sample from the same experiment (x=−2ΔΔCt, with ΔΔCt= [Ct target-CtGapdh]-[CtsiLUC-CtsiGAPDH]). Error-bars: standard deviation of ΔCt value (SDEV = √[SDEVTARGET2 + SDEVGAPDH2]). d, Frequencies of GFPRFP+ events in BRCA1fl/exon11 and BRCA1Δ/exon11 6xTer-HR reporter cells transfected with Tus or I-SceI and with either siLUC, siBRCA1, or RAD51 SMARTpool (siRAD51). Columns represent mean of duplicate samples, n=5. Error bars: s.e.m. Tus-induced GFPRFP+, BRCA1fl/exon11 cells, t-test: All comparisons p<0.05. Tus-induced GFPRFP+, BRCA1Δ/exon11 cells, t-test: All comparisons p<0.03. Abundance of Rad51 protein in siRNA-treated BRCA1fl/exon11 and BRCA1Δ/exon11 6xTer-HR reporter ES cells. For gel source data, see Supplementary Fig. 1.
Extended Data Figure 2
Extended Data Figure 2. Examples of breakpoint sequence analysis of Tus/Ter-induced GFPRFP+ products: Class 1 and Class 2 rearrangements are microhomology-mediated tandem duplications (TDs)
a, Structure of the GFPRFP+ Class 1 rearrangement marked with red asterisk in Fig. 2. Cartoon elements as in Figs. 1 and 2; orange triangle represents 6xTer array. Right cartoon: Schematic of TD breakpoint. Grey number: site of Ter-proximal breakpoint relative to Ter array. In this TD clone, this breakpoint is located 333 bp upstream of the first nucleotide of the first Ter site encountered by the rightward replication fork (i.e., position −333). Black number: number of base pairs of MH at the breakpoint (in this clone, MH=2). Grey arrows identify the orientation of the segments of the TD, relative to the reporter. Upper text box: direct sequence of TD breakpoint. Green bold text: fragments of GFP open reading frame (ORF). Red bold letters: 2 bp MH breakpoint. Black text: other reporter sequences. Lower text box: overlay of TD breakpoint ends (green bold for GFP sequences + red bold for 2 bp MH breakpoint) on full-length wild type GFP (grey). b, Structure of the GFPRFP+ Class 2 rearrangement marked with blue asterisk in Fig. 2. Blue letter “B”: BglII site retained within TD breakpoint. Right cartoon: Schematic of TD breakpoint, elements as in panel a. In this TD clone, the Ter-proximal TD breakpoint is located 8 bp downstream of the first nucleotide of the first Ter site encountered by the rightward replication fork (i.e., position +8). Text box: direct sequence of TD breakpoint. Green bold text: fragments of GFP ORF. Orange highlighting: 8 bp fragment of first Ter element retained within TD breakpoint. Red bold letter: 1 bp MH breakpoint. Blue highlighting: BglII site retained within TD. Black text: other reporter sequences.
Extended Data Figure 3
Extended Data Figure 3. Specificity of BRCA1 loss on Tus/Ter-induced TDs
a, Tus/Ter-induced and I-SceI-induced TD (GFPRFP+) products in BRCA1fl/exon11 or BRCA1Δ/exon11 6xTer-HR cells depleted of repair proteins indicated. Induction of repair products was calculated relative to siLUC controls (which therefore score as 1). Data represents mean of between eight and ten independent experiments, each experimental data point collected in duplicate (replicates: BRCA1, n=10; BARD1, n=9; CtIP, n=9; BLM, n=8; FANCM, n=9; BRCA2, n=8; FANCA, n=9; FANCD2, n=10; RAD51, n=9; SLX4, n=9). Error bars: s.e.m. b, Tus-induced and I-SceI-induced STGC (GFP+RFP) products in BRCA1fl/exon11 or BRCA1Δ/exon11 6xTer-HR cells depleted of repair proteins indicated. Replicates and error bars as in panel a. c, Representative primary FACS data for BRCA1Δ/exon11 6xTer-HR reporter cells co-transfected with empty vector (EV), Tus or I-SceI expression vectors (as shown) and siRNAs as shown. FACS plots pooled from duplicate samples of four independent experiments. Numbers represent percentages. d, RT qPCR analysis of BLM, FANCM, BRCA2, FANCA, SLX4, CTIP, BARD1 mRNA. Data normalized to GAPDH and expressed as a fold difference from siLUC treated sample from the same experiment (x=−2ΔΔCt, with ΔΔCt= [Ct target-CtGapdh]-[CtsiLUC-CtsiGAPDH]). Error-bars represent the standard deviation of the ΔCt value (SDEV = √[SDEVTARGET2 + SDEVGAPDH2]).
Extended Data Figure 4
Extended Data Figure 4. Tus/Ter-induced TDs in FANCM- or BLM-depleted BRCA1Δ/exon11 6xTer-HR reporter cells
a, Southern blot analysis of Tus/Ter-induced LTGC and GFPRFP+ TD products in FANCM or BLM-depleted BRCA1Δ/exon11 6xTer-HR reporter cells (BglII digest, GFP probe). MW: molecular weight lane. TD Breakpoints were identified by PCR product sequencing. b, Repair frequencies in BRCA1fl/exon11 and BRCA1Δ/exon11 6xTer-HR reporter cells transfected with siLUC, siFANCM, siBLM or siFANCM+siBLM in combination. Columns represent mean of duplicate samples, n=7. Error bars: s.e.m. Tus/Ter-induced Total HR, BRCA1fl/exon11 cells, t-test: siFANCM vs. siLUC and siBLM vs. all others p<0.0001; BRCA1Δ/exon11 cells, t-test: siBLM or siFANCM+siBLM vs. siLUC: p<0.005. Tus/Ter-induced STGC, BRCA1fl/exon11 cells, t-test: siFANCM vs. siLUC and siBLM vs. all others p<0.0010; BRCA1Δ/exon11 cells, t-test: siFANCM+siBLM vs. siLUC: p=0.01. Tus/Ter-induced LTGC, BRCA1fl/exon11 cells, t-test: siFANCM or siBLM vs. siLUC: p<0.0001; siFANCM+siBLM vs. all others p<0.005; BRCA1Δ/exon11 cells, t-test: siFANCM or siBLM vs. siLUC: p<0.01; siFANCM+siBLM vs. all others p<0.03. Tus/Ter-induced Ratio LTGC:Total HR, BRCA1fl/exon11 cells, t-test: all siFANCM samples vs. those with no siFANCM: p<0.001; BRCA1Δ/exon11 cells, t-test: all samples vs. siLUC: p<0.002; siFANCM vs. siFANCM+siBLM: p=0.0420; siBLM vs. siFANCM+siBLM: p=0.0294. Tus/Ter-induced TD, BRCA1Δ/exon11 cells, t-test: siFANCM or siBLM vs. siLUC: p<0.002; siFANCM vs. siBLM: NS; siFANCM+siBLM vs. all others: p<0.0001. I-SceI-induced Total HR, BRCA1fl/exon11 cells, t-test: siFANCM vs. siBLM: p=0.0265. I-SceI-induced STGC, BRCA1fl/exon11 cells, t-test: siFANCM vs. siLUC or siBLM: p<0.05; siBLM vs. siFANCM+siBLM: p=0.0445. I-SceI-induced LTGC: NS. I-SceI-induced Ratio LTGC:Total HR, BRCA1fl/exon11 cells, t-test: all samples vs. siLUC: p<0.03; siFANCM vs. siFANCM+siBLM: p=0.0305; BRCA1Δ/exon11 cells, t-test: all samples vs. siLUC: p<0.05; siFANCM vs. siBLM: p=0.0245. I-SceI-induced TD, BRCA1Δ/exon11 cells, t-test: all samples vs. siLUC: p<0.02. For gel source data, see Supplementary Fig. 1.
Extended Data Figure 5
Extended Data Figure 5. BRCA2 is not a major suppressor of Tus/Ter-induced TDs
a, GFPRFP+ products in BRCA1fl/exon11 6xTer-HR cells transfected with siFANCM or siBLM alone or together with siBRCA1, siBARD1, siBRCA2 or siRAD51. Columns represent mean of triplicate samples, n=5. Error bars: s.e.m. Tus-induced TDs, t-test: siFANCM+siBRCA1 or siBARD1 vs. all other samples: p<0.01. siBLM+siBRCA1 or siBARD1 vs. all other samples: p<0.03. I-SceI-induced TDs, t-test: all comparisons not significant (NS). b, GFPRFP+ products in BRCA1fl/exon11 6xTer-HR cells following depletion of CtIP. Columns represent mean of duplicate samples, n=11. Error bars: s.e.m. Tus-induced TD t-test: all samples vs. siLUC: p<0.01; siFANCM+siCtIP vs. siCtIP or siFANCM: p<0.001; siFANCM+siBRCA1 vs. all other siFANCM samples: p<0.0001; siBLM+siCtIP vs. siBLM: p<0.0001; siBLM+siBRCA1 vs. all other siBLM samples: p<0.0001. I-SceI-induced TD t-test: all samples vs. siLUC: p<0.05; siFANCM+siCtIP vs. siCtIP p=0.0311; siFANCM+siBRCA1 vs. all other siFANCM samples: p<0.01; siFANCM+siCtIP vs. siFANCM NS; siBLM+siBRCA1 vs. all other siBLM samples: p<0.01; siBLM+siCtIP vs. siBLM p=NS. c, GFPRFP+ products in two independently derived BRCA2lex1/lex2 single-copy 6xTer-HR reporter clones transfected with siRNAs as shown. Columns represent mean of duplicate samples, n=8. Error bars: s.e.m. Clone #3 Tus-induced TD t-test: siFANCM+siBRCA1 vs. all other samples: p<0.01; siLUC vs. siFANCM+siBRCA2: p=0.0131; siFANCM vs. siFANCM+siBRCA2: NS. Clone #56 Tus-induced TD t-test: siFANCM+siBRCA1 vs. all other samples: p<0.003; siFANCM vs. siFANCM+siBRCA2: NS. Clone #3 and clone #56 I-SceI-induced TD: NS. d, RT qPCR analysis of siRNA-treated BRCA2lex1/lex2 6xTer-HR cells. Data normalized to GAPDH and expressed as a fold difference from siLUC sample (x=−2ΔΔCt, with ΔΔCt= [Ct target-CtGapdh]-[CtsiLUC-CtsiGAPDH]). Error-bars: standard deviation of the ΔCt value (SDEV = √[SDEVTARGET2 + SDEVGAPDH2]). e, BRCA2 gene structure in BRCA2lex1/lex2 reporter cells. Grey boxes: BRCA2 exons. PCR primers a, b, and c indicated by arrows. neo: neomycin resistance gene. HPRT: hypoxanthine-guanine phosphoribosyl-transferase gene. *Partial Exon26 deletion. For gel source data, see Supplementary Fig. 1.
Extended Data Figure 6
Extended Data Figure 6. Tus/Ter-induced TDs arise by a replicative mechanism involving canonical end-joining
a, Southern blot analysis of aneuploid TD clones (AseI digest of gDNA, full length GFP probe). Same data as Fig. 4b. Parental Ter-HR reporter (“P”) marks size of unaltered reporter. b, Southern blot analysis of 19 reclones of aneuploid TD clones (AseI digest of gDNA, full length GFP probe) that contained a second reporter copy. M: molecular weight; R: original aneuploid clone; lanes 3–20, nineteen independent re-clones. For parental and TD structure, see Fig. 4b. c, Tus/Ter-induced TDs in FANCM-depleted XRCC4fl/fl (#8) and XRCC4Δ/Δ (#11) cells co-transfected with siRNAs shown. Mean of duplicates, n=5. Error bars: s.e.m. t-test P values apply to #8 and #11 data unless otherwise stated. siFANCM+siBRCA1 or siFANCM+siBARD1 vs. all other samples: <0.02, except for clone #11 siFANCM+siBRCA1 vs. siFANCM+siRAD51: NS; siFANCM+siBRCA1 vs. siFANCM+siBARD1: NS; siFANCM+siBRCA2 or siFANCM+siRAD51 vs: siLUC or siFANCM: NS. d, Tus/Ter-induced TDs in BLM-depleted XRCC4fl/fl (#8) and XRCC4Δ/Δ (#11) cells co-transfected with siRNAs shown. Mean of duplicates, n=5. Error bars: s.e.m. t-test P values apply to both #8 and #11 data unless otherwise stated. siBLM+siBRCA1 or siBLM+siBARD1 vs. all other samples in clone #8: p<0.05. In clone #11 siBLM+siBRCA1 or siBLM+siBARD1 vs. siBLM+siRAD51 or siBLM+siBRCA2: NS; siBLM+siBRCA1 vs. siBLM+siBARD1: NS. siBLM+siBRCA2 or siBLM+siRAD51 vs: siLUC or siBLM: NS. e, Rad51 western blot in siRNA-treated #8 and #11 cells. f, RT qPCR analysis of FANCM, BRCA1, BARD1, BLM, and BRCA2 mRNA in siRNA-treated #8 and #11 cells. Data normalized to GAPDH and expressed as fold difference from siLUC sample (x=−2ΔΔCt, with ΔΔCt= [Ct target-CtGapdh]-[CtsiLUC-CtsiGAPDH]). Error-bars: standard deviation of ΔCt value (SDEV = √[SDEVTARGET2 + SDEVGAPDH2]). g, RT qPCR analysis of BRCA1, FANCM and BLM mRNA in siRNA-treated XRCC4Δ/Δ (#11) cells lentivirally transduced with pHIV-EV or pHIV-mXRCC4 (“X4”). See f for normalization and error-bar detail. For gel source data, see Supplementary Fig. 1.
Extended Data Figure 7
Extended Data Figure 7. Breakpoint analysis of Tus/Ter-induced TDs
a, Span of TDs in BRCA1Δ/exon11 6xTer-HR reporter siFANCM (121 independent TDs), siBRCA1 (44 independent TDs), or siBLM (66 independent TDs) treatment groups. b, Microhomology (MH) usage at breakpoint of Tus/Ter-induced TDs for BRCA1Δ/exon11 cells depleted of FANCM, BRCA1 or BLM. Numbers in panel count total number of breakpoints with MH≤5, excluding untemplated insertions. Grey line: expected MH usage by chance alone. c, Strand preference of mismatch correction in 14 homeologous breakpoints (i.e., MH with internal mismatches) of Tus/Ter-induced TDs from BRCA1Δ/exon11 cells transfected with siRNAs shown. “C/T” indicates C-T mismatch. TD site (i.e., Ter-proximal or upstream) that underwent mismatch correction is noted. d, Template switches associated with six TD breakpoints. Cartoon format as in Extended Data Fig. 2a. Light grey arrows identify orientation of TD segments relative to the parental reporter. Grey numbers: position of Ter-proximal site relative to first Ter site encountered by rightward fork. Black numbers: Breakpoint MH use (bp). Template switch insertions as shown. e, Distribution of Ter-proximal sites of TD breakpoints in BRCA1Δ/exon11 cells for each treatment group, relative to first Ter site encountered by rightward fork. 10bp binned data. Grey area/orange triangles: 6xTer-array. Bottom panel, distribution of Ter-proximal TD sites in BRCA1Δ/exon11 6xTer-HR reporter cells transfected with siFANCM, siBRCA1, or siBLM. The source data is identical to that used for histograms in upper panels, but has been re-presented as “survival” curves, scoring the probability that a Ter-proximal TD site will be positioned to the right of the nucleotide in question. Hence, all groups at nucleotide position –800 are at 100% and all reach 0% by position +300. Mantel-Cox log-rank statistical test between all pairs: not significant. f, Distribution of “Upstream” sites of TD breakpoints in BRCA1Δ/exon11 cells for each treatment group, relative to splice acceptor adjacent to RFP exon B. 100bp binned data.
Extended Data Figure 8
Extended Data Figure 8. Analysis of TD and HTGTS breakpoints
a, MH usage in HTGTS (+) end breakpoints for Tus/Ter-induced translocations from BRCA1Δ/exon11 cells treated with siLUC (655), siFANCM (612), siBRCA1 (548) or siBLM (633) or BRCA1fl/exon11 cells treated with siLUC control (636) siFANCM (658), siBRCA1 (403) or siBLM (405) or I-SceI-induced HTGTS breakpoints for BRCA1Δ/exon11 cells treated with siFANCM (all: 954; +: 506; –: 403). Breakpoints with insertions or with MH use>6 were not included in this analysis. Note that HTGTS breakpoints at Tus/Ter are MH skewed in comparison to HTGTS breakpoints at I-SceI. b, Comparison of distributions of Ter-proximal TD sites and HTGTS (+) end breakpoint distribution for BRCA1Δ/exon11 6xTer cells treated with siFANCM (679), siBRCA1 (630), or siBLM (724). Mantel-Cox log-rank test for TD vs. HTGTS: siFANCM, p<0.0001; siBRCA1, p<0.0001; siBLM, p<0.0001. Gehan-Breslow-Wilcoxon log-rank statistical test: siFANCM TD vs. HTGTS, p<0.0001; siBRCA1 TD vs. HTGTS, p<0.0001; siBLM TD vs. HTGTS, p<0.0001. Right panel: distribution of Tus-induced HTGTS (+) end breakpoint distributions relative to the Ter array in BRCA1Δ/exon11 6xTer cells transfected with siLUC (786). Mantel-Cox log-rank test for HTGTS: siLUC vs. siFANCM, p=0.0171; siLUC vs. siBRCA1, p=0.0003; siLUC vs. siBLM, p<0.0001; siFANCM vs. siBRCA1, p=0.1528; siFANCM vs. siBLM, p=0.0017; siBLM vs. siBRCA1, p=0.1213. Gehan-Breslow-Wilcoxon log-rank test for HTGTS: siLUC vs. siFANCM, p=0.3108; siLUC vs. siBRCA1, p=0.0009; siLUC vs. siBLM, p<0.0001; siFANCM vs. siBRCA1, p=0.0166; siFANCM vs. siBLM, p<0.0001; siBLM vs. siBRCA1, p=0.0751. 6xTer array: grey-shaded region. Orange triangles: individual Ter sites within the 6xTer array. Nucleotide position 0 represents first nucleotide of first Ter site encountered by the rightward fork. For all BRCA1Δ/exon11 treatment groups and BRCA1fl/exon11 cells depleted of FANCM, each sample group represents pooled data from three independent biological replicates. For all other BRCA1fl/exon11 treatment groups, data shown is from two pooled biological replicates.
Extended Data Figure 9
Extended Data Figure 9. BRCA1 loss in ovarian and breast carcinomas is associated with wide-spread tandem duplications of ~10 kb (Group 1 TDs)
a, Analysis of 92 human ovarian carcinoma genomes (available through the Australian Ovarian Cancer Study, AOCS – URL: http://www.aocstudy.org) and 560 breast carcinoma (BC) genomes (available through the Wellcome Trust Sanger Institute – URL: http://cancer.sanger.ac.uk/cosmic), including 163 triple negative breast cancer (TNBC) genomes. For each dataset, samples are sorted on the x-axis based on increasing number of somatic TDs. y-axis: log10 of TD span (in kb) within each cancer genome, with median marked with circle. Samples featuring a TDP group 1 profile are indicated in orange. Abrogation of BRCA1 and BRCA2 (by germ line mutation, somatic mutation or promoter methylation), and of CDK12 (by somatic mutation) is noted according to key. b, Upper panel: exact numbers of samples analyzed for each dataset and each genetic/genomic subgroup indicated in boxes, with digits color-coded according to key in a. Orange boxes: Group 1 TDP. White boxes: not Group 1 TDP. The numbers comprise only samples for which the relevant genetic annotation is available. Bar charts show percentages of cancer samples with abrogation of BRCA1 (red) or BRCA2 (blue) among the two cancer subsets with or without a TDP group 1 profile; P values calculated by Fisher’s exact test. c, Percentages of cancer samples with (orange) or without (grey) a TDP group 1 profile among the entire datasets and the subsets of samples showing abrogation of BRCA1 (B1m) or BRCA2 (B2m); P values calculated by probability mass function.
Extended Data Figure 10
Extended Data Figure 10. Down-regulation of BRCA1 expression is the most prominent and consistent transcriptional feature of ovarian and breast carcinomas associated with TDP group 1 profile
Box-plots comparing expression levels between cancer samples with (orange) or without (grey) a TDP group 1 profile, relative to nine DNA replication/DNA repair genes whose role as potential contributors to the wide-spread TD formation in cancer has been investigated or suggested. Numbers under each dataset represent number of cancers for which expression data is available. P values calculated by Student’s t-test.
Figure 1
Figure 1. BRCA1 suppresses Tus/Ter-induced GFPRFP+ repair products
a, 6xTer-HR reporter and HR products of Tus-Ter-induced fork stalling. Grey boxes: mutant GFP. Green box: wtGFP. Open circles A and B: 5′ and 3′ artificial RFP exons. 5′Tr-GFP: 5′-truncated GFP. Orange triangle: 6xTer array. Blue line: I-SceI restriction site. STGC/LTGC: short/long tract gene conversion outcomes. LTGC generates wtRFP through RNA splicing (red filled circles). b, Representative primary FACS data for BRCA1fl/exon11 and BRCA1Δ/exon11 6xTer-HR reporter cells co-transfected with wtTus and siLUC or siBRCA1. FACS plots produced from pooled data of duplicate samples from three independent experiments. Numbers represent percentages. See Extended Data Fig. 1 for additional primary data, quantitation and BRCA1 mRNA depletion. Red arrowhead: GFPRFP+ repair products in BRCA1Δ/exon11 cells depleted of BRCA1.
Figure 2
Figure 2. Tus/Ter-induced GFPRFP+ repair products are MH-mediated tandem duplications
a, STGC, LTGC and GFPRFP+ products. Elements as in Fig. 1a. Red half-arrows: primers for breakpoint PCR. B: BglII site. Southern blotting with GFP probe fragment sizes indicated. Grey hatched box: breakpoint of GFPRFP+ product. b, Analysis of GFPRFP+ repair products. Upper panels: Southern blots of Tus/Ter-induced STGC, LTGC and GFPRFP+ products in BRCA1Δ/exon11 6xTer-HR reporter cells. MW: molecular weight marker lane. Red asterisk: example of Class 1 GFPRFP+ repair product. Blue asterisk: example of Class 2 product. See Extended Data Fig. 2 for sequence analysis of these two clones. Lower panels: breakpoint PCR products. c, GFPRFP+ products are MH-mediated tandem duplications (TDs). Cartoons show typical Class 1 and Class 2 TDs. Elements as in Fig. 1a and Fig. 2a. Green line: TD breakpoint. For gel source data, see Supplementary Figure 1.
Figure 3
Figure 3. Candidate mechanisms of Tus/Ter-induced TDs
a, “Breakage-fusion” model. GFP elements not shown. Black lines: parental DNA. Blue lines: nascent strands of conventional replication. Half arrows: nascent strand 3′ ends. Scissors: Sites of fork breakage. Pink dashed arrow: fusion of broken sisters by end joining. b, “MMBIR” model. Red half arrow: repair synthesis during bubble migration. Other symbols as in a. c, “Replication restart-bypass” model. The leftward fork undergoes aberrant “replication restart”—for example, engaging a bubble migration mechanism, as shown. The rightward fork bypasses the leftward nascent strand and stalls at Tus/Ter. End joining (pink dashed arrow) completes the TD. Symbols as in a and b. d, Summary of predictions made by the three TD models.
Figure 4
Figure 4. A replicative mechanism involving C-NHEJ mediates Tus/Ter-induced TDs
a, Aneuploidy induced by 30 μM cytochalasin B (CB) during TD induction. b, Analysis of Tus/Ter-induced TDs in BRCA1Δ/exon11 siFANCM-treated, CB-induced aneuploid clones. Upper panel: Southern blot of gDNA (AseI digest, GFP probe); cartoon indicates fragment sizes. Lanes 1–3, CB-treated TD clones that did not retain a second copy of the reporter; Lane 4, “parental” reporter marks migration of unrearranged reporter; Lanes 5–11, CB-treated TD clones that retained a second copy of the reporter, which co-migrates with parental reporter in all cases. Lower panel: Breakpoint PCR products. c, Tus/Ter-induced TDs in XRCC4fl/fl and XRCC4Δ/Δ ROSA26-targeted 6xTer-HR reporter independent ES cell clones, co-transfected with siRNAs shown. Mean of duplicate samples from nine independent experiments (n=9). Error bars: s.e.m. t-test P values: siFANCM+siBRCA1 vs. any other treatment group within individual clones: <10E-4 (#8 and #39); <0.02 (#11 and #13). siFANCM+siBRCA1 comparisons between any XRCC4fl/fl and any XRCC4Δ/Δ clone: ≤2x10E-4. All other comparisons of same treatment groups between clones: NS. d, Confirmation of genotype of XRCC4fl/fl and XRCC4Δ/Δ clones. Grey boxes: XRCC4 exons. Black triangles: loxP sites. PCR analysis of gDNA using the primer pairs indicated. e, Tus/Ter-induced TDs in XRCC4Δ/Δ #11 transduced with pHIV-EV (empty vector control) or pHIV-mXRCC4 and selected in nourseothricin, co-transfected with siRNAs shown. Mean of duplicates, n=9. Error bars: s.e.m. t-test P values (both pHIV-EV- and pHIV-mXRCC4-transduced cells): siFANCM+siBRCA1 vs. siLUC, siFANCM or siBRCA1: <0.02. siBLM+siBRCA1 vs. siLUC, siBLM or siBRCA1: <0.02. siFANCM+siBRCA1 vs. siBLM+siBRCA1: NS. pHIV-EV vs. pHIV-mXRCC4 siFANCM+siBRCA1: 0.028; siBLM+siBRCA1: 0.047. f, XRCC4 immunoblot in XRCC4fl/fl, XRCC4Δ/Δ cells, and transduced XRCC4Δ/Δ cells as shown. P: parental clone #11. For gel source data, see Supplementary Figure 1. For mRNA quantitation, see Extended Data Figs. 6f and 6g.
Figure 5
Figure 5. Solitary DNA ends form at Tus/Ter-stalled forks
CRISPR/Cas9 induces “bait” DSB ~30 kb from 6xTer array + I-SceI site at ROSA26. a, I-SceI-induced two-ended DSB produces balanced (+) and (–) ends in HTGTS. Half-arrow: HTGTS sequencing primer. Weighted black line: duplex DNA. b, Focused rightward fork breakage produces (+) orientation DNA ends in HTGTS. c, Alternatively, solitary (+) DNA end forms via regression of rightward fork. Thus, stalled rightward forks generate (+) ends, irrespective of mechanism. Stalled leftward forks (not shown) generate (–) ends. d, HTGTS breakpoints in FANCM-depleted BRCA1Δ/exon11 cells harboring a single ROSA26-targeted 6xTer-I-SceI-GFP cassette. Grey area/orange triangles: 6xTer-array. I-SceI-induced DSBs produce expected symmetrical pattern in HTGTS. Tus/Ter-induces asymmetrical pattern with (+) ends ≫ (–) ends, indicating presence of solitary DNA ends. Note virtual absence of signal in EV controls. Maps represent pooled data from two (I-SceI), three (Tus), or two (EV) independent replicates. e, Tus/Ter-induced HTGTS in BRCA1fl/exon11 or BRCA1Δ/exon11 cells receiving siRNAs shown. For all BRCA1Δ/exon11 groups and for BRCA1fl/exon11 cells depleted of FANCM, data pooled from three independent replicates. All other BRCA1fl/exon11 groups, data pooled from two independent replicates.

References

    1. Zeman MK, Cimprich KA. Causes and consequences of replication stress. Nat Cell Biol. 2014;16:2–9. doi: 10.1038/ncb2897. - DOI - PMC - PubMed
    1. Duxin JP, Walter JC. What is the DNA repair defect underlying Fanconi anemia? Current opinion in cell biology. 2015;37:49–60. doi: 10.1016/j.ceb.2015.09.002. - DOI - PMC - PubMed
    1. D’Andrea AD. Susceptibility pathways in Fanconi’s anemia and breast cancer. The New England journal of medicine. 2010;362:1909–1919. - PMC - PubMed
    1. Ciccia A, Elledge SJ. The DNA damage response: making it safe to play with knives. Mol Cell. 2010;40:179–204. doi: 10.1016/j.molcel.2010.09.019. S1097-2765(10)00747-1 [pii] - DOI - PMC - PubMed
    1. Garcia-Muse T, Aguilera A. Transcription-replication conflicts: how they occur and how they are resolved. Nat Rev Mol Cell Biol. 2016 doi: 10.1038/nrm.2016.88. - DOI - PubMed

Publication types