. 2017 Nov 30;551(7682):639-643.
doi: 10.1038/nature24637. Epub 2017 Nov 22.

NFS1 undergoes positive selection in lung tumours and protects cells from ferroptosis

Affiliations

NFS1 undergoes positive selection in lung tumours and protects cells from ferroptosis

Samantha W Alvarez et al. Nature. .

Erratum in

Abstract

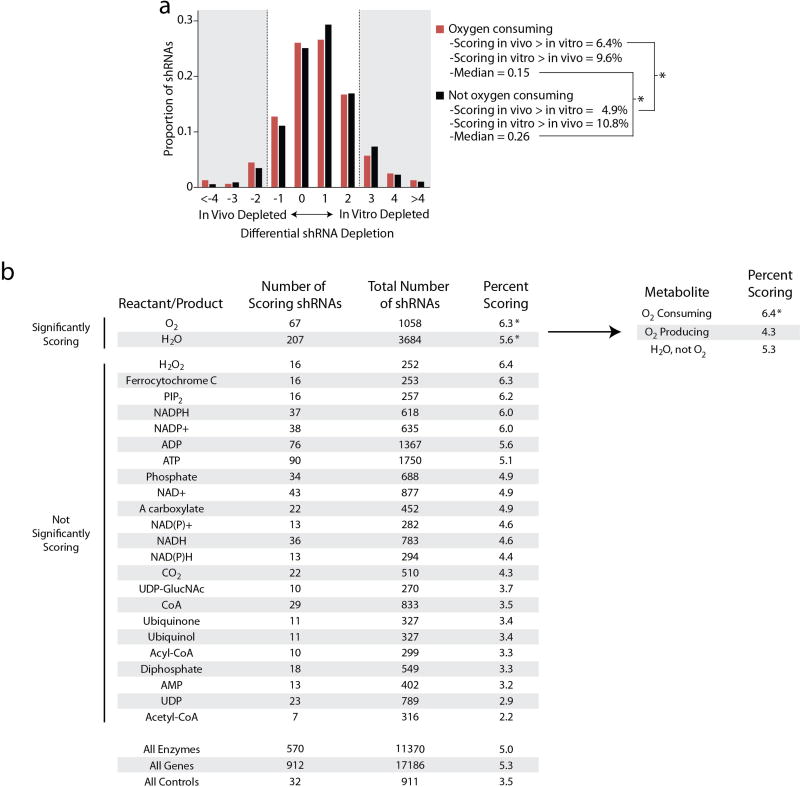
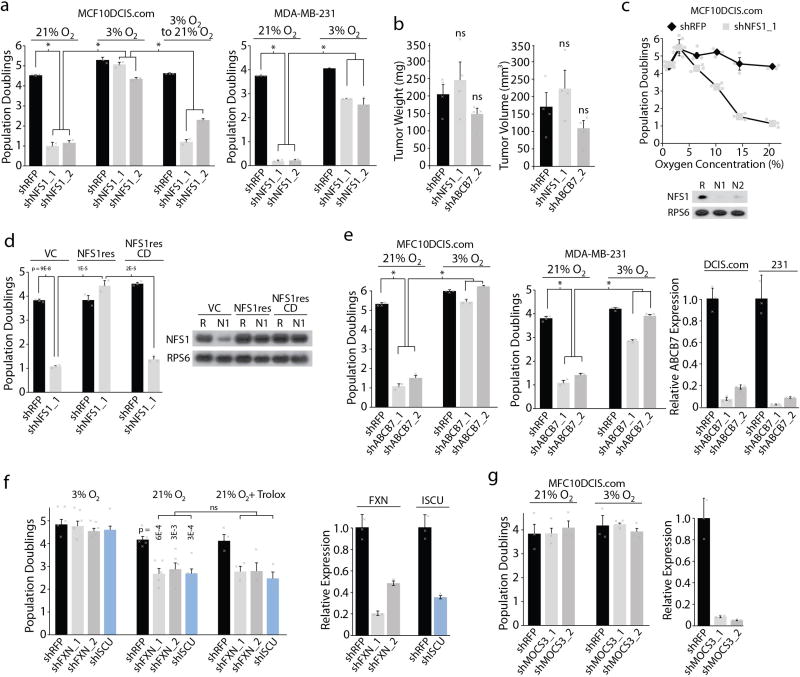
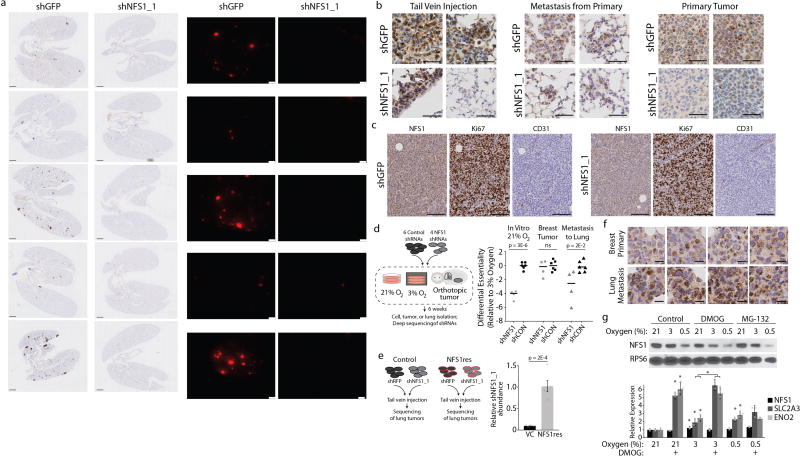
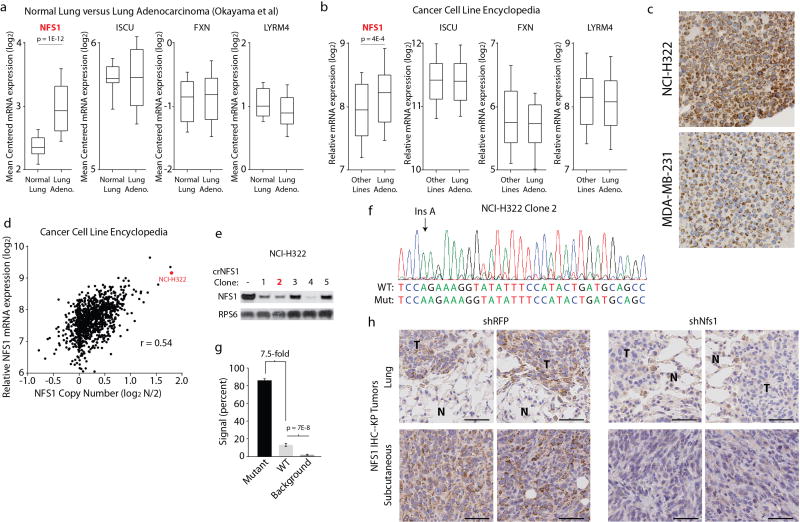
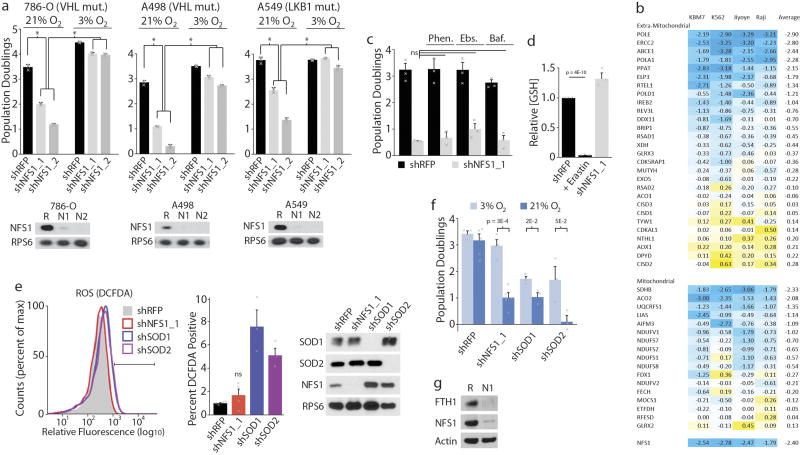
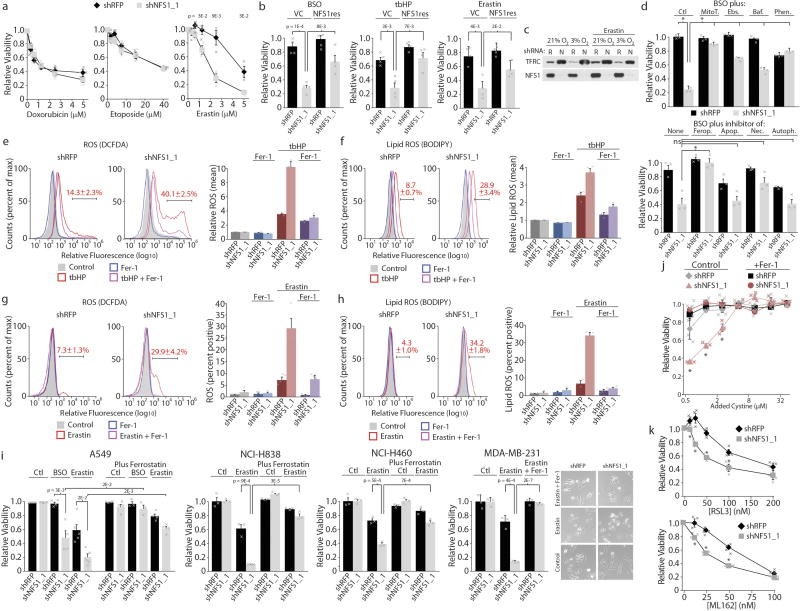
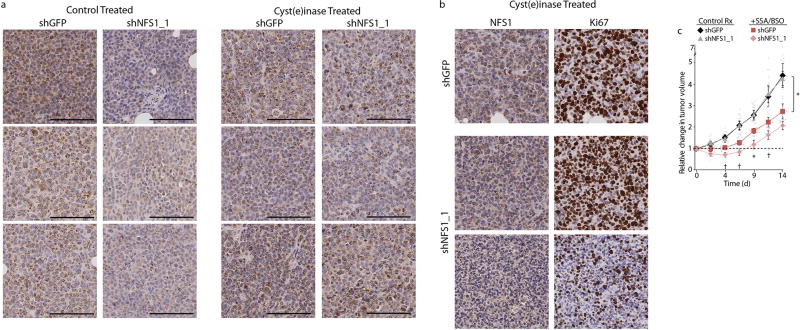
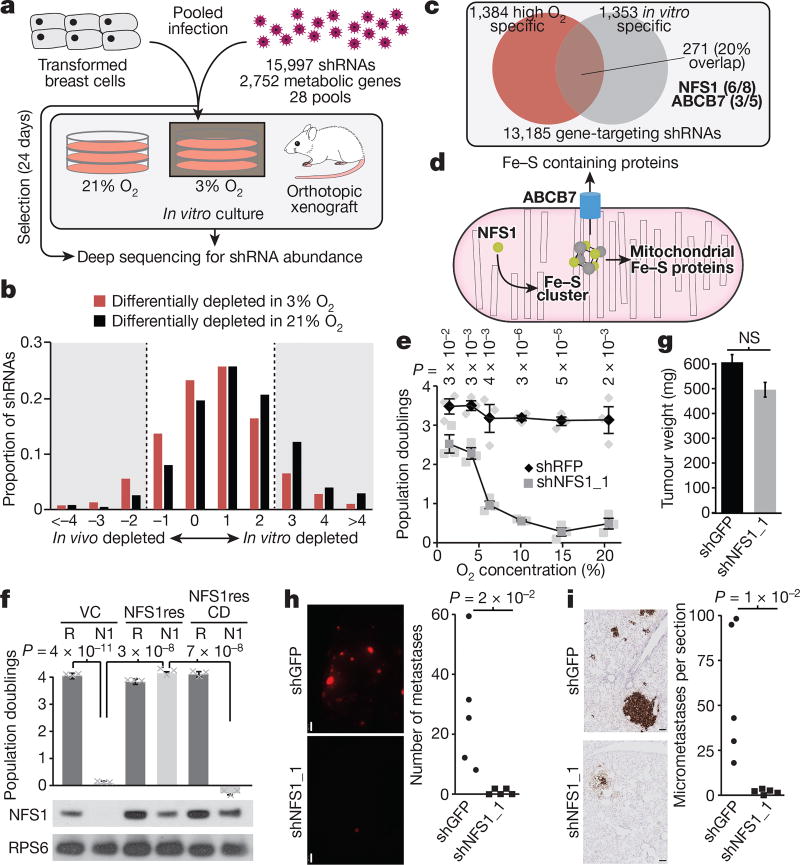
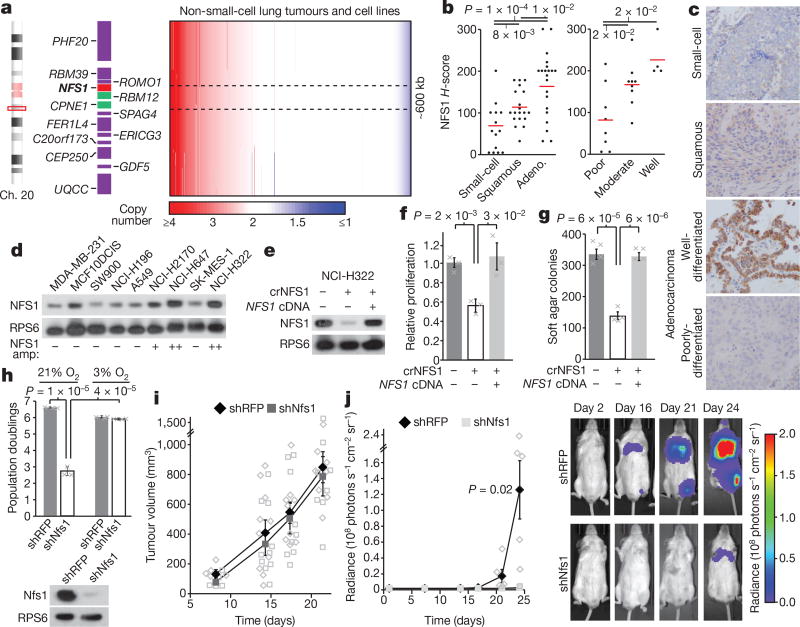
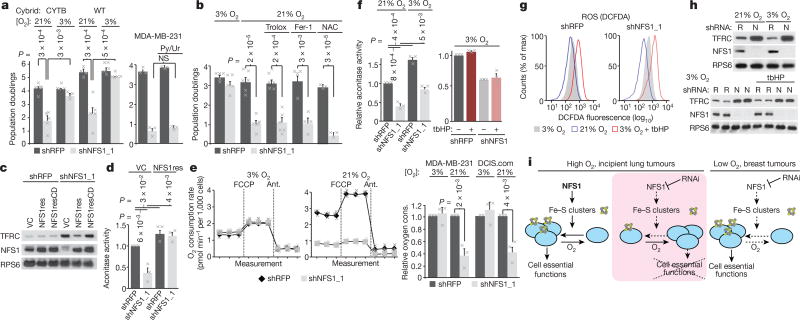
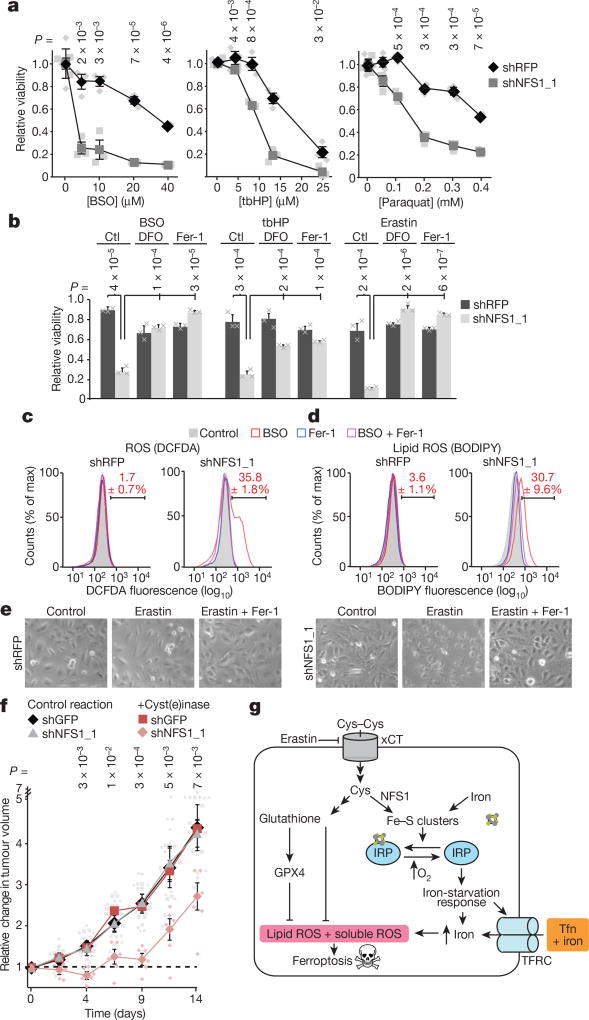
Environmental nutrient levels impact cancer cell metabolism, resulting in context-dependent gene essentiality. Here, using loss-of-function screening based on RNA interference, we show that environmental oxygen levels are a major driver of differential essentiality between in vitro model systems and in vivo tumours. Above the 3-8% oxygen concentration typical of most tissues, we find that cancer cells depend on high levels of the iron-sulfur cluster biosynthetic enzyme NFS1. Mammary or subcutaneous tumours grow despite suppression of NFS1, whereas metastatic or primary lung tumours do not. Consistent with a role in surviving the high oxygen environment of incipient lung tumours, NFS1 lies in a region of genomic amplification present in lung adenocarcinoma and is most highly expressed in well-differentiated adenocarcinomas. NFS1 activity is particularly important for maintaining the iron-sulfur co-factors present in multiple cell-essential proteins upon exposure to oxygen compared to other forms of oxidative damage. Furthermore, insufficient iron-sulfur cluster maintenance robustly activates the iron-starvation response and, in combination with inhibition of glutathione biosynthesis, triggers ferroptosis, a non-apoptotic form of cell death. Suppression of NFS1 cooperates with inhibition of cysteine transport to trigger ferroptosis in vitro and slow tumour growth. Therefore, lung adenocarcinomas select for expression of a pathway that confers resistance to high oxygen tension and protects cells from undergoing ferroptosis in response to oxidative damage.


Figures

Extended Data Figure 1
Extended Data Figure 1. Analysis of screening results by reaction reactants and products
a, Histogram of shRNA depletion scores. shRNAs (11,370) were scored based on their differential abundance in the in vitro and in vivo screens. shRNAs were further subdivided into those which targeted enzymes that consume O2 (red, 1,035 shRNAs) and to those targeting other genes (black, 10,335 shRNAs). Bin size = 1 log2 fold change unit with the upper end of the range indicated on the x axis. The shRNAs in the shaded region are scored, and the percentage of these shRNAs falling in the indicated categories and the median of the entire distribution are reported. b, Enzymes were classified based on whether they catalysed reactions involving specific metabolites, and the most commonly used 25 metabolites are reported. The number of shRNAs differentially depleted in vivo versus in vitro with a log2 fold change cut-off > 2 are reported (scoring shRNAs), as are the total number of shRNAs targeting enzymes in each category. The percentage of scoring shRNAs for each metabolite is reported, and those significantly exceeding the percentage scoring in ‘all enzymes’ or ‘all genes’ classes are indicated. O2 and water classes were further subdivided (top right) to indicate that shRNAs targeting O2-consuming enzymes were significantly enriched, whereas shRNAs targeting O2 producing reactions or reactions that utilize water but do not consume O2 were not significantly enriched. * P < 0.05, Fisher’s exact test. Raw data are reported in Supplementary Table 2.
Extended Data Figure 2
Extended Data Figure 2. Core components of the ISC machinery exhibit differential requirements, dependent on O2 concentration
a, Five-day proliferation assays of the indicated cell lines upon introduction of shRFP (black) or shRNAs targeting NFS1 (shNFS1_1 or shNFS1_2, grey) at the indicated O2 concentrations. Data are from three biological replicates. Significant P values (asterisks) are as follows: MCF10DCIS.com bar 1 versus bar 2, 5 × 10⁻⁶; bar 1 versus bar 3, 9 × 10⁻⁷; bar 2 versus bar 5, 5 × 10⁻⁶; bar 3 versus bar 6, 2 × 10⁻⁶; bar 5 versus bar 8, 2 × 10⁻⁶; bar 6 versus bar 9, 3 × 10⁻⁶; MDA-MB-231 (right) bar 1 versus bar 2, 5 × 10⁻⁸; bar 1 versus bar 3, 3 × 10⁻⁸; bar 2 versus bar 5, 1 × 10⁻⁷; bar 3 versus bar 6, 9 × 10⁻⁵. b, Weight or volume of orthotopic tumour xenografts derived from MCF10DCIS.com cells expressing shRFP, shNFS1_1, or shRNA targeting ABCB7 (shABCB7_2), 4 weeks of growth. Data are from four independent biological replicates. ns, not significant. c, Five-day proliferation assays of MCF10DCIS.com cells expressing shRFP (black) or shNFS1_1 (grey) (top). Data are from three independent biological triplicates. Immunoblots of NFS1 and RPS6 (bottom). Images are representative of three experiments. Significant P values (asterisks) are as follows: 6% O2, 2 × 10⁻²; 10% O2, 4 × 10⁻⁵; 14.5% O2, 3 × 10⁻⁴; 21% O2, 5 × 10⁻⁶. d, Five-day proliferation assays at atmospheric O2, MCF10DCIS.com cells stably transduced with vector control (VC), NFS1 cDNA (NFS1res), or catalytically inactive mutant cDNA (NFS1resCD) (left). Immunoblots of NFS1 and RPS6 upon introduction of shRFP (R) or shNFS1_1 (N1), right. Data are from three independent biological replicates. e, Five-day proliferation assays as in a upon introduction of shRFP or shRNAs targeting ABCB7 (shABCB7_1, shABCB7_2) (left, centre).* , Significant P values: MCF10DCIS.com bar 1 versus bar 2, 1 × 10⁻⁷; bar 1 versus bar 3, 5 × 10⁻⁷; bar 2 versus bar 5, 4 × 10⁻⁷; bar 3 versus bar 6, 2 × 10⁻⁷; MDA-MB-231 bar 1 versus bar 2, 3 × 10⁻⁶; bar 1 versus bar 3, 3 × 10⁻⁶; bar 2 versus bar 5, 7 × 10⁻⁶; bar 3 versus bar 6, 1 × 10⁻⁶. ABCB7 mRNA levels normalized to ACTB mRNA and relative to shRFP, (right). Data are from three independent biological replicates. f, Five-day proliferation assays of MCF10DCIS.com cells upon introduction of shRFP (black) or shRNAs targeting FXN (shFXN_1 or shFXN_2, grey) or ISCU (shISCU, blue) at the indicated O2 concentrations or upon addition of the antioxidant trolox (100 µM). Data are from three independent biological triplicates (left). FXN or ISCU mRNA levels normalized to ACTB mRNA and relative to shRFP (right). g, Proliferation assay (left, data from three independent biological triplicates) and mRNA levels (right, data from three independent biological replicates) as in d upon introduction of RFP (shRFP, black), or shRNAs targeting MOCS3 (shMOCS3_1 or shMOCS3_2). MOCS3 is an enzyme essential for molybdenum co-factor biosynthesis, a process in which NFS1 has been proposed to play a critical role independent of ISC biosynthesis. a–g Data are mean ± s.e.m., P values obtained by heteroscedastic two-sided t-test.
Extended Data Figure 3
Extended Data Figure 3. NFS1 is required for breast cancer cell metastasis to the lung
a, Lung sections stained by immunohistochemistry for tdTomato (left) and whole-mount immunofluorescence (right) from samples analysed in Fig. 1h, i. Sections stained for tdTomato (RFP) show low power images of entire coronal lung sections. Whole-mount immunofluorescence shows tdTomato positive tumours (pseudocoloured red) in the right lung lobe. Images are paired, the lung sections from panels on the left match the whole-mount images on the right. Samples express shGFP or shNFS1_1 in each column, as indicated, collected 6 week post-injection, via tail vein, with MDA-MB-231 cells expressing tdTomato and the indicated shRNAs. Scale bars, 1 mm. Entire experiment repeated three times with similar results. b, Representative histology of tumours stained for NFS1, initiated in the lung either by tail vein injection in the same manner as a (left, representative of five independent biological replicates) or as metastases from primary mammary tumours (middle, representative of ten independent biological replicates), or in the mammary fat pad as xenografts (right, representative of ten independent biological replicates). Two images for each group are shown to reflect heterogeneity in NFS1 staining. Tumours were initiated from MDA-MB-231 cells expressing shGFP or shNFS1_1 and tissue was harvested 6–8 weeks after injection or implantation. Primary tumours derived from cells expressing shNFS1_1 display a clear reduction in NFS1 levels, whereas lung metastases derived from these cells can display low, moderate, or strong NFS1 staining. Scale bars, 50 µm. c, Histology of primary tumours initiated in the mammary fat pad as in b and stained for NFS1, the proliferation marker Ki67, or the endothelial marker CD31. Images are representative of ten independent biological replicates. Differences in Ki67 staining or CD31 density were not observed. Scale bars, 100 µm. d, Competition assay using six control (shCON) and four NFS1-targeting shRNAs in small pools in MDA-MB-231 cells. Differential abundance of each shRNA is reported relative to the 3% O2 condition. Black bar is population mean. Tumour formation, data are from ten independent biological replicates; lung metastases, data are from five independent biological replicates; in vitro cultures, data are from three independent biological replicates. e, Competition assay of MDA-MB-231 cells expressing a control vector or NFS1res, and subsequently transduced with either shRFP or shNFS1_1. Data are from five independent biological replicates. f, Histology of primary mammary tumours and paired lung metastases, stained for NFS1, images are representative of eight independent biological replicates. Tumours were initiated by injecting MDA-MB-231 cells orthotopically in the mammary fat pad and harvested 8 weeks after injection. Scale bars, 25 µm. g, Immunoblot (top) or relative mRNA abundance (bottom) of lysates from MDA-MB-231 cells grown at the indicated O2 concentration and with no treatment (control), dimethyloxalylglycine (DMOG, 1 mM, 24 h) or the proteasome inhibitor MG-132 (10 µM, 2 h). Significant P values (asterisks) are as follows: bar 2 versus bar 5, 1 × 10⁻⁵; bar 3 versus bar 6, 2 × 10⁻⁴; bar 1 versus bar 4, 3 × 10⁻²; bar 2 versus bar 5, 7 × 10⁻³; bar 3 versus bar 6, 1 × 10⁻³; bar 8 versus bar 11, 4 × 10⁻⁴; bar 9 versus bar 12, 2 × 10⁻³; bar 2 versus bar 14 2 × 10⁻⁴; bar 3 versus bar 15, 1 × 10⁻³. Immunoblots are representative of three replicates and show the level of NFS1, which is dependent on O2 concentration in a manner independent of prolyl hydroxylase or proteasomal inhibition, compared to RPS6. Relative mRNA abundance determined by qPCR and normalized to RPL13A, demonstrates that NFS1 mRNA levels (black bars) are not impacted by changes in O2 level or prolyl hydroxylase inhibition, in contrast to known hypoxia-inducible factor target genes (SLC2A3 and ENO2, grey bars). Data are from three biologically independent experiments. e, g, Data are mean ± s.e.m. d, e, g P values obtained by two-sided heteroscedastic Student’s t-tests.
Extended Data Figure 4
Extended Data Figure 4. NFS1 activation in lung adenocarcinoma
a, Expression (mRNA) of the indicated genes in normal lung (n = 20) versus lung adenocarcinoma (n = 226) from Okayama et al.. b, Expression (mRNA) of the indicated genes in lung adenocarcinoma cell lines (n = 96) versus all other cell lines (n = 914) from the Cancer Cell Line Encyclopedia. a, b, Box plots indicate the 75th, 50th, and 25th percentile, whiskers are 90th and 10th percentile. c, Immunohistochemical staining for NFS1 (dark brown) of NCI-H322 and MDA-MB-231 cells embedded and fixed using the same protocol as in Fig. 2b, c. Replicated in triplicate with similar results. d, Copy number (log2 N/2) versus expression (log2 mRNA level) for NFS1 of cell lines from the Cancer Cell Line Encyclopedia (n = 1,010). The NCI-H322 data point is indicated in red. r denotes Pearson’s correlation coefficient. e, Immunoblots for NFS1 or RPS6 in NCI-H322 crNFS1 clones. Clone 2 (red) was selected for further experiments. Immunoblots repeated in triplicate with similar results. f, Sanger sequencing trace of the crNFS1 cut site for clone 2. Red denotes T, green denotes A, blue denotes C, black denotes G. Wild-type and mutant sequence resulting from an insertion of an A at the indicated site are provided below the trace. g, Quantification of the Sanger sequencing trace in f indicating the percentage of wild-type or mutant signal at each base, n = 22 base positions assessed. h, Immunohistochemical staining for NFS1 (dark brown) of lung sections (shRFP n = 5, shNfs1 n = 4 independent biological replicates, representative images shown) or subcutaneous tumours (n = 5 independent biological replicates, representative images shown) derived from KP cells used in the experiment described in Fig. 2i, j. T, tumour. N, normal. Scale bars, 50 µm. g, Data are mean ± s.e.m. a, b, g, P values obtained using two-sided heteroscedastic Student’s t-tests.
Extended Data Figure 5
Extended Data Figure 5. Interplay between NFS1 modulation, reactive oxygen species, and hypoxic responses
a, Von Hippel Lindau (VHL) and liver kinase B1 (LKB1, also known as STK11) tumour suppressors mediate the cellular response to hypoxia,. VHL-null (786-O, left and A498, middle) or LKB1-null (A549, right) cell lines exhibited sensitivity to NFS1 suppression in 21% O2 that culture in 3% O2 rescued, five-day proliferation assays upon introduction of shRFP (black), shNFS1_1 or shNFS1_2 (both grey) (top). Immunoblots for NFS1 or RPS6 upon introduction of shRFP (R), shNFS1_1 (N1) or shNFS1_2 (N2) (bottom). Data are from three independent biological replicates. b, Published viability scores for known ISC containing genes in the indicated cell lines. Negative scores (blue colour) indicate cell essential genes. NFS1 shown for reference. c, Five-day proliferation assays (at 3% O2) of MDA-MB-231 cells expressing shRFP (black) or shNFS1_1 (grey) upon treatment with the Fe2+ chelator 1,10-phenanthroline (Phen., 1.5 µM), the antioxidant ebselen (Ebs., 2.5 µM), or the lysosomal ATPase inhibitor bafilomycin (Baf., 400 pM). Because iron release from transferrin receptor and ferritin require lysosomal acidification, low dose bafilomycin is expected to reduce the labile iron pool. Data are from three independent biological triplicates. d, Relative reduced glutathione levels in cells expressing shNFS1_1 or with overnight treatment with erastin (5 µM) relative to cells expressing shRFP. Data are from three independent biological duplicates. e, Relative fluorescence (flow cytometry), MDA-MB-231 cells stained with DCFDA and expressing shRFP, shNFS1_1 or shRNAs targeting SOD1 (shSOD1) or SOD2 (shSOD2) (left). Bar indicates cut-off used for identifying cells exhibiting increased DCFDA fluorescence. Trace is representative of three experiments. Quantification of DCFDA-positive cells indicated (left). Data are from three (shSOD1, shSOD2) or four (shNFS1_1, shRFP) independent biological replicates. Immunoblots of SOD1, SOD2, NFS1 or RPS6 upon introduction of the indicated shRNAs (right). Immunoblots repeated in triplicate with similar results. f, Five-day proliferation assays of MDA-MB-231 cells upon introduction of shRFP (3% O2 n = 4, 21% O2 n = 5), shNFS1_1 (3% O2 n = 4, 21% O2 n = 5), shSOD1 (n = 3) or shSOD2 (n = 3) at the indicated O2 concentrations. n indicates independent biological triplicates. g, Immunoblots for FTH1, NFS1, or β -actin upon introduction of the indicated shRNAs, MDA-MB-231 cells, 3% O2. Immunoblots repeated in triplicate with similar results. a, c–f, Data are mean ± s.e.m., P values obtained using two-sided heteroscedastic Student’s t-tests.
Extended Data Figure 6
Extended Data Figure 6. Additional model systems demonstrating that NFS1 suppression sensitizes cells to ferroptosis versus other forms of cell death
a, Relative viability, MDA-MB-231 cells, expressing shRFP or shNFS1_1 upon treatment with doxorubicin (left), etoposide (middle) or erastin (right), 3% O2. Data are from three independent biological triplicates. b, Viability, relative to untreated, of MDA-MB-231 cells stably transduced with control vector or NFS1res, expressing the indicated shRNAs, treated with BSO (5 µM), tbHP (10 µM), or erastin (2.5 µM). Data are from four independent biological triplicates. c, Immunoblots, MDA-MB-231 cells expressing shRFP (R) or shNFS1_1 (N), erastin 5 µM, 24 h treatment. Immunoblots repeated in triplicate with similar results. d, Viability after 2 days, relative to untreated cells, of MDA-MB-231 cells expressing the indicated shRNAs. Cells were cultured at 3% O2 and treated with BSO (10 µM) combined with mitochondrially targeted antioxidant mitoTEMPO (MitoT., 2 µM), Phen. (5 µM), Ebs. (7.5 µM) or Baf. (800 pM) (top) or BSO (5 µM) combined with Fer-1 (Ferop., 1 µM), apoptosis inhibitor Z-VAD-FMK (Apop., 184 µM), necrosis inhibitor necrostatin (Nec., 9.7 µM), or autophagy inhibitor 3-methyladenine (Autoph., 6.25 mM) (bottom). Significant P values (asterisks): (top) bar 1 versus bar 2, 4 × 10⁻⁶; bar 2 versus bar 4, 3 × 10⁻⁶; bar 2 versus bar 6, 6 × 10⁻⁵; bar 2 versus bar 8, 9 × 10⁻⁴; bar 2 versus bar 10, 7 × 10⁻⁶; (bottom) bar 2 versus bar 4, 4 × 10⁻³. Data are from three independent biological triplicates. e, f, Relative fluorescence (flow cytometry), MDA-MB-231 cells stained with DCFDA (e, left) or BODIPY (f, left) expressing shRFP or shNFS1_1 and treated with tbHP (50 µM), Fer-1 (1 µM) or both for four hours. Bar indicates cut-off used for identifying DCFDA or BODIPY positive cells, reported in red text. Traces are representative of triplicate experiments. Quantification of mean fluorescence, relative to untreated, (e, right and f, right). Data are from three independent biological replicates. g, h, As in e, f but treatment with erastin (5 µM), Fer-1 (1 µM) or both for 20 h. Traces are representative, data are from experiments performed in quadruplicate (g) or triplicate (h). i, Relative viability at 3% O2 of cell lines expressing indicated shRNAs and treated with BSO (20 µM), erastin (5 µM, MDA-MB-231 or A549; 10 µM NCI-H838 or NCI-H460), and/or Fer-1 (1 µM). NCI-838 and NCI-H460, data are from three independent biological replicates; MDA-MB-231, data are from three independent biological triplicates; A549, n = 5, 5, 4, 4, 5, 5, 4, 4, 3, 3, 4 and 4 for each bar from left to right, independent biological triplicates. Representative images, MDA-MB-231 cells (right). j, Relative viability of MDA-MB-231 cells expressing the indicated shRNAs relative to 50 µM added cystine (typical human plasma levels). Cells were cultured at 3% O2 in complete medium before switching to medium containing the indicated level of cystine added to base medium (RPMI lacking cystine with 10% serum, non-dialysed). x axis is log2 scale, data are from three independent biological replicates. Significant P values (asterisks) are as follows: (left to right) 3 × 10⁻², 9 × 10⁻⁵, 2 × 10⁻². k, Relative viability of MDA-MB-231 cells expressing the indicated shRNAs upon treatment with GPX4 inhibitors RSL3 (top, 20 h) or ML162 (bottom, 48 h), 3% O2. Data are from three independent biological triplicates. Significant P values (asterisks) are as follows: (left to right, top) 4 × 10⁻², 8 × 10⁻³, 2 × 10⁻³, 3 × 10⁻², (left to right, bottom) 1 × 10⁻², 6 × 10⁻⁴, 3 × 10⁻³. a, b, d–k, Data are mean ± s.e.m. a, b, d, i–k, P values obtained using two-sided heteroscedastic Student’s t-tests.
Extended Data Figure 7
Extended Data Figure 7. Effects of NFS1 suppression on tumours in animals given treatments altering cystine metabolism
a, Representative histology of six independent tumours in each group from samples reported in Fig. 4f and stained for NFS1 (brown). Control, left two columns; cyst(e) inase, right two columns. Three representative tumours (in columns) are shown to reflect heterogeneity in staining. Tumours expressing shGFP and shNFS1_1 harvested from the same animal and stained on the same slide. Tumours derived from cells expressing shNFS1_1 display a reduction in NFS1 levels in the control treatment group, whereas tumours derived from cells expressing shNFS1_1 in mice treated with cyst(e)inase display NFS1 staining similar to shGFP tumours, consistent with cyst(e)inase treatment selecting for NFS1-expressing cells. Scale bars, 100 µm. b, Representative histology of a single MDA-MB-231-derived tumour pair (shGFP versus shNFS1_1) from an animal treated with cyst(e)inase as in a. The shNFS1_1-expressing tumour from this pair exhibited the strongest regression upon cyst(e)inase treatment and the least overall tumour growth. Staining for NFS1 (left column) or Ki67 (right column) revealed a clearly delineated region of elevated NFS1 and Ki67 staining (middle), similar to the control tumour expressing shGFP (top), when compared to a separate region of low NFS1 and Ki67 staining (bottom). Scale bars, 100 µm. c, Growth of six independent biological replicate xenograft tumours in each group, derived from MDA-MB-231 cells expressing shGFP or shNFS1_1. Upon formation of palpable tumours (day 0), mice were treated by daily injection of SSA (250 mg kg−1) and BSO via drinking water (20 mM). Change in tumour volume relative to day 0 reported. Data from untreated tumours identical to Fig. 4f. Significant P values (asterisks) are as follows: shGFP control treatment versus the shGFP SSA/BSO treatment, 5 × 10⁻³ (day 4), 5 × 10⁻³ (day 7), 3 × 10⁻² (day 9), 5 × 10⁻² (day 11), 2 × 10⁻² (day 14); shGFP SSA/BSO treatment versus shNFS1 SSA/BSO treatment, 5 × 10⁻² (day 4), 7 × 10⁻² (day 7), 2 × 10⁻² (day 9), 6 × 10⁻² (day 11). Data are mean ± s.e.m., P values obtained using two-sided heteroscedastic Student’s t-tests.
Figure 1
Figure 1. The requirement for NFS1 is strongly dependent on environmental oxygen concentration
a, Schematic of the overall experimental methodology. b, Depletion score histogram. shRNAs are divided into low O2 depleted (red), or high O2 depleted (black). Bin-range upper bounds are indicated. For shRNAs differentially depleted in 3% O2, 7.7% scored higher in vivo than in vitro, and 10.5% scored higher in vitro than in vivo, the median score was 0.17. For shRNAs differentially depleted in 21% O2, 3.8% scored higher in vivo than in vitro, and 19.6% scored higher in vitro than in vivo, the median score was 0.66. c, Venn diagram of shRNAs with improved viability scores in low O2 (red) or animals (grey). d, Schematic of the ISC biosynthesis process. e, Five-day proliferation assay of MDA-MB-231 cells stably transduced with shRNAs targeting NFS1 (shNFS1_1) or RFP (shRFP) as a control. Data are mean ± s.e.m. from three independent biological triplicates. f, Five-day proliferation assay at atmospheric O2 of MDA-MB-231 stably transduced with either shRFP (R) or shNFS1_1 (N1) and either a vector control (VC), resistant NFS1 cDNA (NFS1res) or catalytically inactive mutant cDNA (NFS1resCD) (top). Data are mean ± s.e.m. from three independent biological replicates. Immunoblots for NFS1 (ribosomal protein S6 (RPS6) included for comparison), images are representative of three replicates (bottom). g, Tumour xenograft weight at 4 weeks, cells transduced as in e but with shRNAs targeting GFP (shGFP) as the control. Data are mean ± s.e.m., n = 25. h, Representative whole mount immunofluorescence of lung lobes (left) and metastasis quantification (right), 6 weeks after tail vein injection with cells transduced as in g. Scale bars, 1 mm. i, Sections from h, tdTomato stain (brown) (left) and quantification of micrometastases per section (right). Scale bars, 100 µm. Quantification data in h and i are from five independent biological replicates, entire experiment repeated three times with similar results. e–f, P values obtained by heteroscedastic two-sided t-test. NS, not significant.
Figure 2
Figure 2. NFS1 is under positive selection in lung adenocarcinoma and required for lung tumour formation
a, Non-small-cell lung cancer tumours (n = 628) and cell line (n = 105) copy number, chromosome 20 region, ordered by NFS1 copy number. Minimally amplified region, black dotted line. b, H-scores, NFS1 immunohistochemistry (IHC) in different human tumour types (15 small-cell, 19 squamous cell, and 21 adenocarcinoma) (left), and in variably differentiated adenocarcinomas (8 poor-, 9 moderate- and 4 well-differentiated) (right). c, Representative IHC from b, single stain. d, e, Immunoblots of NFS1 in various cancer cell lines (d) or in NCI-H322 and NCI-H322 crNFS1 with or without NFS1 cDNA (e). In d, NFS1 amplification estimates (NFS1 amp) are indicated below the blots. Images are representative of three experiments. f, g, Five-day proliferation assay (f) and soft agar colony formation (> 150 µm2) after 3–4 weeks (g) of NCI-H322 and NCI-H322 crNFS1 with or without NFS1 cDNA. Data in f are from three independent biological triplicates, data in g are from four. h, Five-day proliferation assays of KP mouse lung tumour cells expressing shRFP or shRNAs targeting Nfs1 (shNfs1) (top), data are from three independent biological replicates. Immunoblots of Nfs1, representative of three experiments (bottom). i, KP subcutaneous tumour volume, data are from 5, 10, 9 and 8 independent tumours on each successive day. j, Average radiance over time in mouse lungs after intratracheal instillation of KP cells from h (left). shRFP, n = 5; shNfs1, n = 4 independent animals. IVIS imaging of representative mice (group median) from indicated days (right). b, f–j, Data are mean ± s.e.m., P values obtained by heteroscedastic two-sided t-test.
Figure 3
Figure 3. Suppression of NFS1 limits iron–sulfur cluster availability specifically in elevated O2 conditions
a, Five-day proliferation assays of CYTB and wild-type (WT) cells expressing shRFP or shNFS1_1 at 3% O2 (n = 5) or 21% O2 (n = 6) (left) and five-day proliferation assay of MDA-MB-231 expressing the same shRNAs with or without pyruvate and uridine treatment (Py/Ur, 1 mM pyruvate, 50 µg ml−1 uridine, n = 3) (right). b, Five-day proliferation assay, MDA-MB-231 cells, 3 or 21% O2 and with trolox (100 µM, n = 6), Fer-1 (1 µM, n = 4) or N-acetylcysteine (NAC, 750 µM, n = 3). c, Immunoblots of NFS1 and TFRC in MCF10DCIS.com cells stably transduced with either shRFP or shNFS1_1 and vector control (VC), NFS1res or NFS1resCD. d, Aconitase activity of MCF10DCIS.com cells, transduced as in c except without NFS1resCD, data are from three independent biological replicates. e, O2 consumption rate at 3% O2 (left) or 21% O2 (middle), baseline readings and after FCCP (1 µM) or antimycin (1 µM) treatment, MDA-MB-231 cells. Relative O2 consumption rate of shRFP and shNFS1_1 transduced MDA-MB-231 and MCF10DCIS.com (DCIS.com) cells under high and low O2 conditions (right). For all plots in e data are from three independent biological triplicates. f, Aconitase activity of shRFP- and shNFS1_1-transduced MCF10DCIS.com at 3 and 21% O2 (left) and at 3% O2 with tbHP treatment (4 h, 50 µM) (right). Data are from three independent biological replicates. g, Relative DCFDA fluorescence measured by flow cytometry, cells and treatments from f. Data are representative of three repeated experiments. h, Immunoblots of TFRC, NFS1, cells and treatments from f. i, Schematic representation of the proposed model. Under high O2 (left), ISCs are maintained in cell-essential proteins (blue circles) despite high turnover from O2 damage. Upon NFS1 suppression, ISC biosynthesis flux cannot overcome ISC turnover (middle), unless environmental O2 levels are low (right). a, b, d–f, Data are means ± s.e.m., P values obtained by heteroscedastic two-sided t-test.
Figure 4
Figure 4. Suppression of NFS1 predisposes cancer cells to ferroptosis
a, Relative viability (2 days, 3% O2) of MDA-MB-231 cells, expressing shRFP or shNFS1_1, treated with varying concentrations of BSO, tbHP or paraquat. Data are from three biologically independent replicates. b, Relative viability (2 days, 3% O2) of cells from a treated with BSO (5 µM), tbHP (10 µM) or erastin (2.5 µM) and deferoxamine (DFO, 100 µM), Fer-1 (1 µM) or no treatment control (ctl). Data are from three biologically independent triplicates. c, d, Relative DCFDA (c) or BODIPY (d) fluorescence measured by flow cytometry of MDA-MB-231 cells from a, after 48 h treatment with either BSO (20 µM), Fer-1 (1 µM) or both. Red text indicates the percentage ± s.e.m. cells in the bracketed region. Data are from three biological replicates. e, Representative images from triplicate experiments, overnight erastin (5 µM), Fer-1 (1 µM). f, MDA-MB-231 tumour growth. Once palpable (day 0), animals were treated every 3 days (50 mg kg−1 PEG-cyst(e)inase). Change in volume reported, caliper measurement. Data are from six independent replicate tumours. g, Schematic of the proposed model. NFS1 suppression results in loss of IRP ISCs, upregulation of iron-starvation response (increased transferrin receptor (TFRC), decreased ferritin), and increased free intracellular iron. High iron promotes ferroptosis by increasing lipid peroxidation. a, b, f, Data are mean ± s.e.m., P values obtained by heteroscedastic two-sided t-test. Tfn, transferrin; xCT, cystine-glutamate antiporter.

Similar articles

Cited by

References

    1. Birsoy K, et al. Metabolic determinants of cancer cell sensitivity to glucose limitation and biguanides. Nature. 2014;508:108–112. - PMC - PubMed
    1. Davidson SM, et al. Environment impacts the metabolic dependencies of Ras-driven non-small cell lung cancer. Cell Metab. 2016;23:517–528. - PMC - PubMed
    1. Kamphorst JJ, et al. Hypoxic and Ras-transformed cells support growth by scavenging unsaturated fatty acids from lysophospholipids. Proc. Natl Acad. Sci. USA. 2013;110:8882–8887. - PMC - PubMed
    1. Vaupel P, Kallinowski F, Okunieff P. Blood flow, oxygen and nutrient supply, and metabolic microenvironment of human tumors: a review. Cancer Res. 1989;49:6449–6465. - PubMed
    1. Stehling O, Wilbrecht C, Lill R. Mitochondrial iron–sulfur protein biogenesis and human disease. Biochimie. 2014;100:61–77. - PubMed

Publication types

MeSH terms