. 2017 Nov 30;551(7682):653-657.
doi: 10.1038/nature24658. Epub 2017 Nov 22.

Structural basis for the initiation of eukaryotic transcription-coupled DNA repair

Affiliations

Structural basis for the initiation of eukaryotic transcription-coupled DNA repair

Jun Xu et al. Nature. .

Abstract

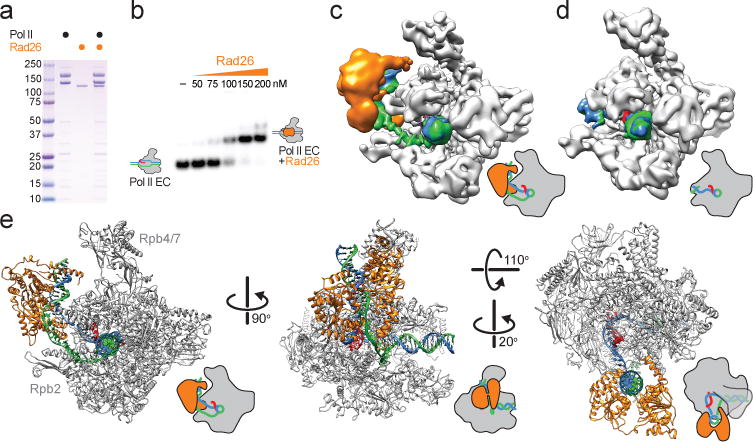
Eukaryotic transcription-coupled repair (TCR) is an important and well-conserved sub-pathway of nucleotide excision repair that preferentially removes DNA lesions from the template strand that block translocation of RNA polymerase II (Pol II). Cockayne syndrome group B (CSB, also known as ERCC6) protein in humans (or its yeast orthologues, Rad26 in Saccharomyces cerevisiae and Rhp26 in Schizosaccharomyces pombe) is among the first proteins to be recruited to the lesion-arrested Pol II during the initiation of eukaryotic TCR. Mutations in CSB are associated with the autosomal-recessive neurological disorder Cockayne syndrome, which is characterized by progeriod features, growth failure and photosensitivity. The molecular mechanism of eukaryotic TCR initiation remains unclear, with several long-standing unanswered questions. How cells distinguish DNA lesion-arrested Pol II from other forms of arrested Pol II, the role of CSB in TCR initiation, and how CSB interacts with the arrested Pol II complex are all unknown. The lack of structures of CSB or the Pol II-CSB complex has hindered our ability to address these questions. Here we report the structure of the S. cerevisiae Pol II-Rad26 complex solved by cryo-electron microscopy. The structure reveals that Rad26 binds to the DNA upstream of Pol II, where it markedly alters its path. Our structural and functional data suggest that the conserved Swi2/Snf2-family core ATPase domain promotes the forward movement of Pol II, and elucidate key roles for Rad26 in both TCR and transcription elongation.


Conflict of interest statement

The authors declare no competing financial interests.

Figures

Extended Data Figure 1
Extended Data Figure 1. Sequence alignment of the ATPase core domains of CSB family members
Protein sequences from the CSB ATPase core region from S. cerevisiae, S. pombe, A. thaliana, D. rerio, M. musculus and H. sapiens were aligned using Clustal Omega. Residues are numbered based on the sequence of the S.c. CSB ortholog (Rad26). Conserved residues are highlighted in red and helicase-specific motifs are boxed in black and labeled with roman numerals. The flexible disordered loop regions that were not built into the cryo-EM density are indicated, as are the SWI2/SNF2-specific domains HD1 and HD2.
Extended Data Figure 2
Extended Data Figure 2. Cryo-EM reconstructions of the Pol II EC-Rad26 and Pol II EC complexes
a, Representative micrograph of Pol II EC-Rad26 complexes. The scale bar represents 100 nm. b, Power spectrum of the micrograph in a showing Thon rings out to 3.4 Å. c, Representative 2D class averages of the Pol II EC-Rad26 complex. d, Schematic representation of the strategy used to sort out the data sets into Pol II EC and Pol II EC-Rad26 complex structures. Unless otherwise noted, 3D classification was performed without image alignment. Colored, segmented maps indicate those classes whose particles were used for further processing. The color scheme used in the segmented maps is as follows: grey: Pol II, orange: Rad26, green: transcription scaffold. Black lines follow the classification scheme used to extract homogeneous Pol II EC-Rad26 particles; blue lines follow the classification scheme used to extract homogeneous Pol II EC particles. The refined maps for the higher-resolution Pol II EC-Rad26 complex (with fragmented Rad26 density), final Pol II EC-Rad26 complex and Pol II EC are highlighted with green, black and blue boxes, respectively. The indicated resolution corresponds to the 0.143 FSC based on gold standard FSC curves. The number of particles contributing to each selected structure are indicated. The percentages shown are relative to the total number of particles selected after 2D classification. e, f, g, Front and back views of locally-filtered maps colored by local resolution. h, Euler angle distribution of particle images for the maps shown in e-g. i, Fourier Shell Correlation (FSC) plots for the higher-resolution Pol II EC-Rad26 complex (with fragmented Rad26 density), final Pol II EC-Rad26 complex and Pol II EC maps with the resolution at 0.143 FSC indicated. j, Representative near-atomic resolution regions in Pol II from the locally-filtered higher-resolution (4.5 Å) Pol II EC-Rad26 map. The density is shown in transparent grey with the atomic model for Pol II EC-Rad26 complex fitted in the map. The β-sheet corresponds to residues 346-356, 440-446, and 486-493 in Rpb1, and 1104-1107 in Rpb2. The portion of the bridge helix shown here corresponds to residues 810-829 in Rpb1.
Extended Data Figure 3
Extended Data Figure 3. Three-dimensional classification of Pol II EC-Rad26 complex data and Rosetta model validation
a, Table summarizing the main statistics from data collection, refinement and model validation. b, c, Root mean square deviation (RMSD) of the protein backbones among the top five conformations (based on Rosetta energy) of Pol II EC-Rad26 complex (b) and Pol II EC (c) generated by RosettaCM. In both cases the best Rosetta energy model is shown as a worm model, with thickness and color representing the backbone RMSD. The transcription scaffolds were not included in the RMSD calculation and were omitted for clarity. d, Backbone RMSD between the atomic models of Pol II EC-Rad26 complex and Pol II EC shown on the atomic model of Pol II EC-Rad26 complex using the same representation used in b and c. The models were globally aligned to each other in Chimera (UCSF) and only those parts of the model for which RMSD calculation could be performed are shown. e, f, FSC curves between the atomic model and cryo-EM maps for Pol II EC-Rad26 complex (e) and Pol II EC (f). In e FSCwork and FSCfree were calculated using half maps from the higher-resolution Pol II EC-Rad26 complex structure. The 0.5 FSC line is shown. g, MolProbity statistics for the Pol II EC-Rad26 complex and Pol II EC models. RSCC: Real Space Correlation Coefficient, as implemented in EMRinger. The RSCC value shown in parentheses for Pol II EC-Rad26 complex is for the higher-resolution (4.5 Å) map with fragmented Rad26 density. h, i, Three different views of the Pol II EC-Rad26 map with models docked in (h), and close-up views of the Pol II-Rad26 interface (i).
Extended Data Figure 4
Extended Data Figure 4. Cryo-EM reconstruction of a Pol II EC containing a CPD lesion
a, Representative micrograph of Pol II EC (CPD). b, Power spectrum of the micrograph in (a). c, Representative 2D class averages of the Pol II EC (CPD) complex. d, Fourier Shell Correlation (FSC) plot for the final Pol II EC (CPD) map with the resolution at 0.5 FSC indicated. e, Euler angle distribution of particle images. f, Table summarizing data collection statistics. g-k, Strategy for generating difference map between Pol II EC-Rad26 and Pol II EC (CPD). We took the model for the Pol II EC-Rad26 complex (g), removed Rad26 (h), and converted the resulting model into a cryo-EM-like density (i). From this, we subtracted the Pol II EC (CPD) map (j) to obtain the difference map (k). l, Two views of the Pol II EC (CPD) map. m, Model of the Pol II EC complex after removal of Rad26 (h) docked into the Pol II EC (CPD) map. n, Same as in (m) with the difference map superimposed.
Extended Data Figure 5
Extended Data Figure 5. Alignment of the HD2-1 region of CSB and non-CSB members of the SWI/SNF superfamily of ATPases
The HD2-1 region corresponds to the “wedge” motif in the Pol II EC-Rad26 structure (see Fig. 3e). See Extended Data Figure 1 for the location of the HD2-1 region within the full ATPase domain. Residues are colored (according to physicochemical properties) when conserved in at least half of the sequences.
Extended Data Figure 6
Extended Data Figure 6. EMSA assays reveal the strength of base pairing at the upstream fork of the transcription bubble, not CPD lesions at downstream fork, affects the interaction of Rad26 with Pol II EC
a, The sequence of the scaffold used in this study. The nucleotides labeled as XXX and YYY were varied in these experiments to control the strength of the base pairing at the upstream fork of the transcription bubble. b, Electrophoretic mobility shift assay (EMSA) between Rad26 and Pol II EC with an AT-rich sequence at the upstream fork of the DNA bubble. c, EMSA between Rad26 and Pol II EC with a GC-rich sequence at the upstream fork of the DNA bubble. d, Quantitation of the assays shown in b, c. Data shown as mean and standard deviation (n = 3). P-values: not shown = not significant; * = <0.05; ** = <0.01; *** = <0.001; **** = <0.0001. Precise p-values shown in Extended Data Table 1. e, Modeled structure of Pol II in complex with the mini-scaffold. Rad26, from the Pol II EC-Rad26 complex structure, was included as a semi-transparent ribbon diagram to indicate the lack of interaction between it and the mini-scaffold. Mini-scaffolds that eliminate the upstream DNA to which Rad26 binds were used to form elongation complexes (mini-ECs) with Pol II, and the interaction between these mini-ECs and Rad26 was tested using EMSA. f, DNA/RNA scaffolds used in this experiment. In order to rule out the possibility that Rad26 may bind to dsDNA in a non-specific manner, a scaffold with only RNA and TS (Scaffold 2) was also tested. g, h, EMSA with Scaffold 1 (g) and Scaffold 2 (h) showing formation of a Pol II mini-EC-Rad26 complex. The experiment was repeated independently twice with similar results. i, Scaffolds with or without a CPD lesion (see Methods for details) were used to form elongation complexes with Pol II, and the interaction between them and Rad26 was tested using EMSA. j, Quantitation of data in (i). Data shown as mean and standard deviation (n = 3). All biochemical experiments were repeated independently 3 times with similar results, except 2 times for g and h. For gel source data, see Supplementary Fig. 1.
Extended Data Figure 7
Extended Data Figure 7. Overlap between the binding sites of Rad26 and Spt4/Spt5 on Pol II
a, c, Structure of the Pol II EC-Rad26 complex with Rad26 and the DNA/RNA scaffold shown in surface representation. b, d, Structure of Pol II EC bound to Spt4/Spt5 and TFIIS (PDB ID: 5XON) with Spt4 and Spt5 shown in surface representation. The different domains of Spt5 are indicated. e, Rad26 and the DNA/RNA scaffold from (a) are superimposed on Spt4/Spt5 from (b). f, Rotated view of (e). g, Rad26 and the DNA/RNA scaffold from (c) are superimposed on Spt4/Spt5 from (d). h, Rotated view of (g). The bicolor arrows indicate clashes between Rad26 or the DNA/RNA scaffold and Spt4/Spt5.
Extended Data Figure 8
Extended Data Figure 8. Alignment between Snf2 and Rad26
a, This panel is identical to Fig. 4b and is included here as a reference. b, Superposition between Rad26, bound to the transcription scaffold, and Snf2 from the cryo-EM structure of the Snf2-nucleosome complex (PDB ID: 5X0Y), with the nucleosome included in the image. This is the same alignment shown in Fig. 4a-c and panel a, and was driven exclusively by Snf2 and Rad26. This view is rotated by 180° about the vertical axis relative to (a). The dashed box marks the portion of the structure equivalent to that shown in (a). The back gyre of the nucleosome was faded out for clarity. c, Same view as in (b) with Snf2 and Rad26 removed to illustrate the superposition of the Rad26-bound portion of the transcription scaffold and the nucleosomal DNA. d-g, Alignment of Rad26 and Snf2. The superimposed structures are shown in two orientations (d, f), with (d) corresponding to the direction indicated by the symbol in (a). A worm model is used to represent the similarity between the two structures (e, g), with thickness and color indicating the backbone RMSD. The thin wire corresponds to regions in the Rad26 model that are not present in Snf2.
Extended Data Figure 9
Extended Data Figure 9. Unified model for three-step DNA lesion recognition and verification for both Transcription-Coupled Nucleotide Excision Repair (TC-NER, also known as TCR) and Global Genomic Nucleotide Excision Repair (GG-NER)
Check step 1: For GG-NER, XPC/HR23B detects base-pair disruption and helix distortion and binds to the DNA strand opposite to that carrying the lesion. This constitutes the initial lesion recognition. For TCR, CSB is recruited to a stalled Pol II to discriminate genuine DNA lesion-induced transcription arrest from other forms of transcriptional arrest, as diagrammed in panel a. At this step, CSB acts in conjunction with Pol II to mediate the initial recognition of DNA lesions that block transcription translocation. Check step 2: Core TFIIH is recruited to further verify the DNA lesion. In GG-NER, the XPD and XPB helicases in core TFIIH translocate the complex towards the lesion. This is the result of XPD tracking along the damage-containing strand in a 5´ to 3´ direction and XPB tracking along the opposite strand (non-damaged) in a 3´ to 5´ direction. In TCR, TFIIH is loaded downstream of the arrested Pol II-CSB complex, with XPD and XPB tracking the template and non-template strands, respectively. The XPD/XPB helicases in core TFIIH translocate towards the lesion, as is the case for GG-NER. As a result, Pol II-CSB is pushed upstream by TFIIH to expose the DNA lesion. Check step 3: XPA is recruited for a final validation of the TFIIH-recognized lesion and to ensure that only genuine NER lesions are subjected to dual incision by endonucleases ERCC1/XPF and XPG and downstream repair synthesis.
Figure 1
Figure 1. Rad26 helps Pol II discriminate among different transcription obstacles
a, Rad26 is recruited to the stalled Pol II, leading to different outcomes. TS: Template Strand; NTS: Non-Template Strand. b, CSB orthologs share a conserved SWI2/SNF2-family ATPase core composed of two RecA-like lobes with the seven canonical Super Family 2 (SF2) helicase motifs (black bars). c-e, Transcription assays probing the ability of Rad26, Rad26 mutant, and TFIIS to discriminate among three representative transcription obstacles encountered by Pol II: A pause-inducing repetitive A-tract sequence (c); A sequence-specific DNA-binding polyamide (Py-Im) (d); and a TT cyclobutane pyrimidine dimer (CPD) DNA lesion (e). The asterisk in (c) represents a Pol II pausing site upstream of the A-tract sequence. Last lane in (e): full-length transcript in the absence of the CPD lesion. Experiments in c-e were repeated independently 3 times with similar results. For gel source data, see Supplementary Fig. 1.
Figure 2
Figure 2. Cryo-electron microscopy structure of the Pol II Elongation Complex bound to Rad26
a, Coomassie blue-stained SDS gel of purified Pol II, Rad26 and Pol II EC-Rad26 complex. b, Native gel showing the formation of the Pol II EC-Rad26 complex. c, d, Cryo-EM density for the Pol II EC-Rad26 complex (c) and Pol II EC alone (d). The map was filtered according to the local resolution (see Extended Data Fig. 2). e, Atomic model for the Pol II EC-Rad26 complex. Cartoons of the structures highlight their orientations. Color coding follows the convention from Fig. 1a. For gel source data, see Supplementary Fig. 1.
Figure 3
Figure 3. Rad26 binds to the upstream DNA and bubble fork of Pol II EC and bends the upstream DNA
a, Atomic model for the scaffold in the Pol II EC-Rad26 complex displayed inside the segmented cryo-EM density, obtained by subtracting Pol II and Rad26 from the Pol II EC-Rad26 map. Orange asterisk: Rad26 density not modeled. Top-right inset: scaffold density (in yellow) in the context of the full complex. b, Superposition of the scaffolds from the Pol II EC-Rad26 and Pol II EC structures, with the latter shown in darker colors. c, Close-up view of the interaction between Rad26 and the scaffold. d, DNase I footprinting assay of Pol II EC-Rad26. The experiment was repeated independently 3 times with similar results. e, Close-up of the Rad26 HD2-1 “wedge” (yellow arrow) that interacts with the upstream bubble fork. Same view as c except with Rad26 in a surface charge representation. Right inset: closer view of the interaction, looking from the transcription bubble towards the upstream DNA. g, Major interactions between Rad26 and the Wall and Protrusion regions of Pol II. The Pol II motifs that bind to Rad26 are shown as surface representations, with the corresponding residues listed. f, Effect of transcription bubble size in the affinity of Rad26 for Pol II EC. Mismatches were added to the upstream fork, downstream fork, or both. Data shown as mean and standard deviation (n = 3). P-values (two-tailed Student’s t test): not shown = not significant; * = <0.05; ** = <0.01; *** = <0.001; **** = <0.0001. Precise p-values shown in Extended Data Table 1. For gel source data, see Supplementary Fig. 1.
Figure 4
Figure 4. Rad26 translocates along the template strand towards Pol II
a, The Snf2 ATPase (PDB ID: 5X0Y) was aligned to Rad26 in the Pol II EC-Rad26 structure. Nucleic acids were excluded from the alignment. b, Blown-up view of the rectangle shown in a, with nucleosomal DNA bound by Snf2 included. Yellow arrow: direction of DNA movement superimposed on the tracking strand that would result from the 3′ to 5′ DNA translocation activity of Snf2. This strand corresponds to the Template Strand (blue) in the Pol II EC-Rad26 scaffold. c, Full view of the Pol II EC-Rad26 structure. Blue arrow: direction of DNA movement resulting from translocation by Rad26 along the Template Strand. d, e, Comparison between the Pol II EC-Rad26 complex and a Pol II EC containing a CPD DNA lesion (PDB ID: 2JA6), with the root mean square deviation (RMSD) between the Pol II backbones shown on the Pol II EC-Rad26 complex as a worm diagram. Color and thickness represent the RMSD value. f, Scaffolds from Pol II EC-Rad26 and the Pol II EC containing the CPD lesion shown as in e. Rad26 and the bridge helices, and CPD lesion are shown. Dark blue arrow: direction of DNA movement as Pol II transcribes. White bar: CPD-induced blockage of translocation. The Pol II EC scaffold containing the CPD lesion is shown in darker colors.
Figure 5
Figure 5. Rad26 resolves Pol II backtracking in an ATP-dependent manner
a, Schematic representation of experimental design. b, Experimental timeline. c, Sequencing gels showing TFIIS-stimulated RNA cleavage products for the reactions outlined in (b). Uncleaved transcript is indicated. d, Quantification of the percentage of uncleaved RNA. Data shown as mean and standard deviation (n = 4). P-values (two-tailed Student’s t test): not shown = not significant; * = <0.05; ** = <0.01; *** = <0.001; **** = <0.0001. Precise p-values shown in Extended Data Table 1. e, Model for the identification of substrates for TCR by Rad26 in conjunction with Pol II. See main text for details. For gel source data, see Supplementary Fig. 1.

References

    1. Hanawalt PC, Spivak G. Transcription-coupled DNA repair: two decades of progress and surprises. Nat Rev Mol Cell Biol. 2008;9:958–970. - PubMed
    1. Svejstrup JQ. Contending with transcriptional arrest during RNAPII transcript elongation. Trends Biochem Sci. 2007;32:165–171. - PubMed
    1. Troelstra C, et al. ERCC6, a member of a subfamily of putative helicases, is involved in Cockayne’s syndrome and preferential repair of active genes. Cell. 1992;71:939–953. - PubMed
    1. van Gool AJ, et al. RAD26, the functional S. cerevisiae homolog of the Cockayne syndrome B gene ERCC6. EMBO J. 1994;13:5361–5369. - PMC - PubMed
    1. van Gool AJ, et al. The Cockayne syndrome B protein, involved in transcription-coupled DNA repair, resides in an RNA polymerase II-containing complex. EMBO J. 1997;16:5955–5965. - PMC - PubMed

Publication types

MeSH terms