

Factors Effecting the Total Volatile Organic Compound (TVOC) Concentrations in Slovak Households
- PMID: 29168779
- PMCID: PMC5750862
- DOI: 10.3390/ijerph14121443
Factors Effecting the Total Volatile Organic Compound (TVOC) Concentrations in Slovak Households
Abstract
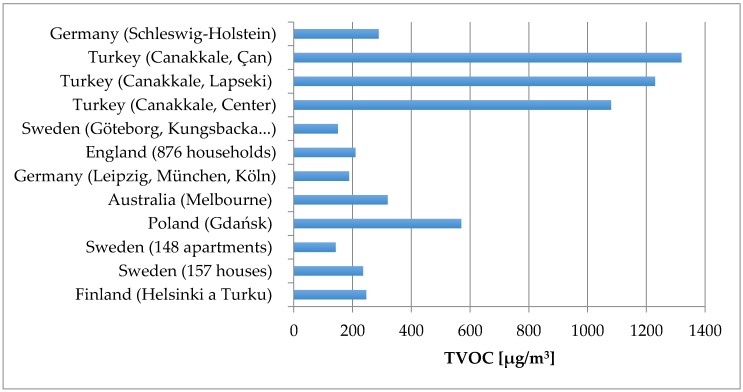
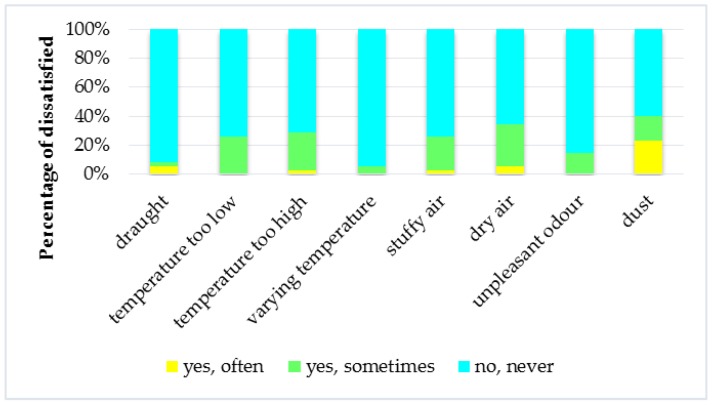
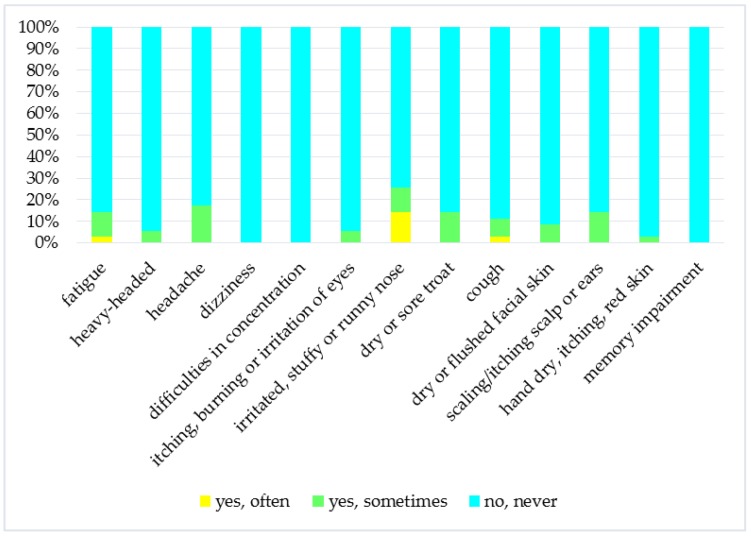
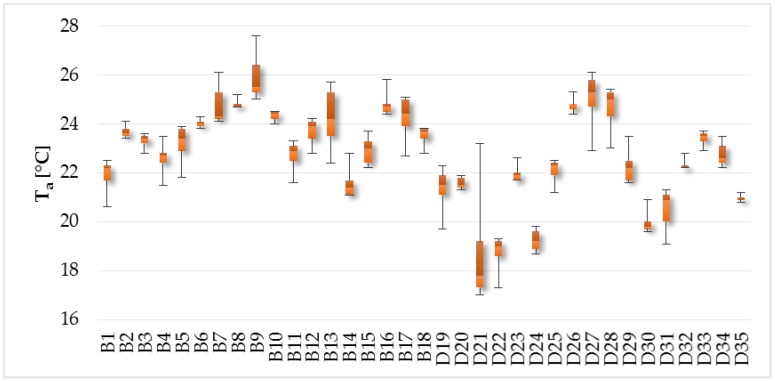
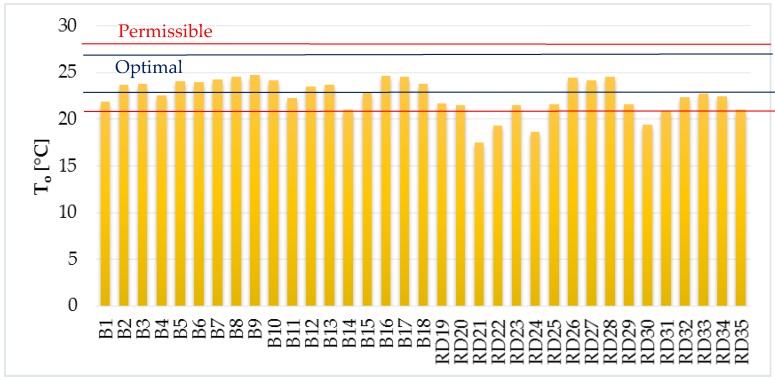
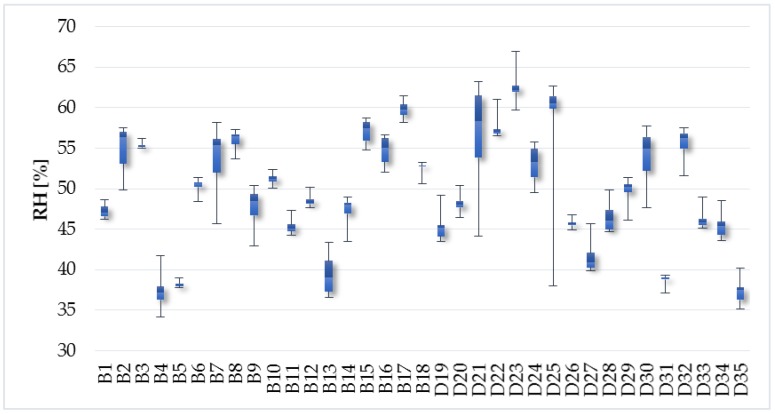
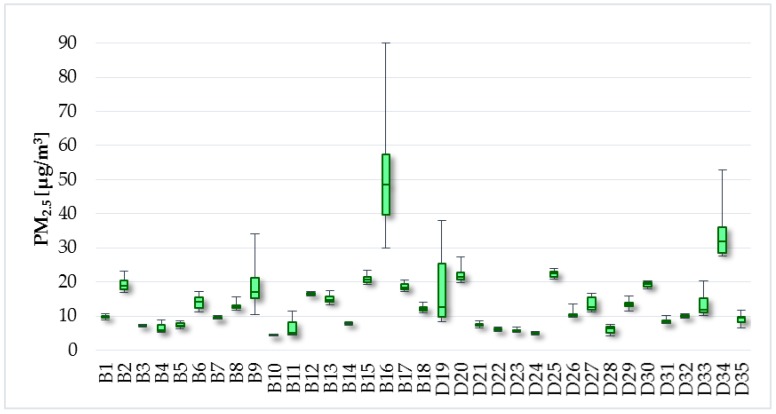
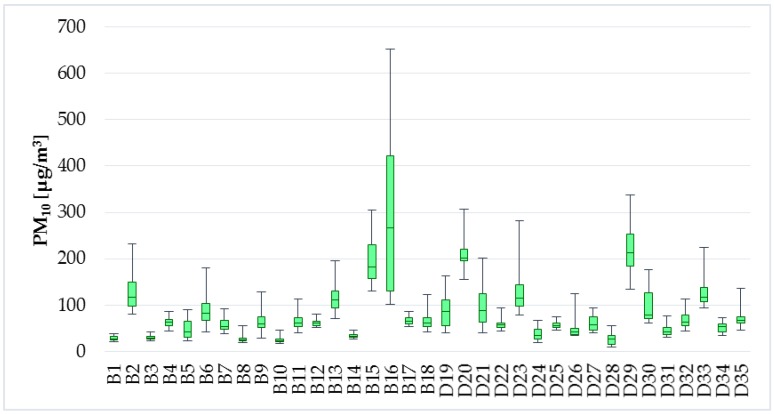
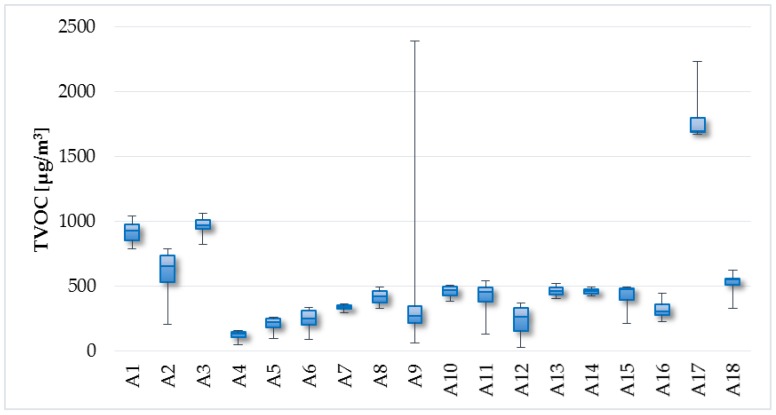
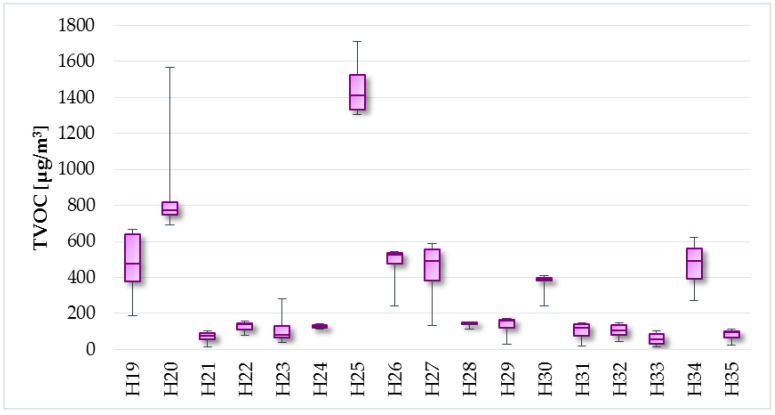
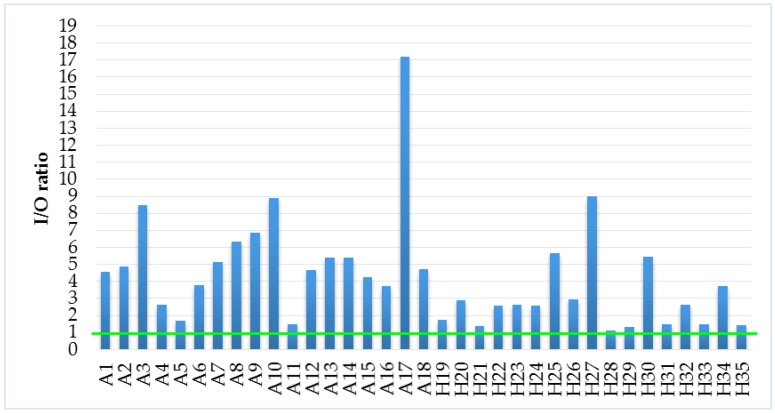
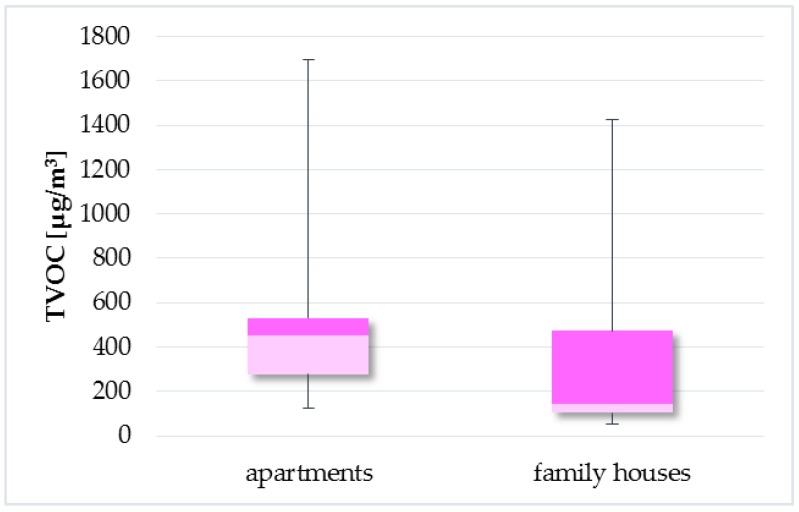
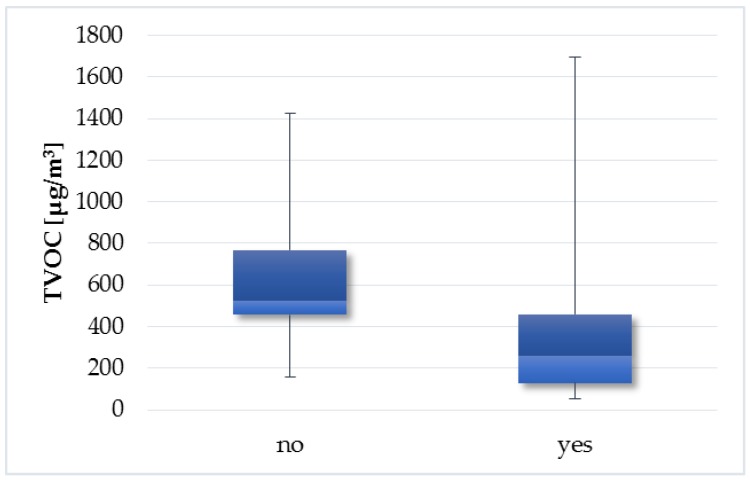
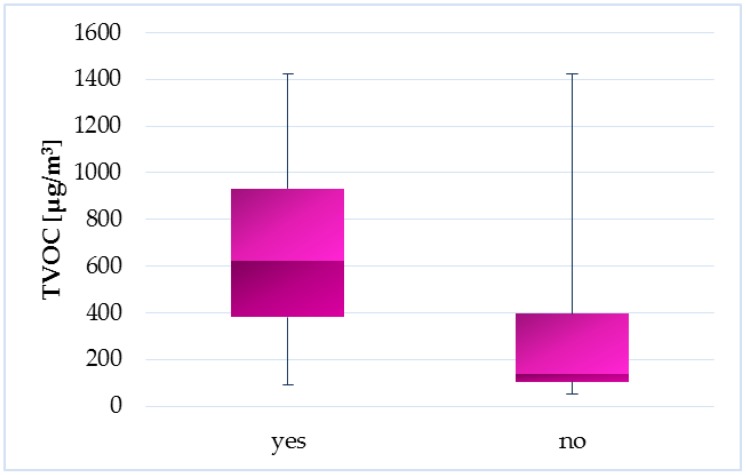
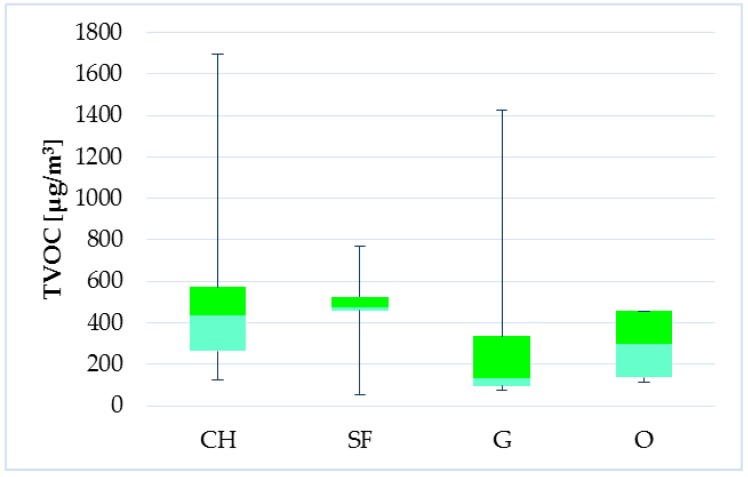
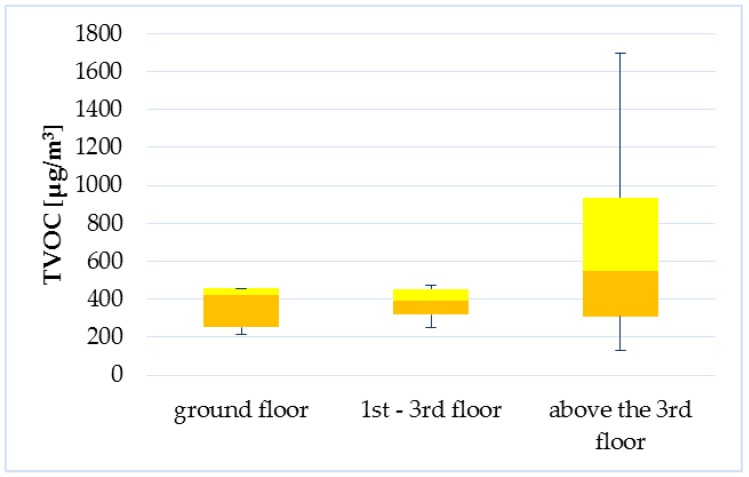
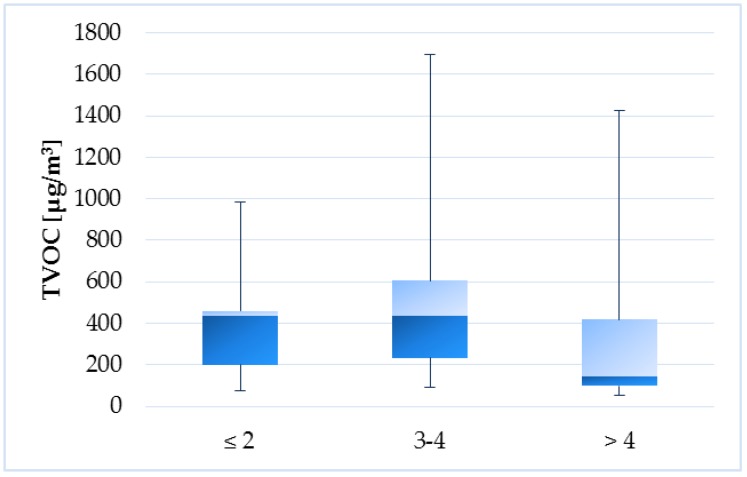
Thirty five Slovak households were selected for an investigation of indoor environmental quality. Measuring of indoor air physical and chemical factors and a questionnaire survey was performed during May 2017. The range of permissible operative temperature was not met in 11% of objects. Relative humidity met the legislative requirements in all monitored homes. Concentrations of total volatile organic compounds (TVOCs) were significantly higher in the apartments than in the family houses. The average TVOC levels in the apartments and family houses were 519.7 µg/m³ and 330.2 µg/m³, respectively. Statistical analysis confirmed the effect of indoor air temperature, relative humidity and particulate matter (PM0.5 and PM₁) on the levels of TVOCs. Higher TVOC levels were observed also in homes where it is not a common practice to open windows during cleaning activities. Other factors that had a statistically significant effect on concentrations of volatile organic compounds were heating type, attached garage, location of the apartment within residential building (the floor), as well as number of occupants. Higher TVOC concentrations were observed in indoor than outdoor environment, while further analysis showed the significant impact of indoor emission sources on the level of these compounds in buildings. The questionnaire study showed a discrepancy between objective measurement and subjective assessment in the household environment, and pointed to insufficient public awareness about volatile organic compounds (VOCs).
Keywords: TVOC; characteristics; dependence; household; indoor environment.
Conflict of interest statement
The authors declare no conflict of interest.
Figures


Similar articles
-
Investigation of Indoor Air Quality in Houses of Macedonia.Int J Environ Res Public Health. 2017 Jan 1;14(1):37. doi: 10.3390/ijerph14010037. Int J Environ Res Public Health. 2017. PMID: 28045447 Free PMC article.
-
Indoor air quality in green buildings: A case-study in a residential high-rise building in the northeastern United States.J Environ Sci Health A Tox Hazard Subst Environ Eng. 2015;50(3):225-42. doi: 10.1080/10934529.2015.981101. J Environ Sci Health A Tox Hazard Subst Environ Eng. 2015. PMID: 25594117
-
Indoor air quality and thermal comfort in temporary houses occupied after the Great East Japan Earthquake.Indoor Air. 2014 Aug;24(4):425-37. doi: 10.1111/ina.12082. Epub 2014 Jan 9. Indoor Air. 2014. PMID: 24354902
-
Impact of Climate Change on Indoor Air Quality: A Review.Int J Environ Res Public Health. 2022 Nov 24;19(23):15616. doi: 10.3390/ijerph192315616. Int J Environ Res Public Health. 2022. PMID: 36497689 Free PMC article. Review.
-
Influence of indoor environmental factors on mass transfer parameters and concentrations of semi-volatile organic compounds.Chemosphere. 2018 Mar;195:223-235. doi: 10.1016/j.chemosphere.2017.12.072. Epub 2017 Dec 18. Chemosphere. 2018. PMID: 29268180 Review.
Cited by
-
Development of a Tuneable NDIR Optical Electronic Nose.Sensors (Basel). 2020 Dec 1;20(23):6875. doi: 10.3390/s20236875. Sensors (Basel). 2020. PMID: 33271862 Free PMC article.
-
The Association between Exposure to Residential Indoor Volatile Organic Compounds and Measures of Central Arterial Stiffness in Healthy Middle-Aged Men and Women.Int J Environ Res Public Health. 2022 Jan 16;19(2):981. doi: 10.3390/ijerph19020981. Int J Environ Res Public Health. 2022. PMID: 35055806 Free PMC article.
-
Association between maternal exposure to indoor air pollution and offspring congenital heart disease: a case-control study in East China.BMC Public Health. 2022 Apr 15;22(1):767. doi: 10.1186/s12889-022-13174-0. BMC Public Health. 2022. PMID: 35428227 Free PMC article.
-
Bad Air Can Also Kill: Residential Indoor Air Quality and Pollutant Exposure Risk during the COVID-19 Crisis.Int J Environ Res Public Health. 2020 Sep 30;17(19):7183. doi: 10.3390/ijerph17197183. Int J Environ Res Public Health. 2020. PMID: 33008116 Free PMC article.
-
Paving the Way for a Green Transition in the Design of Sensors and Biosensors for the Detection of Volatile Organic Compounds (VOCs).Biosensors (Basel). 2022 Jan 19;12(2):51. doi: 10.3390/bios12020051. Biosensors (Basel). 2022. PMID: 35200311 Free PMC article. Review.
References
-
- Uchiyama S., Tomizawa T., Tokoro A., Aoki M., Hishiki M., Yamada T., Tanaka R., Sakamoto H., Yoshida T., Bekki K., et al. Gaseous chemical compounds in indoor and outdoor air of 602 houses throughout Japan in winter and summer. Environ. Res. 2015;137:364–372. doi: 10.1016/j.envres.2014.12.005. - DOI - PubMed
-
- Thatcher T.L., Layton D.W. Deposition, resuspension and penetration of particles within a residence. Atmos. Environ. 1995;29:1487–1497. doi: 10.1016/1352-2310(95)00016-R. - DOI
-
- Technical Report No. 6: BTEX Personal Exposure Monitoring in Four Australian Cities. [(accessed on 11 October 2017)]; Available online: https://www.environment.gov.au/system/files/resources/dc6c0439-ac47–4c53....
MeSH terms
Substances
LinkOut - more resources
Full Text Sources
Other Literature Sources
Medical
Miscellaneous
