. 2018 Jan 10:269:405-422.
doi: 10.1016/j.jconrel.2017.11.031. Epub 2017 Nov 21.

A novel controlled release formulation of the Pin1 inhibitor ATRA to improve liver cancer therapy by simultaneously blocking multiple cancer pathways

Affiliations

A novel controlled release formulation of the Pin1 inhibitor ATRA to improve liver cancer therapy by simultaneously blocking multiple cancer pathways

Dayun Yang et al. J Control Release. .

Abstract

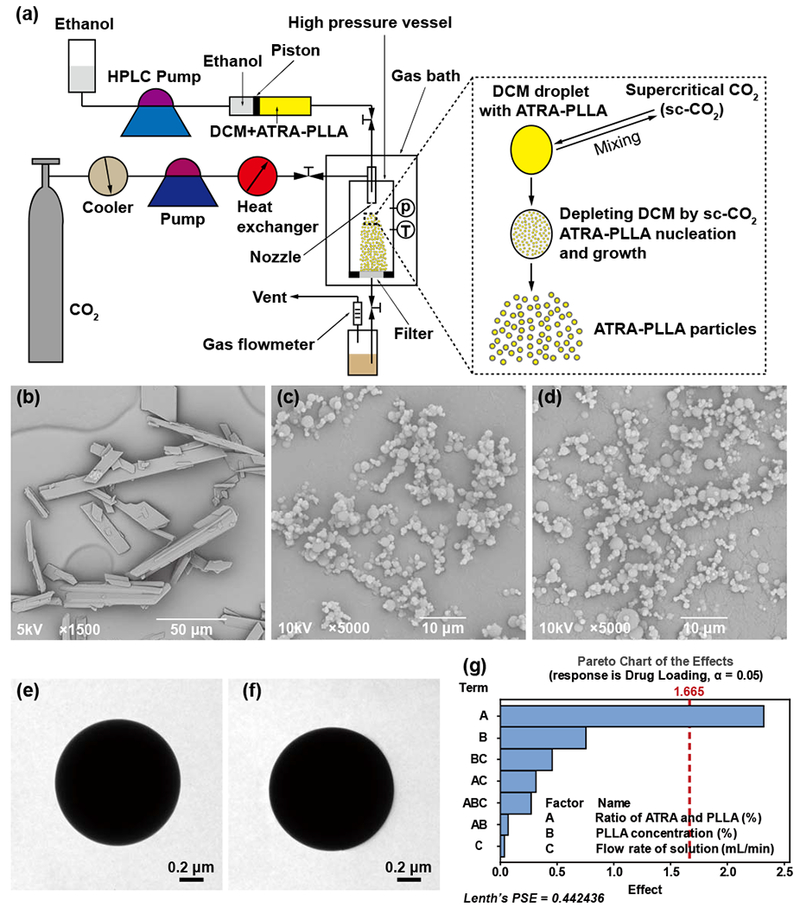
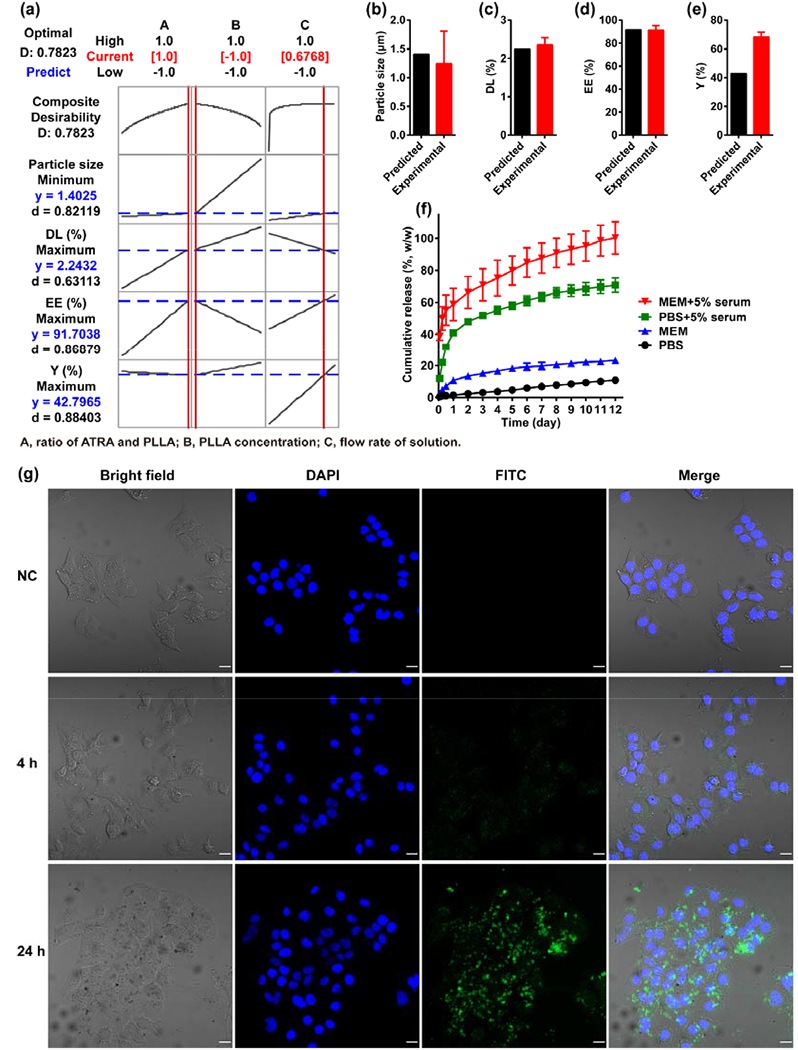
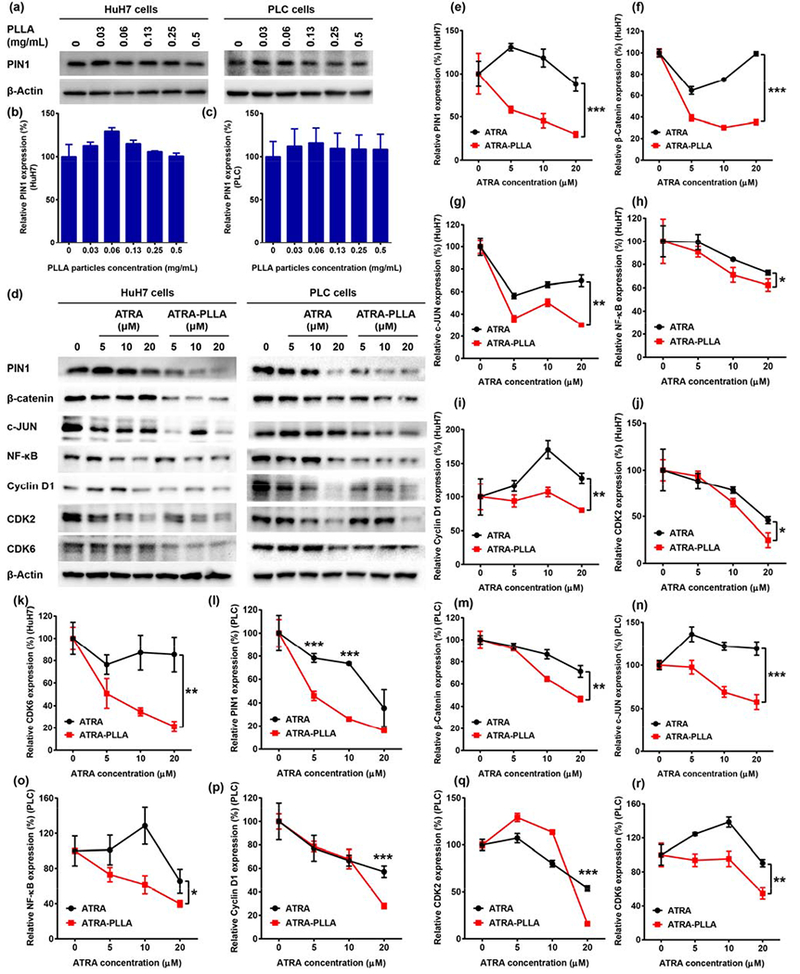
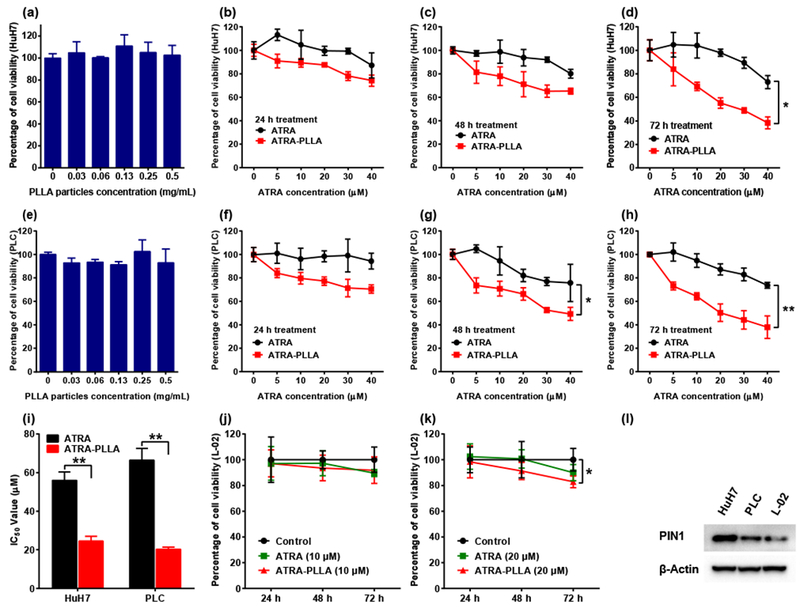
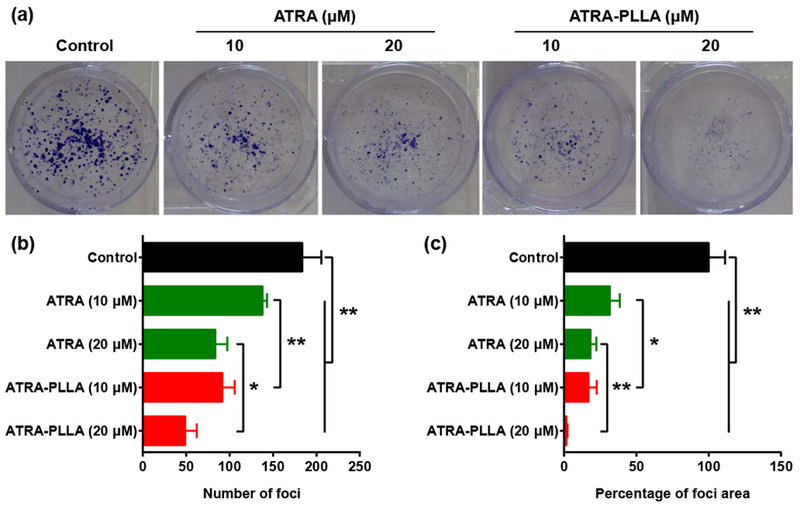
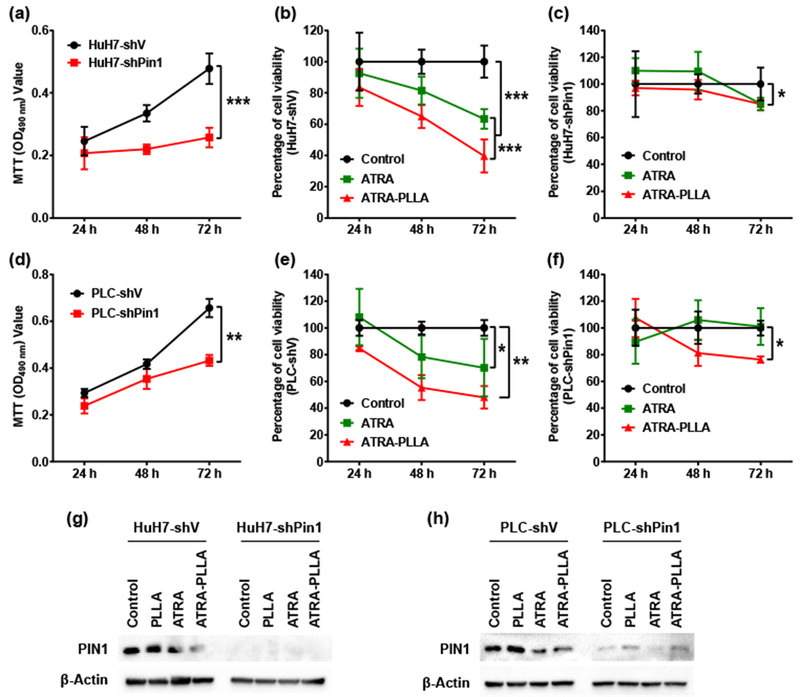
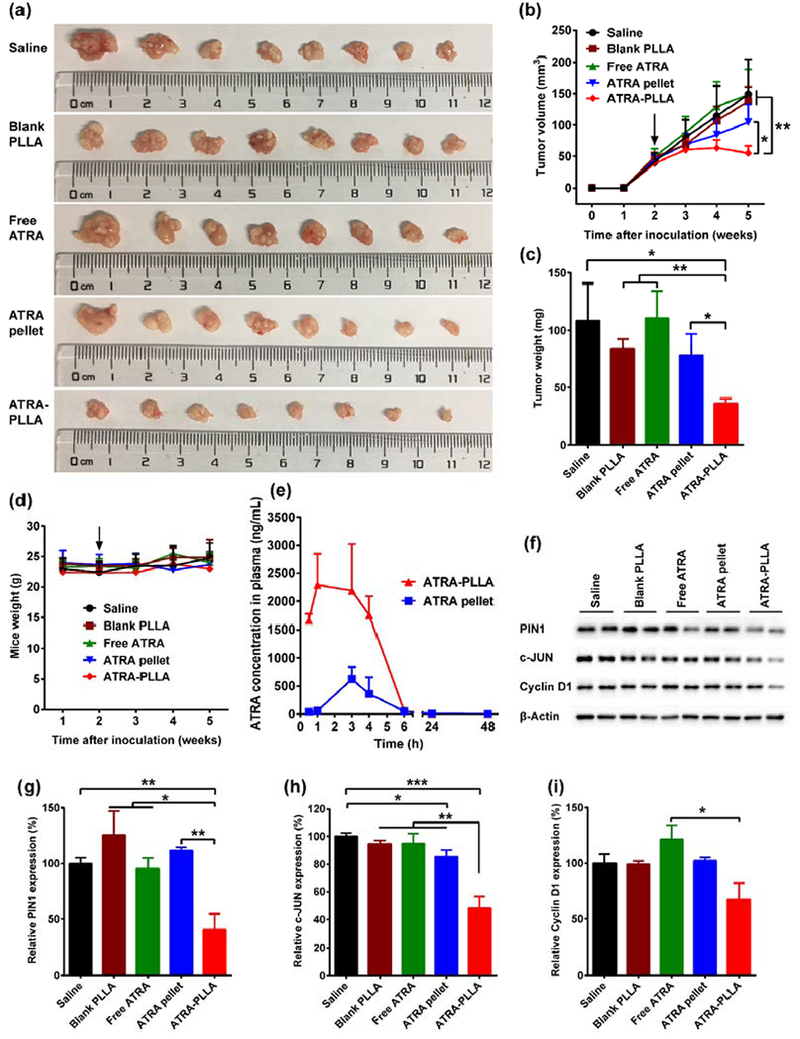
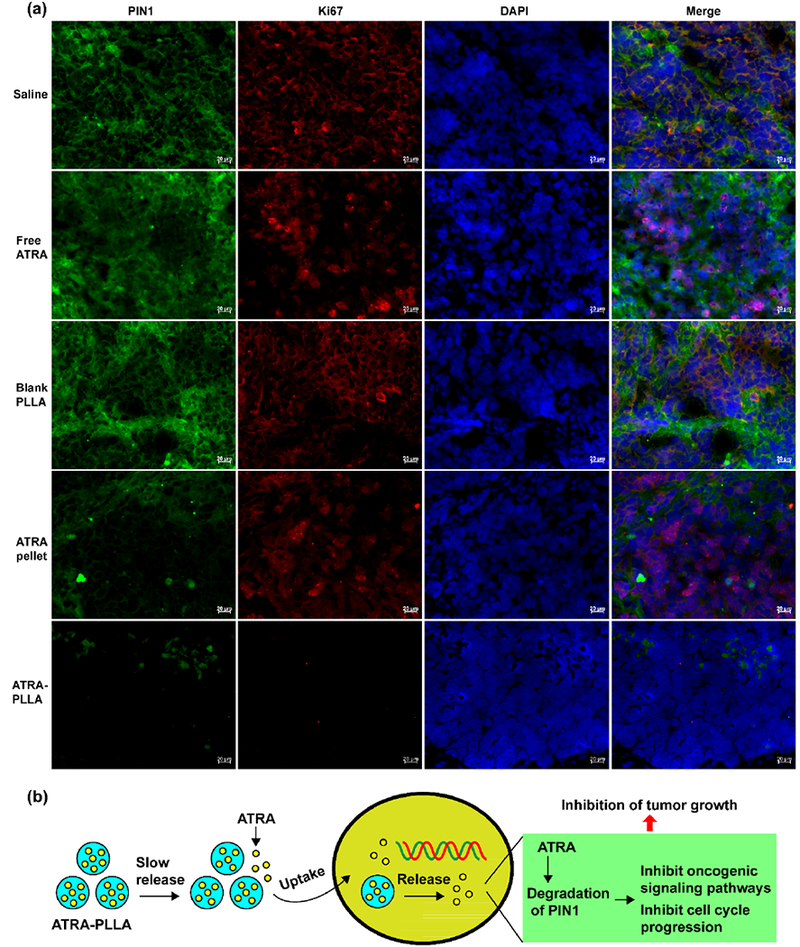
Hepatocellular carcinoma (HCC) is the second leading cause of cancer deaths worldwide largely due to lack of effective targeted drugs to simultaneously block multiple cancer-driving pathways. The identification of all-trans retinoic acid (ATRA) as a potent Pin1 inhibitor provides a promising candidate for HCC targeted therapy because Pin1 is overexpressed in most HCC and activates numerous cancer-driving pathways. However, the efficacy of ATRA against solid tumors is limited due to its short half-life of 45min in humans. A slow-releasing ATRA formulation inhibits solid tumors such as HCC, but can be used only in animals. Here, we developed a one-step, cost-effective route to produce a novel biocompatible, biodegradable, and non-toxic controlled release formulation of ATRA for effective HCC therapy. We used supercritical carbon dioxide process to encapsulate ATRA in largely uniform poly L-lactic acid (PLLA) microparticles, with the efficiency of 91.4% and yield of 68.3%, and ~4-fold higher Cmax and AUC over the slow-releasing ATRA formulation. ATRA-PLLA microparticles had good biocompatibility, and significantly enhanced the inhibitory potency of ATRA on HCC cell growth, improving IC50 by over 3-fold. ATRA-PLLA microparticles exerted its efficacy likely through degrading Pin1 and inhibiting multiple Pin1-regulated cancer pathways and cell cycle progression. Indeed, Pin1 knock-down abolished ATRA inhibitory effects on HCC cells and ATRA-PLLA did not inhibit normal liver cells, as expected because ATRA selectively inhibits active Pin1 in cancer cells. Moreover ATRA-PLLA microparticles significantly enhanced the efficacy of ATRA against HCC tumor growth in mice through reducing Pin1, with a better potency than the slow-releasing ATRA formulation, consistent with its improved pharmacokinetic profiles. This study illustrates an effective platform to produce controlled release formulation of anti-cancer drugs, and ATRA-PLLA microparticles might be a promising targeted drug for HCC therapy as PLLA is biocompatible, biodegradable and nontoxic to humans.

Keywords: ATRA; Controlled release; Liver cancer; Pin1; Supercritical carbon dioxide; Targeted therapy.


Conflict of interest statement

Conflict of Interest

Dr. Lu and Dr. Zhou are inventors of Pin1 technology, which was licensed by BIDMC to Pinteon Therapeutics. Both Dr. Lu and Dr. Zhou own equity in, and consult for, Pinteon. Their interests were reviewed and are managed by BIDMC in accordance with its conflict of interest policy.

Figures

Fig. 1.
Fig. 1.
(a) Schematic diagram of the apparatus for the SAS process. SEM images for (b) original ATRA powders, (c) blank PLLA particles and (d) ATRA-PLLA particles. TEM images for (e) blank PLLA particles and (f) ATRA-PLLA particles, (g) Effect of the factors on drug loading. Factors A, B and C represent the ratio of ATRA and PLLA (%), PLLA concentration (%), and flow rate of solution (mL/min) in the SAS process, respectively.
Fig. 2.
Fig. 2.
(a) The optimization plot for the effects of factors on the predicted responses. Factors A, B and C represent the ratio of ATRA and PLLA (%), PLLA concentration (%), and flow rate of solution (mL/min) in the SAS process, respectively. The numbers displayed at the top of a column show the current factor settings (in red) and the high and low factor settings in the experimental design; The Predict link in the top left of the graph calculates the prediction (in blue) for the current factor settings; The vertical red lines on the graph represent the current settings; The horizontal blue lines represent the current response values, (b) Particle size, (c) Drug loading, (d) Encapsulation efficiency, and (e) Yield of the ATRA-PLLA particles prepared according to the predicted optimum experimental condition were investigated and compared to the predicted values, (f) In vitro release profile of ATRA from ATRA-PLLA particles in different mediums, (g) Cellular uptake of FITC-loaded PLLA particles. HuH7 cells were incubated with 0.13 mg/mL of the FITC-loaded PLLA particles for the indicated time, then stained with 4’, 6-diamidino-2-phenylindole (DAPI) staining solution and examined using a laser scanning microscope. Untreated cells were used as negative control. Bright field image shows the morphology of HuH7 cells, blue fluorescence (DAPI staining) indicates cell nucleus, and green fluorescence indicates the localization of FITC or FITC-loaded PLLA particles. Scale bars, 20 μm. Values are the mean ± standard deviation of triplicate determinations.
Fig. 3.
Fig. 3.
(a-c) Relative expression value of PIN1 in HuH7 and PLC cells after treating with different concentration of blank PLLA particles for 72 h were determined by western blot analysis, (d-r) Immunoblotting of proteins expressed in HuH7 and PLC cells treated with different concentration of free ATRA or ATRA-PLLA particles for 72 h. The related concentration of PLLA in ATRA-PLLA microparticle for 5, 10, 20 μM of ATRA was 0.06, 0.12, and 0.24 mg/mL, respectively. β-Actin was used as an internal control. Untreated cells were set as control. Each value is the mean ± standard deviation of triplicate determinations; *p < 0.05, **p < 0.01, ***p < 0.001.
Fig. 4.
Fig. 4.
Effects of blank PLLA particles, free ATRA, and ATRA-PLLA microparticles on viability of HuH7, PLC and L-02 cells after treating for the indicated times were assayed by MTT method, (a) Viability of HuH7 cells after treating with blank PLLA particles (0–0.5 mg/mL) for 72 h. Viability of HuH7 cells after treating with free ATRA or ATRA-PLLA particles (ATRA concentration ranging from 0 to 40 μM) for (b) 24 h, (c) 48 h, and (d) 72 h. (e) Viability of PLC cells after treating with blank PLLA particles (0–0.5 mg/mL) for 72 h. Viability of PLC cells after treating with free ATRA or ATRA-PLLA particles (ATRA concentration ranging from 0 to 40 μM) for (f) 24 h, (g) 48 h, and (h) 72 h. (I) Corresponding IC50 values of free ATRA and ATRA-PLLA particles for treating HuH7 or PLC cells for 72 h. Viability of L-02 cells after treating with free ATRA or ATRA-PLLA particles at a dose of (j) 10 μM and (k) 20 μM for the indicated times. (1) Expression of PIN1 in normal cultured HuH7, PLC and L-02 cells were determined by western blot analysis. β-Actin was used as an internal control. Each value is the mean ± standard deviation of triplicate determinations; *p < 0.05, **p < 0.01.
Fig. 5.
Fig. 5.
(a) Image, (b) number, and (c) area of foci formed by HuH7 cells treated with the indicated concentration of free ATRA or ATRA-PLLA particles for 72 h. Untreated cells were used as control. Each value is the mean ± standard deviation of triplicate determinations; *p < 0.05, **p < 0.01.
Fig. 6.
Fig. 6.
Effects of PIN1 knock-down on inhibition of ATRA against HuH7 and PLC cell growth. Growth curve of (a) HuH7 and (d) PLC cells expressing empty vector or PIN1 shRNA was established by MTT assay. HuH7 cells expressing empty vector (b) or PIN1 shRNA (c), and PLC cells expressing empty vector (e) or PIN1 shRNA (f) were treated with 20 μM free ATRA or ATRA-PLLA particles for 24 h, 48 h, and 72 h, and then the cell viability was assayed using MTT method, (g) HuH7 cells expressing empty vector or PIN1 shRNA, and (h) PLC cells expressing empty vector or PIN1 shRNA were treated with blank PLLA particles (0.25 mg/mL), free ATRA and ATRA-PLLA particles (ATRA concentration 20 μM) for 72 h, and then the PIN1 expression was determined by Western blotting analysis. β-Actin was used as an internal control. Untreated cells were set as control. Values are the mean ± standard deviation of triplicate determinations; *p < 0.05, **p < 0.01, ***p < 0.001.
Fig. 7.
Fig. 7.
Anti-tumor effect of ATRA-encapsulated PLLA particles in vivo, (a) Tumor size, (b) Quantitative curves of tumor volume, (c) Tumor weight, and (d) Curves of mice weight for nude mice inoculated with 4 × 10⁶ HuH7 cells and treated with saline, free ATRA, blank PLLA particles, ATRA slow-releasing pellet, and ATRA-PLLA particles 2 weeks later (arrow). For the treatment, free ATRA, blank PLLA particles and ATRA-PLLA particles were injected intraperitoneally into mice at a dose of 15 mg/kg (concentration of ATRA) twice a week for three weeks (i.e. each mouse was received a total of about 2 mg ATRA). 5 mg over 21 days of ATRA slow-releasing pellet was implanted subcutaneously in the lateral side of the neck between the ear and the shoulder (i.e. each mouse was received a total of 5 mg ATRA). Mice injected saline were used as control, n = 8. (e) Plasma concentrations of ATRA in nude mice after implanting an ATRA slow-releasing pellet (5 mg over 21 days) or injecting ATRA-PLLA particles (containing ATRA about 0.34 mg) once. n=4. (f–i) Relative expression value of PIN1, c-JUN, and Cyclin D1 in the xenograft tumors. *p < 0.05, **p < 0.01, ***p < 0.001.
Fig. 8.
Fig. 8.
(a) Immunofluorescence images of PIN1 and Ki67 in xenograft tumors from nude mice inoculated with 4 × 10⁶ HuH7 cells and treated with saline, free ATRA, blank PLLA particles, ATRA slow-releasing pellet, and ATRA-PLLA particles for three weeks, (b) The mechanism of anti-tumor effects of ATRA-PLLA microparticles.

References

    1. Aggarwal S, Targeted cancer therapies, Nat. Rev. Drug Discov 9 (2010) 427–428. - PubMed
    1. Hanahan D, Weinberg RA, Hallmarks of cancer: the next generation, Cell 144 (2011) 646–674. - PubMed
    1. Luo J, Solimini NL, Elledge SJ, Principles of cancer therapy: oncogene and non-oncogene addiction, Cell 136 (2009) 823–837. - PMC - PubMed
    1. Vogelstein B, Papadopoulos N, Velculescu VE, Zhou SB, Diaz LA, Kinzler KW, Cancer genome landscapes, Science 339 (2013) 1546–1558. - PMC - PubMed
    1. Lu LC, Hsu CH, Hsu C, Cheng AL, Tumor heterogeneity in hepatocellular carcinoma: facing the challenges, Liver cancer 5 (2016) 128–138. - PMC - PubMed

Publication types

MeSH terms