Comparative Study
. 2017 Nov 24;358(6366):1027-1032.
doi: 10.1126/science.aan3456.

Molecular and cellular reorganization of neural circuits in the human lineage

Affiliations
Comparative Study

Molecular and cellular reorganization of neural circuits in the human lineage

André M M Sousa et al. Science. .

Abstract

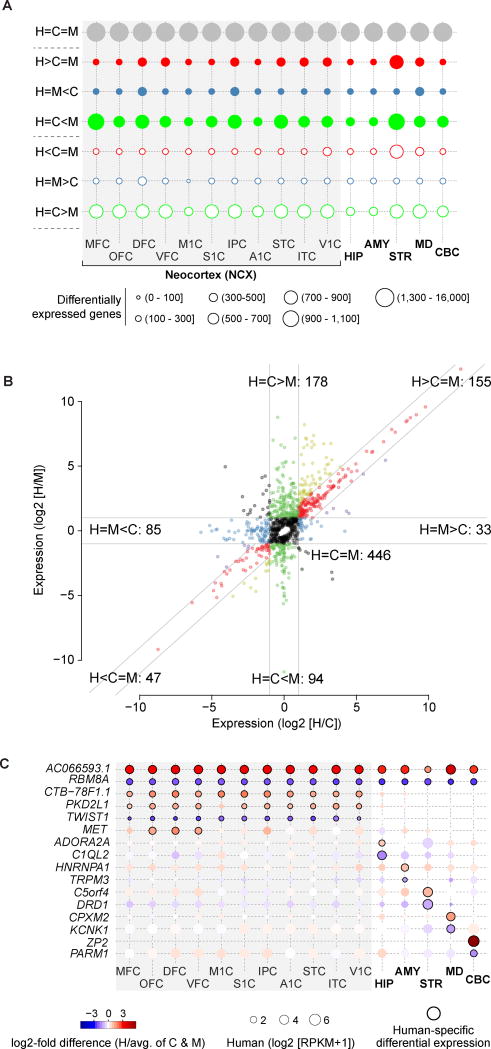
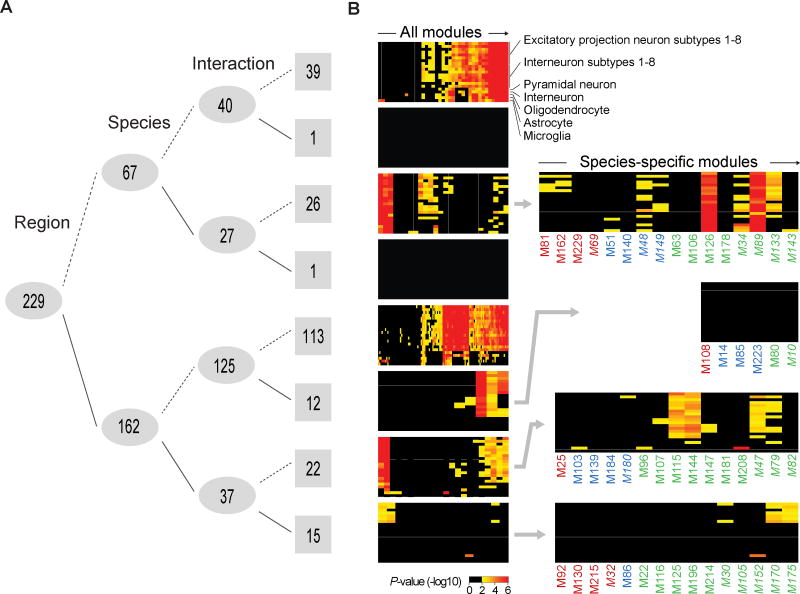
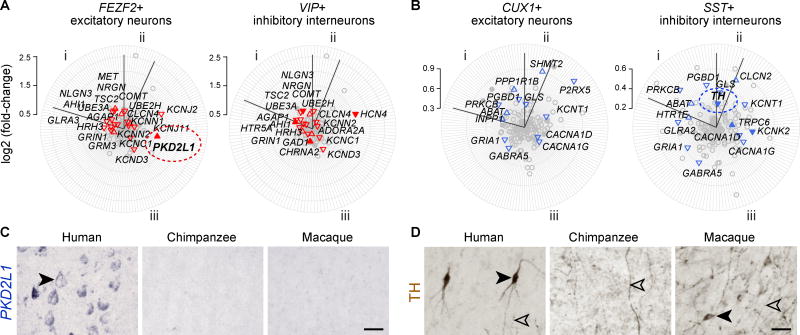
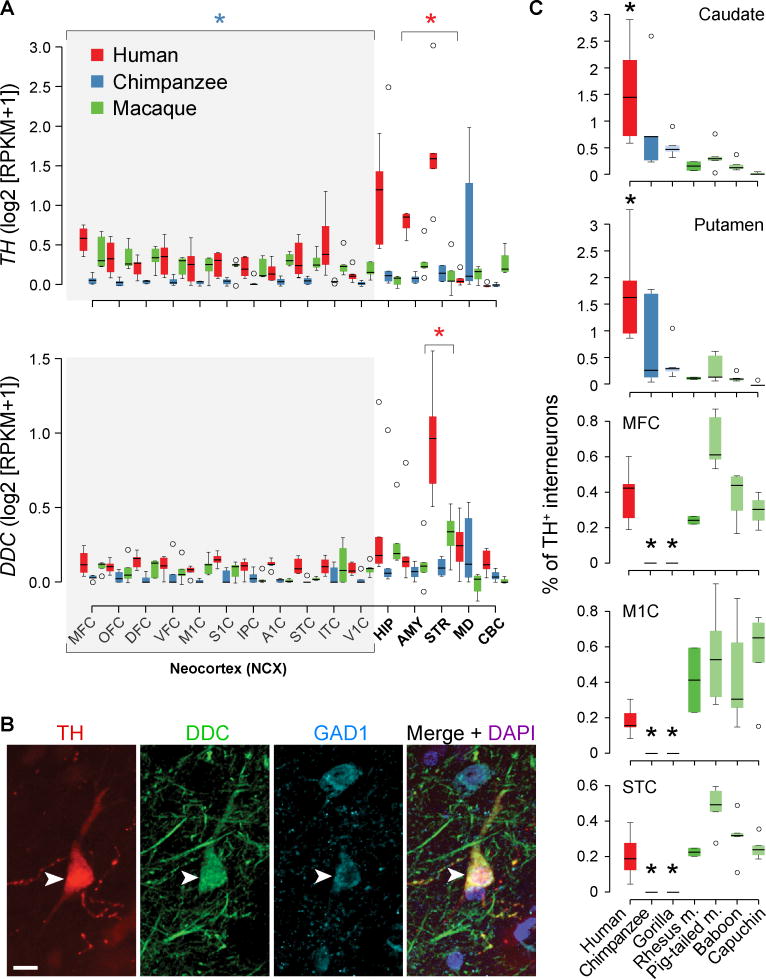
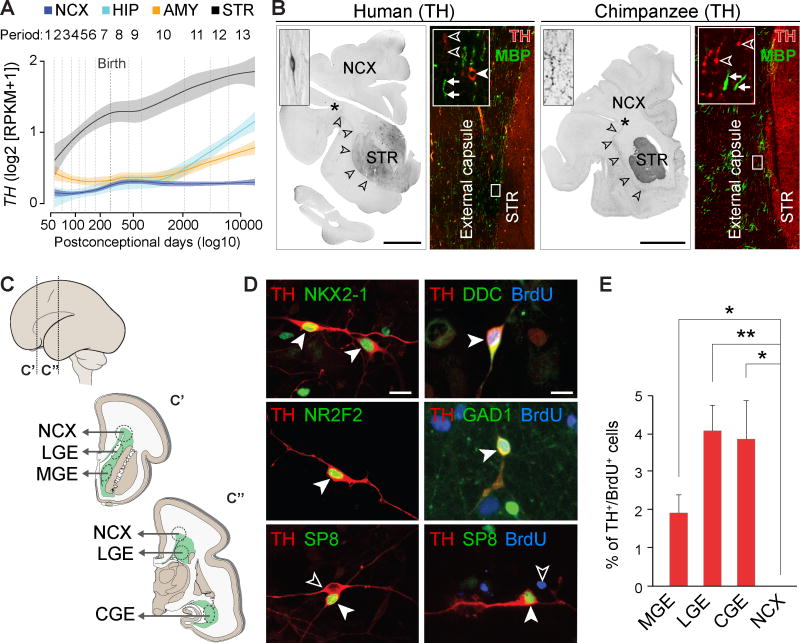
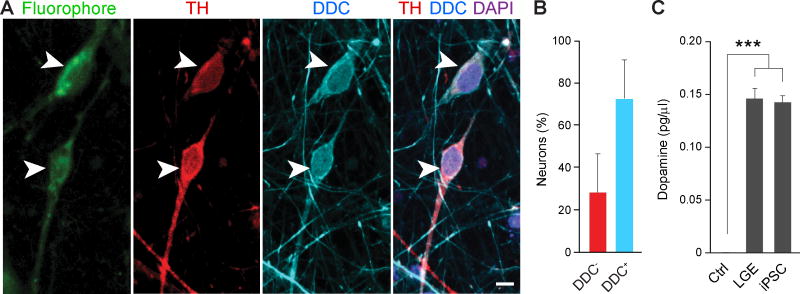
To better understand the molecular and cellular differences in brain organization between human and nonhuman primates, we performed transcriptome sequencing of 16 regions of adult human, chimpanzee, and macaque brains. Integration with human single-cell transcriptomic data revealed global, regional, and cell-type-specific species expression differences in genes representing distinct functional categories. We validated and further characterized the human specificity of genes enriched in distinct cell types through histological and functional analyses, including rare subpallial-derived interneurons expressing dopamine biosynthesis genes enriched in the human striatum and absent in the nonhuman African ape neocortex. Our integrated analysis of the generated data revealed diverse molecular and cellular features of the phylogenetic reorganization of the human brain across multiple levels, with relevance for brain function and disease.


Figures

Fig. 1
Fig. 1. Inter-species differential gene expression across sixteen brain regions
(A) Bubble matrix showing the number of mRNA genes with conserved expression (grey circles), species-specific upregulation (filled circles), or downregulation (open circles). Post-hoc comparisons described in table S2. H – human; C – chimpanzee; M – macaque. (B) Inter-species patterns of normalized miRNA expression across all regions. Guidelines indicate ± 2-fold difference. (C) Examples of protein-coding and non-coding genes exhibiting global and regional human-specific upregulation (red and circles with black borders) or downregulation (blue and circles with black borders). Additional information and validations are provided in figs. S10–S12. OFC – orbital prefrontal cortex; DFC – dorsolateral prefrontal cortex; VFC – ventrolateral prefrontal cortex; MFC – medial prefrontal cortex; M1C – primary motor cortex; S1C – primary somatosensory cortex; IPC – inferior posterior parietal cortex; A1C – primary auditory cortex; STC – superior temporal cortex; ITC – inferior temporal cortex; V1C – primary visual cortex; HIP – hippocampus; AMY – amygdala; STR – striatum; MD – mediodorsal nucleus of the thalamus; CBC – cerebellar cortex.
Fig. 2
Fig. 2. Conserved and species-specific gene co-expression modules
(A) Number of WGCNA modules (numbers on grey; see table S5) clustered by differential expression across brain regions, species, and inter-species differences across regions (interaction) (ANOVA of eigengene Bonferroni adjusted P < 0.01, solid line; ≥ 0.01, dashed line). (B) Left panel: Enrichment of gene expression for modules (columns) in several cell types (rows) based on human single-cell transcriptome data (18, 19), sorted by unsupervised hierarchical clustering to show similarities among modules. Right panel: Species-specific modules showing human (red), chimpanzee (blue), or macaque (green) upregulation (normal font) or downregulation (italics) relative to the other two species exhibit distinct patterns of cell-type associated gene expression.
Fig. 3
Fig. 3. Cellular specificity of neocortical human and chimpanzee-specific differential expression
(A–B) Radar plots depicting neocortical neuron cell-type enrichments of (A) human- or (B) chimpanzee-specific differences of genes associated with (i) neuropsychiatric disorders, (ii) neurotransmitter biosynthesis, degradation, and transport proteins, and (iii) encoding ion channels (table S10). Only genes expressed in the respective cell type are plotted. The distance of each gene from the center represents differential expression between human and the average of chimpanzee and macaque (red) or between chimpanzee and the other two species (blue). The direction of triangles denotes up- or downregulation; filled triangles represent cell-type specific expression (Pearson correlations > 0.5). (C) In situ hybridization shows that PKD2L1 is expressed in pyramid-shaped cell bodies of excitatory projection neurons of human, but not chimpanzee or macaque, neocortex. (D) TH-immunopositive interneurons (filled arrowheads) are present in neocortex of human and macaque, but not chimpanzee, where only TH+ midbrain dopaminergic axons (open arrowheads) are present. Scale bar represents 30 µm.
Fig. 4
Fig. 4. Human-specific expression of genes encoding dopamine biosynthesis enzymes
(A) TH and DDC, respectively, showing higher expression in the human striatum (STR). TH is also downregulated in the chimpanzee neocortex. Boxes represent quartiles and whiskers 1.5 times interquartile range. Red and blue asterisks represent human-specific differential expression in striatum and chimpanzee-specific differential expression combining all neocortical areas, respectively (FDR < 0.01). (B) Immunofluorescence shows co-localization of TH, DDC, and GAD1 in adult human neocortical interneurons (arrowheads). Scale bar represents 10 µm. (C) STR (caudate and putamen) shows an enrichment of TH+ interneurons in human. MFC, M1C, and STC show a complete depletion of TH+ interneurons in chimpanzee and gorilla. Asterisk represents Tukey's honest significance test P < 0.05 comparing human or chimpanzee/gorilla with all other species.
Fig. 5
Fig. 5. Human telencephalic TH+ interneurons are of subpallial origin and start to express TH protein perinatally
(A) TH expression in human neocortex (NCX), HIP, AMY, and STR throughout development. The shaded area corresponds to a confidence interval of 50%. (B) Immunohistochemistry reveals TH+ axons in external capsule (arrowheads), STR, and NCX of newborn (38 pcw) human and chimpanzee brains. Bipolar TH+ interneurons (filled arrowhead) are present in parallel with MBP+/TH− (arrows) and TH+/MBP− (open arrowheads) fibers in the external capsule. No TH+ cells were detected in chimpanzee external capsule. Scale bar represents 1 cm. (C) Schematic of dissection of ganglionic eminences (lateral [LGE], medial [MGE], and caudal [CGE]) and neocortical proliferative zones (NCX) from mid-fetal brain for primary cell culture. (D) TH+ cells from ganglionic eminences also express NKX2-1, NR2F2, or SP8, and were BrdU+, DDC+, and GAD1+. TH+ interneurons in the neocortical culture were SP8+, but BrdU− (bottom right panel). Scale bar represents 20 µm. (E) Percentage of TH+/BrdU+ cells in culture from MGE, LGE, CGE, and NCX. Error bars represent SEM. Pairwise t-tests were performed and corrected for multiple testing using Bonferroni correction. * P < 0.05; ** P < 0.01.
Fig. 6
Fig. 6. Human telencephalic TH+ interneurons synthesize and transport dopamine in vitro
Human iPSC-derived neurons were incubated with a fluorophore-labeled synthetic monoamine. (A) TH+ (red) and DDC+ (blue) immunolabeled interneurons (arrowheads) that transported monoamine-imitating fluorophore (green) in vitro. Scale bar represents 10 µm. (B) Percentage of neurons that took up the fluorophore and were positive for both the uptake assay and TH. This population is composed of DDC+ (blue) or DDC− (red) interneurons. (C) Concentration of dopamine detected by HPLC in the unused (control, Ctrl) cell culture medium, and the conditioned media from LGE and iPSC-derived cultures. Error bars represent SEM. Dunnett’s test. *** P < 0.001.

References

    1. Preuss TM. What is it like to be a human. In: Gazzaniga MS, editor. The Cognitive Neurosciences. MIT Press; Cambridge, MA: 2004. pp. 5–22.
    1. Sherwood CC, Subiaul F, Zawidzki TW. A natural history of the human mind: tracing evolutionary changes in brain and cognition. J. Anat. 2008;212:426–454. - PMC - PubMed
    1. Teffer K, Semendeferi K. Human prefrontal cortex: evolution, development, and pathology. Prog. Brain Res. 2012;195:191–218. - PubMed
    1. Gabi M, et al. No relative expansion of the number of prefrontal neurons in primate and human evolution. Proc. Nat.l Aca.d Sci. U.S.A. 2016;113:9617–9622. - PMC - PubMed
    1. Sousa AMM, Meyer KA, Santpere G, Gulden FO, Sestan N. Evolution of the human nervous system function, structure, and development. Cell. 2017;170:226–247. - PMC - PubMed

Publication types