. 2018 Jan 5;359(6371):108-114.
doi: 10.1126/science.aan6490. Epub 2017 Nov 23.

A mitosis-specific and R loop-driven ATR pathway promotes faithful chromosome segregation

Affiliations

A mitosis-specific and R loop-driven ATR pathway promotes faithful chromosome segregation

Lilian Kabeche et al. Science. .

Abstract

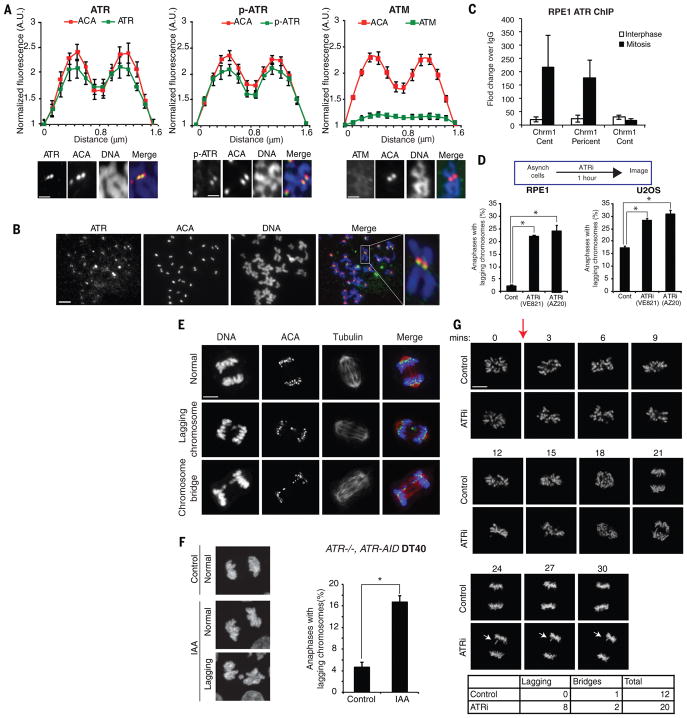
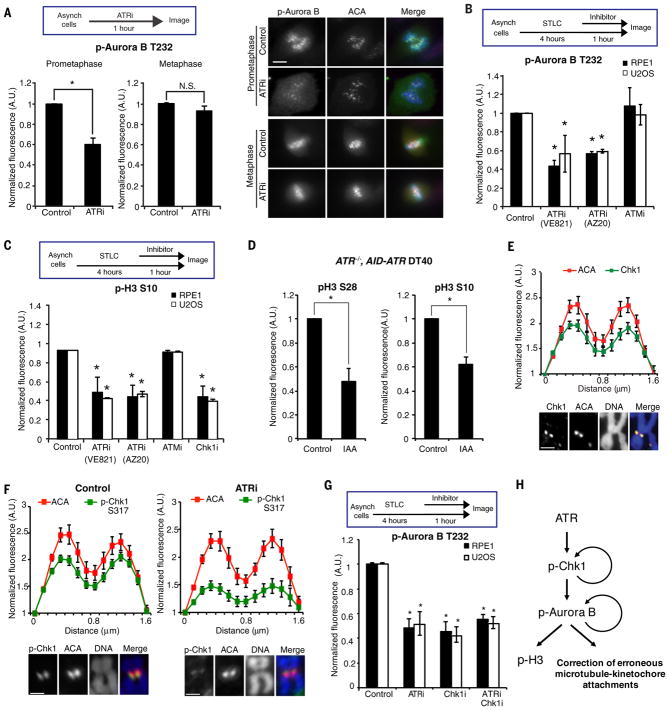
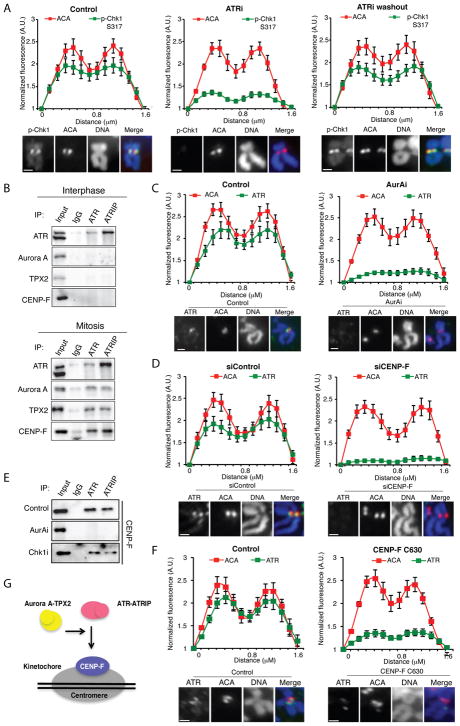
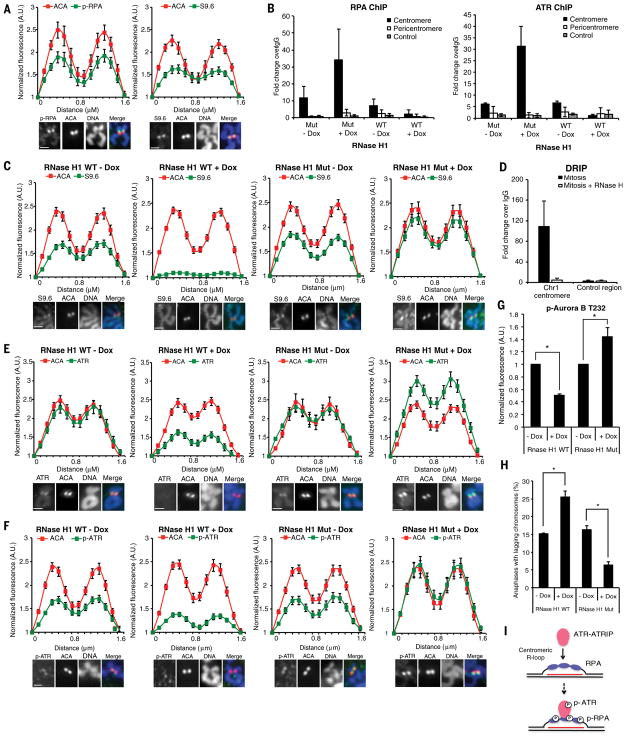
The ataxia telangiectasia mutated and Rad3-related (ATR) kinase is crucial for DNA damage and replication stress responses. Here, we describe an unexpected role of ATR in mitosis. Acute inhibition or degradation of ATR in mitosis induces whole-chromosome missegregation. The effect of ATR ablation is not due to altered cyclin-dependent kinase 1 (CDK1) activity, DNA damage responses, or unscheduled DNA synthesis but to loss of an ATR function at centromeres. In mitosis, ATR localizes to centromeres through Aurora A-regulated association with centromere protein F (CENP-F), allowing ATR to engage replication protein A (RPA)-coated centromeric R loops. As ATR is activated at centromeres, it stimulates Aurora B through Chk1, preventing formation of lagging chromosomes. Thus, a mitosis-specific and R loop-driven ATR pathway acts at centromeres to promote faithful chromosome segregation, revealing functions of R loops and ATR in suppressing chromosome instability.


Figures

Figure 1
Figure 1. ATR localizes to centromeres in mitosis and promotes accurate whole-chromosome segregation
(A) Line scan analysis (top) and representative images (bottom) of fluorescence of ATR, phospho-ATR S1989 (p-ATR), ATM, and ACA at centromeres in chromosome spreads of RPE1 cells. Cells were arrested with nocodazole for 5 h. Centromeric fluorescence intensities of the indicated proteins are normalized to the background fluorescence near centromeres (see Methods). Scale bar, 2 μm. (B) Chromosome spreads of unsynchronized mitotic RPE1 cells were stained for ATR and ACA. Asynchronously growing cells were treated with nocodazole for 15 min to facilitate spreading of chromosomes. Scale bar, 10 μm. (C) Quantitative PCR of ATR ChIP in mitotic and interphase RPE1 cells. (D) Percentage of anaphase RPE1 and U2OS cells (>300 anaphases analyzed per condition) with lagging chromosomes after mock or ATRi (10 μM VE-821, 1 h) treatments. (E) Representative images of anaphase RPE1 cells in (D). Scale bar, 5 μm. (F) ATR−/−, AID-ATR DT40 cells were untreated or treated with 0.5 mM indole-3-acetic acid (IAA) for 30 min to induce AID-ATR degradation. Representative maximum projection images of anaphase cells (left) and quantification of cells with lagging chromosomes (right) are shown (>300 anaphases analyzed per condition). Scale bar, 5 μm. (G) Time-lapse imaging of H2B-GFP expressing RPE1 cells untreated or treated with ATRi. Red arrow signifies time of treatment. A lagging chromosome is demarcated by white arrows. Scale bar, 5 μm. Error bars in all panels represent SEM. *P ≤ 0.01, two-tailed t-test.
Figure 2
Figure 2. ATR promotes Aurora B activation at centromeres
(A) Fluorescence intensity of phospho-Aurora B T232 (p-Aurora B) at centromeres in prometaphase or metaphase RPE1 cells untreated or treated with ATRi for 1 h (left). Representative images of untreated and ATRi-treated cells (right). Scale bar, 5 μm. (B–C) Fluorescence intensities of centromeric p-Aurora B (B) and overall p-H3 S10 (C) in S-Trityl L-cysteine (STLC)-arrested prometaphase cells after mock treatments or treatments with the indicated inhibitors for 1 h. (D) Fluorescence intensities of p-H3 S28 and p-H3 S10 in ATR−/−, AID-ATR DT40 cells untreated or treated with IAA for 30 min. (E) Line scan analysis of Chk1 and ACA at centromeres in chromosome spreads of RPE1 cells. Cells were arrested with nocodazole for 5 h. Scale bar, 2μm. (F) Line scan analysis of p-Chk1 and ACA at centromeres in chromosome spreads of RPE1 cells. Cell were arrested with nocodazole for 4 h and then mock or ATRi treated for 1 h. Scale bar, 2μm. (G) Fluorescence intensity of centromeric p-Aurora B in STLC-arrested prometaphase cells after mock treatments or treatments with the indicated inhibitors. Error bars in all panels represent SEM. *P ≤ 0.01, two-tailed t-test. (H) A schema of the ATR-Chk1-Aurora B pathway in mitosis. This pathway is required for full Aurora B activation, which is necessary for H3 phosphorylation and proper kinetochore-microtubule attachment.
Figure 3
Figure 3. ATR localizes to centromeres in an Aurora A and CENP-F-dependent manner
(A) Line scan analysis (top) and representative images (bottom) of centromeric p-Chk1 and ACA in chromosome spreads of RPE1 cells. Mitotic cells were isolated by shake off after 4h of nocodazole treatment. Cells were then mock treated (control) or treated with 2 μM VE-821 (ATRi) for 1 h in the presence of nocodazole. The ATRi washout sample was released from VE-821 for 1 h in the presence of nocodazole. (B) Immunoprecipitates of endogenous ATR and ATRIP from interphase (top) or mitotic (bottom) RPE1 cell extracts. Input = 5%. (C) Line scan analysis (top) and representative images (bottom) of centromeric ATR in chromosome spreads of RPE1 cells. Cells were arrested with nocodazole for 4h and then mock or AurAi treated for 1 h. (D) Line scan analysis of centromeric ATR and ACA in chromosome spreads of RPE1 cells. Cells were treated with control or CENP-F siRNA and arrested with nocodazole for 5 h. (E) CENP-F in the immunoprecipitates of endogenous ATR and ATRIP from mitotic RPE1 cell extracts. Cells were treated with AurAi and Chk1i as indicated. Input = 5%. (F) Line scan analysis (top) and representative images (bottom) of centromeric ATR and ACA in U2OS cells uninfected or infected with CENP-F C630 expressing retrovirus. Scale bar in all panels, 2 μm. Error bars in all panels represent SEM. *P ≤ 0.01, two-tailed t-test. (G) A model in which ATR is recruited to the vicinity of centromeres through an interaction with CENP-F. This interaction is dependent on Aurora A activity and occurs specifically in mitosis.
Figure 4
Figure 4. ATR activation at centromeres is driven by R loops
(A) Line scan analysis (top) and representative images (bottom) of centromeric phospho-RPA32 S33 (p-RPA), S9.6, and ACA in chromosome spreads of RPE1 cells. Scale bar, 2 μm. (B) Quantitative PCR of RPA (right) or ATR (left) ChIP in HeLa-derived RNaseH1 WT/MUT inducible cell lines. Cells were synchronized in G2 with CDK1i, uninduced or induced with Dox for 4 h, and released into mitosis in the presence of nocodazole for 1 h (see Methods). (C,E,F) Line scan analysis (top) and representative images (bottom) of centromeric S9.6 (C), ATR (E), p-ATR (F), and ACA in RNaseH1 WT/MUT inducible cell lines. Cells were treated as in (B). Scale bar, 2 μm. (D) Quantitative PCR of DRIP in mitotic RPE1 cells. (G) Relative fluorescence intensity of p-Aurora B in RNaseH1 WT/MUT inducible cell lines. Cells were treated as in (B). (F) Percentage of anaphase cells with lagging chromosomes. Cells were treated as in (B). Scale bar for all panels, 2μm. Error bars in all panels represent SEM. *P ≤ 0.01, two-tailed t-test. (I) A model in which ATR-ATRIP is recruited to and activated by RPA-coated centromeric R loops in mitosis. The red line depicts centromeric RNA hybridized with DNA.

Comment in

References

    1. Yazinski SA, Zou L. Functions, Regulation, and Therapeutic Implications of the ATR Checkpoint Pathway. Annu Rev Genet. 2016;50:155–173. - PubMed
    1. Brown EJ, Baltimore D. ATR disruption leads to chromosomal fragmentation and early embryonic lethality. Genes Dev. 2000;14:397–402. - PMC - PubMed
    1. Casper AM, Nghiem P, Arlt MF, Glover TW. ATR regulates fragile site stability. Cell. 2002;111:779–789. - PubMed
    1. Buisson R, Boisvert JL, Benes CH, Zou L. Distinct but Concerted Roles of ATR, DNA-PK, and Chk1 in Countering Replication Stress during S Phase. Mol Cell. 2015;59:1011–1024. - PMC - PubMed
    1. Holland AJ, Cleveland DW. Boveri revisited: chromosomal instability, aneuploidy and tumorigenesis. Nat Rev Mol Cell Biol. 2009;10:478–487. - PMC - PubMed

Publication types

MeSH terms