. 2017 Dec 15;358(6369):1443-1448.
doi: 10.1126/science.aal5240. Epub 2017 Nov 23.

Analysis of Fusobacterium persistence and antibiotic response in colorectal cancer

Affiliations

Analysis of Fusobacterium persistence and antibiotic response in colorectal cancer

Susan Bullman et al. Science. .

Abstract

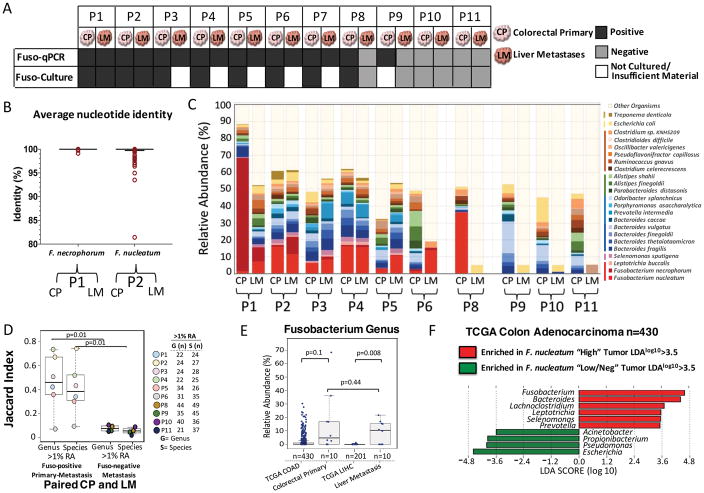
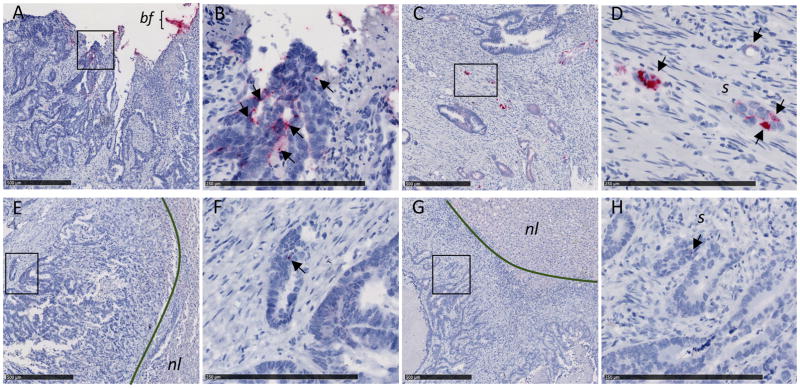
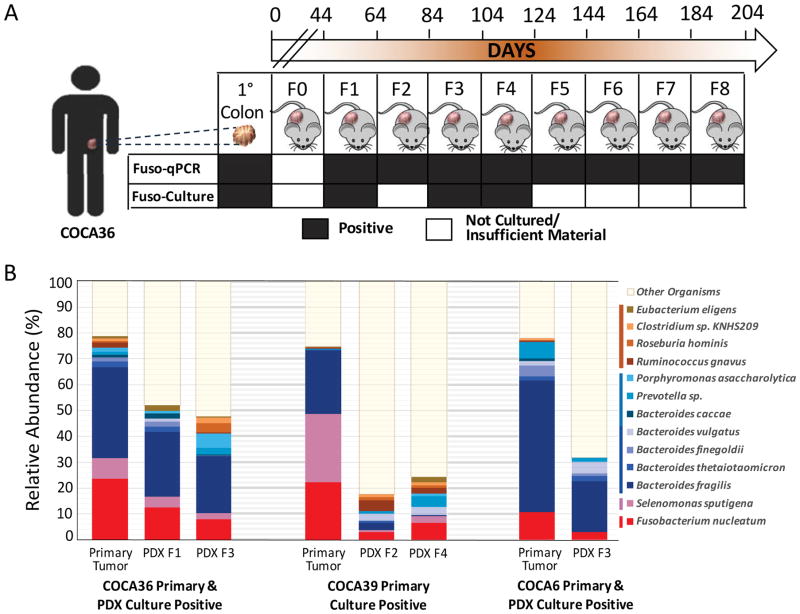
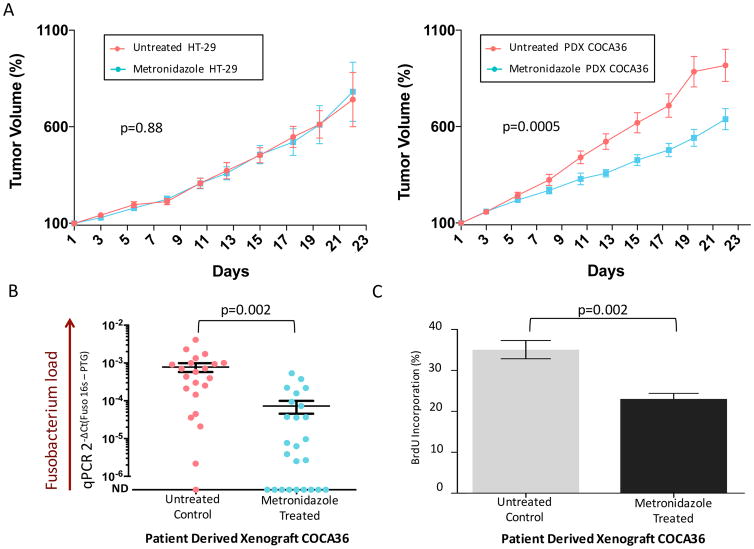
Colorectal cancers comprise a complex mixture of malignant cells, nontransformed cells, and microorganisms. Fusobacterium nucleatum is among the most prevalent bacterial species in colorectal cancer tissues. Here we show that colonization of human colorectal cancers with Fusobacterium and its associated microbiome-including Bacteroides, Selenomonas, and Prevotella species-is maintained in distal metastases, demonstrating microbiome stability between paired primary and metastatic tumors. In situ hybridization analysis revealed that Fusobacterium is predominantly associated with cancer cells in the metastatic lesions. Mouse xenografts of human primary colorectal adenocarcinomas were found to retain viable Fusobacterium and its associated microbiome through successive passages. Treatment of mice bearing a colon cancer xenograft with the antibiotic metronidazole reduced Fusobacterium load, cancer cell proliferation, and overall tumor growth. These observations argue for further investigation of antimicrobial interventions as a potential treatment for patients with Fusobacterium-associated colorectal cancer.


Figures

Fig. 1
Fig. 1. Fusobacterium colonizes liver metastases of Fusobacterium associated colorectal primary tumors
(A) Schematic of Fusobacterium culture and Fusobacterium-targeted qPCR status of paired snap-frozen colorectal primary tumors and liver metastases from 11 patients (P1 to P11) from the frozen paired cohort. (B) Aligned dot plot representing the average nucleotide identity (ANI) of whole-genome sequencing data from F. necrophorum isolated from paired primary colorectal tumor (CP) and liver metastasis (LM) of P1 and F. nucleatum isolate cultured from paired primary tumors and liver metastasis of P2. F. necrophorum P1 two-way ANI: 100% (SD: 0.01%) from 10,220 fragments; F. nucleatum P2 two-way ANI: 99.99% (SD: 0.23%) from 7334 fragments. (C) Species-level microbial composition of paired colorectal primary tumors and liver metastases (frozen paired cohort), assayed by RNA sequencing followed by PathSeq analysis for microbial identification. For simplicity, only organisms with >2% relative abundance (RA) in at least one tumor are shown. The colors correspond to bacterial taxonomic class. Red, Fusobacteriia; pink, Negativicutes; blue/green, Bacteroidia; orange, Clostridia; yellow, Gamma-proteobacteria; dark brown, Spirochaetes. The samples are separated into three groups: Fusobacterium-positive primary tumor and metastases (n = 6 pairs), Fusobacterium-positive primary tumor and Fusobacterium-negative metastases (n = 1 pair), and Fusobacterium-negative primary tumor and metastases (n = 3 pairs). P7 had insufficient tissue for RNA sequencing analysis. (D) Box plots represent the Jaccard index (proportion of shared genera or species) between paired colorectal primary tumors and liver metastases at both the genus and species level at 1% RA. The box represents the first and third quartiles, and error bars indicate the 95% confidence level of the median. Paired samples that were positive for Fusobacterium in both the primary tumor and metastasis were compared with paired samples where the metastasis was Fusobacterium-negative. P values were determined using Welch’s two-sample t test. (E) Box plots of Fusobacterium RA in primary colon adenocarcinoma (COAD) (n = 430) and primary liver hepatocellular carcinoma (LIHC) (n = 201) from TCGA (TCGA cohort) and primary-metastasis pairs from 10 patients. The box represents the first and third quartiles, and error bars indicate the 95% confidence level of the median. P values were determined using Welch’s two-sample t test with correction for unequal variances. (F) Identification of bacteria that co-occur with Fusobacterium in primary COAD (TCGA cohort). Primary COAD tumors were subset into two groups: Fusobacterium “High” if Fusobacterium RA was >1% (n = 110, median RA = 5%, mean RA = 7.4%) and Fusobacterium “Low/Neg” if RA was <1% (n = 320, median RA = 0.06%, mean RA = 0.16%). The bar plot illustrates genera enriched (red) and depleted (green) in COAD with >1% Fusobacterium RA. LDA, linear discriminant analysis.
Fig. 2
Fig. 2. F. nucleatum RNA ISH analysis of matched primary colorectal tumors and liver metastases
Representative images of F. nucleatum spatial distribution in paired samples from P187 primary colorectal tumor (A and B) and liver metastasis (E and F) and P188 primary colorectal tumor (C and D) and liver metastasis (G and H) from the FFPE paired cohort are shown. Arrows indicate cells with histomorphology consistent with that of colon cancer cells infected by invasive F. nucleatum (red dots) in both primary colorectal tumors (B and D) and matched liver metastases (F and H). Fusobacterium-containing biofilm (bf) is highlighted in the colorectal tumor of P187 (A). Fusobacterium was not detected in normal liver (nl) tissue [(E) and (F)]. s, stroma. Panels (B), (D), (F), and (H) show magnification of the boxed areas in (A), (C), (E), and (G), respectively. Scale bars: 500 mm in (A), (C), (E), and (G); 250 mm in (B), (D), (F), and (H).
Fig. 3
Fig. 3. Fusobacterium and co-occurring anaerobes persist in colon adenocarcinoma PDXs
(A) Assessment of Fusobacterium persistence in PDX COCA36 over a period of 204 days. Fusobacterium persistence was determined via microbial culture and Fusobacterium-targeted qPCR. F0 denotes the first implantation of the tumor into mice; F1 to F8 represent sequential xenograft passages after F0. (B) Species-level microbial composition of three patient primary colon adenocarcinomas (COCA36, COCA39, and COCA6) and subsequent PDXs. Total RNA sequencing was carried out, followed by PathSeq analysis for microbial identification. For simplicity, selected species with >1% relative abundance in the primary tumor and either corresponding PDX are shown. The colors correspond to bacterial taxonomic class. Red, Fusobacteriia; pink, Negativicutes; blue/green, Bacteroidia; orange, Clostridia.
Fig. 4
Fig. 4. Treatment of Fusobacterium-colonized PDXs with metronidazole reduces tumor growth in vivo
(A) (Left) Tumor volume percentage of Fusobacterium-free xenografts derived from HT-29 cells treated with metronidazole (treated; 19 animals) or with vehicle (untreated; 20 animals). (Right) Tumor volume percentage of Fusobacterium-positive PDX tumors (COCA36) treated with metronidazole (treated; 25 animals) or with vehicle (untreated; 22 animals). P values were determined by the Wald test. Tumors were measured in a blinded fashion on Mondays, Wednesdays, and Fridays each week. Error bars represent mean ± SEM. The remaining number of HT-29-derived xenografts and PDX-implanted animals at each time point is included in the supplementary materials. (B) Assessment of Fusobacterium tissue load. Fusobacterium-targeted qPCR on PDX tissue (COCA36) after treatment with metronidazole (treated) or with vehicle (untreated). ND, not detected. The center bar represents the mean; error bars indicate SEM. P values were determined using Welch’s two-sample t test. DCt, delta cycle threshold; PTG, prostaglandin transporter. (C) Bromodeoxyuridine (BrdU) immunohistochemistry of PDX tumors to assess cell proliferation. The bar plot represents the percentage of cells with BrdU incorporation in treated and untreated PDXs (n = 6 animals). per arm); error bars denote mean ± SEM. P values were determined using the Welch’s two-sample t test.

Comment in

Similar articles

Cited by

References

    1. Arthur JC, Perez-Chanona E, Mühlbauer M, Tomkovich S, Uronis JM, Fan TJ, Campbell BJ, Abujamel T, Dogan B, Rogers AB, Rhodes JM, Stintzi A, Simpson KW, Hansen JJ, Keku TO, Fodor AA, Jobin C. Intestinal inflammation targets cancer-inducing activity of the microbiota. Science. 2012;338:120–123. doi: 10.1126/science.1224820. - DOI - PMC - PubMed
    1. Hope ME, Hold GL, Kain R, El-Omar EM. Sporadic colorectal cancer – role of the commensal microbiota. FEMS Microbiol Lett. 2005;244:1–7. doi: 10.1016/j.femsle.2005.01.029. - DOI - PubMed
    1. Rowland IR. The role of the gastrointestinal microbiota in colorectal cancer. Curr Pharm Des. 2009;15:1524–1527. doi: 10.2174/138161209788168191. - DOI - PubMed
    1. Wu S, Rhee KJ, Albesiano E, Rabizadeh S, Wu X, Yen HR, Huso DL, Brancati FL, Wick E, McAllister F, Housseau F, Pardoll DM, Sears CL. A human colonic commensal promotes colon tumorigenesis via activation of T helper type 17 T cell responses. Nat Med. 2009;15:1016–1022. doi: 10.1038/nm.2015. - DOI - PMC - PubMed
    1. Yang L, Pei Z. Bacteria, inflammation, and colon cancer. World J Gastroenterol. 2006;12:6741–6746. doi: 10.3748/wjg.v12.i42.6741. - DOI - PMC - PubMed

Publication types

MeSH terms