. 2017 Nov 23;8(1):1725.
doi: 10.1038/s41467-017-01783-y.

Stress-responsive FKBP51 regulates AKT2-AS160 signaling and metabolic function

Affiliations

Stress-responsive FKBP51 regulates AKT2-AS160 signaling and metabolic function

Georgia Balsevich et al. Nat Commun. .

Abstract

The co-chaperone FKBP5 is a stress-responsive protein-regulating stress reactivity, and its genetic variants are associated with T2D related traits and other stress-related disorders. Here we show that FKBP51 plays a role in energy and glucose homeostasis. Fkbp5 knockout (51KO) mice are protected from high-fat diet-induced weight gain, show improved glucose tolerance and increased insulin signaling in skeletal muscle. Chronic treatment with a novel FKBP51 antagonist, SAFit2, recapitulates the effects of FKBP51 deletion on both body weight regulation and glucose tolerance. Using shorter SAFit2 treatment, we show that glucose tolerance improvement precedes the reduction in body weight. Mechanistically, we identify a novel association between FKBP51 and AS160, a substrate of AKT2 that is involved in glucose uptake. FKBP51 antagonism increases the phosphorylation of AS160, increases glucose transporter 4 expression at the plasma membrane, and ultimately enhances glucose uptake in skeletal myotubes. We propose FKBP51 as a mediator between stress and T2D development, and potential target for therapeutic approaches.


Conflict of interest statement

The authors declare no competing financial interests.

Figures

Fig. 1
Fig. 1
Genetic ablation of FKBP51 prevents HFD-induced weight gain. a 51KO mice (n = 16) presented lowered body weight, decreased fat mass, and increased lean mass compared to WT littermates (n = 18) at the onset of the dietary feeding period. b 51KO mice weighed significantly less than WT mice throughout the 8-week dietary treatment and at the experimental end (n = 9 WT-Chow, n = 9 WT-HFD, n = 9 51KO-Chow, n = 7 51KO-HFD). Whereas WT mice were susceptible to HFD-induced weight gain, 51KO mice were not as interpreted from weight progression and final body weight (following 8 weeks on respective diets). c After 8 weeks on the dietary treatment, 51KO mice presented decreased fat pad weights for epididymal (e), inguinal (i), and perirenal (p) white adipose tissues (WAT) compared to WT counterparts whereas presented no change in brown adipose tissue (BAT) mass. HFD exposure significantly increased fat pad mass, regardless of genotype. Lean mass was adjusted for body weight and is expressed for a 30-g mouse. Data are represented as mean ± SEM. + P < 0.05, ++ P < 0.01, +++ P < 0.001; # P < 0.05, ## P < 0.01, ### P < 0.001, two-tailed t test for a, Repeated measures ANOVA and two-way ANOVA for b, two-way ANOVA for c; + significant genotype effect; # significant diet effect
Fig. 2
Fig. 2
Genetic ablation of FKBP51 improves glucose tolerance. a Blood glucose following a 14 h fast was significantly lower in 51KO mice compared to WT mice. b In the GTT, a HFD impaired glucose tolerance in WT mice but not in 51KO mice. c The glucose area under curve (AUC) illustrates the effect of genotype and diet on glucose tolerance. d, e Fasted insulin and glucose-stimulated insulin were significantly elevated from HFD exposure independent of genotype. f In HFD-fed mice, loss of FKBP51 significantly reduced insulin tolerance. Importantly blood glucose remained significantly lower 120 min following insulin administration on account of FKBP51 deletion under both chow conditions and HFD conditions. g The glucose AUC for ITT demonstrates the strong diet effect and a trend for genotype. n = 8 WT-Control, n = 10 WT-HFD, n = 12 51KO-Control, n = 13 51KO-HFD. Data are represented as mean ± SEM. + P < 0.05, ++ P < 0.01, +++ P < 0.001; # P < 0.05, ## P < 0.01, ### P < 0.001, T P < 0.1, two-way ANOVA for a, Repeated measures ANOVA for b, f, two-way ANOVA for ce and g; + significant genotype effect; # significant diet effect; T significant trend for genotype
Fig. 3
Fig. 3
FKBP51 antagonism parallels the metabolic effects resulting from genetic ablation of FKBP51. a A single application of a slow-release-formulated SAFit2 gel had no effect on glucose tolerance or (b) Body weight under control diet conditions. c Under HFD conditions, acute administration of SAFit2 gel significantly improved glucose tolerance. d The effects of SAFit2 on glucose tolerance under HFD conditions were not present in 51KO. e Despite the effects of acute SAFit2 on glucose tolerance under HFD conditions, there was no effect on body weight (f) 10-day SAFit2 treatment had no significant effect on body weight. g Despite no effect on body weight, SAFit2 treatment significantly improved glucose tolerance as reflected in the glucose area under the curve (AUC) for the GTT measured on treatment day 8. h At the experimental end point (following 30 days of treatment), mice treated with SAFit2 weighed significantly less than their diet counterparts. Nevertheless, mice fed with the HFD remained significantly heavier independent of treatment. i The extended SAFit2 treatment schedule furthermore protected against HFD-induced impaired glucose tolerance as reflected in the glucose AUC measured on day 25. For acute treatment schedule in C57BL6 n = 12 per treatment group; for acute treatment in 51KO n = 8 per treatment group. For the 10-day treatment schedule, n = 8 per treatment group. For 30-day treatment schedule n = 12 Vehicle-Control, n = 13 SAFit2-Control, n = 12 Vehicle-HFD, n = 13 SAFit2-HFD. The data are represented as mean ± SEM. + P < 0.05; # P < 0.05, two-tailed t test for ag, two-way ANOVA for h, two-way ANOVA plus Bonferroni testing for i; + significant treatment effect; # significant diet effect
Fig. 4
Fig. 4
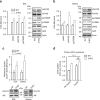
FKBP51 affects insulin signaling and consequently glucose uptake. a, b Insulin signaling was enhanced in EDL (a) and soleus (b) skeletal muscles of 51KO mice compared to WT mice as assessed by pAKT2, pAS160, and pp70S6K protein expression. c Following subcellular fractionation to isolate the plasma membrane compartment, we observed increased GLUT4 expression in skeletal muscle membrane fractions of 51KO mice. d In primary EDL myotubes, loss of FKBP51 heightened glucose uptake under both no insulin and insulin-stimulated states. For quantification of phosphorylated protein, n = 6 per group. For GLUT4 membrane localization, n = 3 per group. For glucose uptake experiments, 3 wells for each condition were measured. The data are expressed as relative fold change compared to wild-type condition ± SEM. + P < 0.05, ++ P < 0.01, +++ P < 0.001, ## P < 0.01, two-tailed t tests for ad, two-way ANOVA for e; + significant genotype effect, # significant insulin effect, T trend for genotype. Supplementary Fig. 12 shows uncropped gel images
Fig. 5
Fig. 5
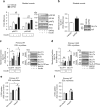
FKBP51 antagonism affects insulin signaling and consequently glucose uptake. a The insulin signaling pathway was enhanced in EDL skeletal muscle of mice treated with SAFit2 compared to vehicle-treated mice, independent of insulin, as assessed by pAKT2, and pAS160 protein expression. b GLUT4 expression at the membrane was increased 6 h following SAFit2 treatment in soleus skeletal muscle. c GLUT4 expression at the membrane was increased from SAFit2 treatment in primary EDL myotubes from WT mice, whereas GLUT1 expression was unchanged by SAFit2 treatment. d SAFit2 had no effect on GLUT4 plasma membrane expression in primary EDL muscle cells collected from 51KO mice. e FKBP51 antagonism with SAFit2 increased 2-deoxyglucose uptake in primary EDL muscle cells collected from WT mice independent of insulin condition. f SAFit2 had no effect on 2-deoxyglucose uptake in primary 51KO muscle cells. For quantification of phosphorylated protein expression in mice, n = 6 per group. For quantification of GLUT4 expression in mice, n = 7 per treatment. For GLUT1/4 expression in primary EDL myotubes, n = 3 per group. For glucose uptake experiments, 3 wells for each condition were measured. Data are expressed as relative fold change compared to vehicle condition ± SEM. + P < 0.05, ++ P < 0.01, # P < 0.05, ## P < 0.01, two-way ANOVA for af; + significant treatment effect, # significant insulin effect, T trend (p < 0.1) for insulin effect. Supplementary Figs. 13 and 14 show uncropped gel images
Fig. 6
Fig. 6
FKBP51 antagonism affects AKT2-AS160 signaling complex. Tissue lysates from 30-day vehicle-treated or SAFit2-treated mice exposed to HFD were immunoprecipitated with anti-AKT2 and anti-FKBP51 and then analyzed by Western blot using FKBP51, (p)AKT2, (p)AS160, and PHLPP1. a, b Immunoprecipitation reactions revealed that SAFit2 treatment increased binding between (p)AKT2 and (p)AS160 in soleus (a) and EDL (b) muscles, while simultaneously decreased binding between FKBP51 and AS160 in both muscle types. For co-immunoprecipitation experiments n = 3 per group. Data are expressed as relative fold change compared to vehicle condition ± SEM. + P < 0.05, two-tailed t tests for a, b; + significant SAFit2 treatment effect. Supplementary Fig. 15 shows uncropped gel images
Fig. 7
Fig. 7
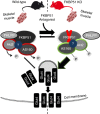
Proposed model of FKBP51 as a regulator of glucose uptake. FKBP51 scaffolds Akt2, PHLPP1, and AS160. The associations between FKBP51, AKT2, PHLPP1, and AS160 may be either direct or indirect through additional intermediate proteins. In the presence of FKBP51, PHLPP1 phosphatase activity is directed towards AKT2 to favor inactive Akt2, decreased AS160 phosphorylation and reduced glucose uptake. By contrast, loss of FKBP51’s scaffolding function leads to increased AKT2. In the presence of SAFit2, a conformational change within FKBP51 disrupts its ability to form a complex with AS160, while simultaneously enhancing AKT2-AS160 binding. Ultimately, loss of FKBP51 and FKBP51 antagonism with SAFit2 both promote glucose uptake. “?” refers to possible unidentified intermediate proteins within the FKBP51 signaling complex. Curved arrows indicate PHLPP1-mediated dephosphorylation of AKT2 at Ser473. The green double arrow indicates enhanced binding between AKT2 and AS160. Green outlines reflect enhanced phosphorylation; red outlines reflect decreased phosphorylation. The width of the arrows correspond to the magnitude of downstream activation

Similar articles

Cited by

References

    1. Ratajczak T, Cluning C, Ward BK. Steroid receptor-associated immunophilins: A gateway to steroid signalling. Clin. Biochem. Rev. 2015;36:31–52. - PMC - PubMed
    1. Denny WB, Valentine DL, Reynolds PD, Smith DF, Scammell JG. Squirrel monkey immunophilin {FKBP}51 is a potent inhibitor of glucocorticoid receptor binding. Endocrinology. 2000;141:4107–4113. doi: 10.1210/endo.141.11.7785. - DOI - PubMed
    1. Wochnik GM, et al. {FK}506-binding proteins 51 and 52 differentially regulate dynein interaction and nuclear translocation of the glucocorticoid receptor in mammalian cells. J. Biol. Chem. 2005;280:4609–4616. doi: 10.1074/jbc.M407498200. - DOI - PubMed
    1. Vermeer H, Hendriks-Stegeman BI, van der Burg B, van Buul-Offers SC, Jansen M. Glucocorticoid-induced increase in lymphocytic {FKBP}51 messenger ribonucleic acid expression: a potential marker for glucocorticoid sensitivity, potency, and bioavailability. J. Clin. Endocrinol. Metab. 2003;88:277–284. doi: 10.1210/jc.2002-020354. - DOI - PubMed
    1. Jääskeläinen T, Makkonen H, Palvimo JJ. Steroid up-regulation of FKBP51 and its role in hormone signaling. Curr. Opin. Pharmacol. 2011;11:326–331. doi: 10.1016/j.coph.2011.04.006. - DOI - PubMed

Publication types

MeSH terms

LinkOut - more resources